The Irula community constitutes a small tribal community living in different parts of India and their main occupation is snake catching. They have rich knowledge about medicinal plants and their uses against various ailments. Snake bites are the common acute medical emergency faced by rural people. Even though Anti Venom Serum (AVS) is used as a remedy for snake bites in hospitals and in primary health centres, the rural people still depend on antidotes from medicinal plants. To counter the emergencies due to snake bites, the plants/parts of the plants are used alone or in combinations with other plants to make anti-dotes. The survey reports thirty traditional medicinal plants which are used by Irula against snake bites. These plants must contain some compounds responsible for snake venom inhibition. Venom neutralization or anti-inflammatory properties of the compounds identified from these plants have not been reported. Our present study reports the phytochemical analysis of the extracts from four plants which are commonly found and some of these compounds are identified as anti-inflammatory agents. Screened compounds are chosen for finding the binding affinity with PLA2 targets using the commercial Schrodinger software. Molecular Dynamics simulations were also carried out for the most favourable compounds and stability was checked upto 50ns.
anti dotes, anti-inflammatory, snake venom and phytoconstituents.
The medicinal plants are the reservoirs of phytochemicals for curing human ailments and they play an important role in healing. They constitute an effective source of both traditional and modern medicines. Phytochemicals are naturally occurring in the different parts of plants (leaves, flowers, vegetables, root, stem, and bark) that have definite physiological action on the human body [1]. Herbal medicine has been shown to have genuine utility of about 80% of rural population which depends on it as primary health care (WHO, 2005). But, with the advent of modern technology and transformation of culture, this traditional practice has been decreasing gradually [2]. Irula is the tribal community in different parts of India, their occupation is snake catching and they know well about the medicinal plants and their uses against various diseases, particularly against snake bites [3]. Since snake bites lead to high mortality, the remedies are of great importance. To counter this, most of the tribal remedies are a combination of medicinal plants [4]. The survey conducted with the herbal healers and Irula tribes of Tamilnadu, resulted in thirty traditional medicinal plants, which are used by Irula against snake bites [5]. These plants must contain some compounds responsible for snake venom inhibition. Venom neutralization or anti-inflammatory properties of the compounds identified from these plants have not been reported. In this connection, phytochemical analysis of four herbal plants were carried out and the screened compounds were subjected to computational studies to find the binding mechanism with the suitable macromolecular PLA2 targets. Many phytoconstituents that are present in the four plants are identified as anti-inflammatory agents.
Inflammation
A major component of snake venom was known to be Phospholipase A2 (PLA2 ) [6]. PLA2 catalyses the hydrolysis of the ester linkage at the sn-2 position of phospholipids, leading to the production of free arachidonic acid and lysophospholipids [7]. This further digested by cyclooxygenase leads to the biosynthesis of proinflammatory compounds that are known as eicosinoids. The eicosinoids are implicate the triggering of inflammation. The PLA2 family is classified into two forms; cytosolic isoforms and secretary isoforms, involved in signal transduction pathway and inflammation pathway [8]. The catalytic mechanism of PLA2 is common throughout the family with the conserved three-dimensional structure, but only at the sequence level, differences can be observed [9,10]. PLA2 exists as monomer, dimer and trimeric form depending on the source [11]. The three dimensional structure of PLA2 includes three helices (H1, H2, H3), two short helices (SH4, SH5) and with β sheets (β1, β2) in antiparallel direction [12,13] The catalytic triad comprises His 48, Asp49, Gly30, Cys45 residues and it possesses calcium coordination for its catalytic activity [14]. The calcium binding loop and Asp49 are most important for calcium coordination and catalytic mechanism. The venom PLA2 does not have calcium ion coordination in the native and complex form. Calcium ion coordination can acquire only when it reacts with aggregated substrates [15,16]. The compounds, which are inhibiting PLA2, can be potent anti-inflammatory agents. Molecular docking was carried out with the screened compounds at the active site of PLA2. To confirm the stability of docked complexes and also for the analysis of radius of gyration, RMSD, RMSF, hydrogen bonds, etc., molecular dynamics simulation has been carried out and trajectories were analyzed.
Plant materials
The present study includes plant species Acalypha indica (whole plant, fresh leaves)., Corollacarpus epigaeuss (tuber)., Leucas aspera Spreng (whole plant) and Tinospora cordifolia (fresh leaves).
Sample Collections
The fresh and healthy plants and leaves were collected from Chennai and its surroundings. The samples were washed under running tap water, shade dried for a few days (tuber was chopped into fine pieces) and crushed into fine power. 10g of each sample was soaked in to 100ml methanol and continuous stirring was carried out for overnight. The extract was filtered and the solvent was allowed to evaporate at the room temperature. Finally the extracts were collected and GC-MS analysis of these extracts was undertaken at Bureu Veritas Consumaer Products Services (I) Pvt. Ltd., Chennai, Tamilnadu. Mass spectrogram of GC-MS was analyzed using the database of about 1,50,000 compounds available in NIST library. The spectrum of the known compounds stored in the library was compared with the unknown compounds in the spectrum for identification.
Molecular Docking
Molecular docking studies are used to determine the interaction of two molecules and to find the best orientation of ligand, which would form a complex with overall minimum energy. When a ligand molecule is docked at the active site of macromolecular targets, conformational changes may occur in some of the amino acid residues at the active site. In order to find the best fit at the active site, flexibility has to be provided not only for the ligand but also for the active site residues. However, this involves lot of computational time for the analysis hence to start with, the active site is assumed rigid and flexibility is provided only for ligand. In this way, a filtration can be made to few ligands when the input is involved with many ligands. After the selection of the small number of ligands using rigid docking, flexibility will now be provided to the active site region also. This is called Induced Fit Docking (IFD).
Molecular mechanics force fields are used to estimate the binding affinity between receptor and ligand that have been docked. The various components are contributing to the binding free energy. It can be written as
∆G bind= ∆Gsolvent+∆Gconf+∆Gint+∆Grot+∆Gtor+∆Gvib
The components consist of solvent effects, conformational changes in the protein and ligand, free energy due to protein-ligand interactions, internal rotations, association energy of ligand and receptor to form a single complex and free energy due to changes in vibrational modes [17].
Molecular docking analysis was performed by using the commercial Schrödinger software [18]. The best conformation was chosen based on the docking score and glide energy. The sum of energy such as lipophilic, hydrogen bonding, metal interaction, rotatable bond counts and salvation contribute to the docking score. The glide energy is binding free energy calculated based on the OPLS-AA force field. The best compound can be selected based on the least glide energy/docking score/both.
Target preparation
The crystal structures of human PLA2 at the resolution of 2.8Å (1DB5) [19] and Daboia russelii viper PLA2 at the resolution of 2.7Å (2B17) [20] proteins were downloaded from Protein Data Bank (PDB). As explained in the introduction, the inhibitors of human PLA2 make calcium coordination whereas with viper PLA2 they do not. The proteins were prepared by removing water molecules, stabilizing the charges, fixing the missing residues and side chains by the prime module. The force field OPLS 2005 [21] (Optimized Potentials for Liquid Simulations) was used for minimizing the energy of these proteins.
Ligand Preparation:
The compounds that are identified by GC-MS analysis were retrieved from Pubchem, NCBI Database [22]. These are reported as anti-inflammatory agents. The structures of the compounds were minimized after adding hydrogens, and correcting the bond orders by using steepest descent method with 1000 cycles and conjugate gradient method with 5000 cycles during energy minimization.
Molecular Dynamics Simulation
Molecular Dynamics simulation was performed using AMBER [23] to determine the conformational changes and binding free energy. Crystal structure of human PLA2 and venom PLA2 were systematically prepared by using tleap module of Amber 12 suit. Molecular mechanics force field ff99sb amber was used to parameterize amino acids of protein, antechamber module was used to obtain the charges of ligand and parameterized by using GAF force field for system preparation and simulation [24,25] The protein was solvated in a cubic TIP3P box of three –point charged water molecule at the 10Å marginal radius. The system was neutralized with adding adequate number of Na+ and Cl+ ions appropriately. Initially, the solvent molecules were relaxed while all the solute atoms and calcium ion were harmonically restrained to their original position with a force constant of 100kcal/mol.Å2. The water molecules were relaxed by 5000 steps of steepest descent algorithm and 2000 cycles of conjugate gradient algorithm. Finally, the whole system was subjected to energy minimization for 2500 iterations by conjugate gradient without restraints.
Before the simulation, the system was equilibrated in three phases with 2fs time integration step. Berendsen temperature coupling method [26] was used to regulate the temperature of 300K inside the box with time constant 2ps. Electrostatic interactions were computed using the Particle Mesh Ewald method [27]. In the second phase, by using isotropic position scaling, the constant pressure was given to the system. In these two stages, all non-solvent atoms were restrained. Finally, equilibration was extended at constant temperature and pressure without restraints. Consequently, simulations were performed in explicit solvent environment using NPT ensemble with 1 fs integration time step. SHAKE algorithm [29] was used to constrain the bonds involving hydrogen atoms. The initial velocities were assigned from a Maxwell distribution at a given temperature. Finally, the system was computed to MD simulation for 50ns each on an 8 NVIDIA GPU build cluster. Potential energy of each system was validated by equilibration and simulation processes. Trajectories were used for the analysis of RMSD, RMSF, Rg and MMGBSA calculations.
GC-MS Analysis
The peaks of the compounds with retention time in mins identified by GC-MS analysis of methanolic extracts of four plants respectively (Figure.1-4). The name of the compound, retention time and the percentage of their presence indicated as peak area are listed in (Tables 1-4), respectively, for the four plants extracts. GC-MS analysis of the samples confirm the presence 14 compounds namely, Amyrin, Lupeol, α – Sitosterol/Campesterol/stigmasterol, Octadecanoic acid, n-Hexadecanoic acid, 9-Octadecenoic Acid, 9,12-Octadecadienoic acid, 9,12,15-Octadecatrienoic acid, 2-methyl-3-phenyl-1H-indole, Vitamin E, isophytol, 9- Nanodecene, Bicyclo Heptane and 22,23-Dihydrospinaterone from these four extracts and , the rest of the compounds are present comparatively in lesser proportions (not more than 3% only). Induced fit Docking module was used to predict the binding recognition of all 14 compounds at the active site of PLA2 to prove their venom neutralization ability.
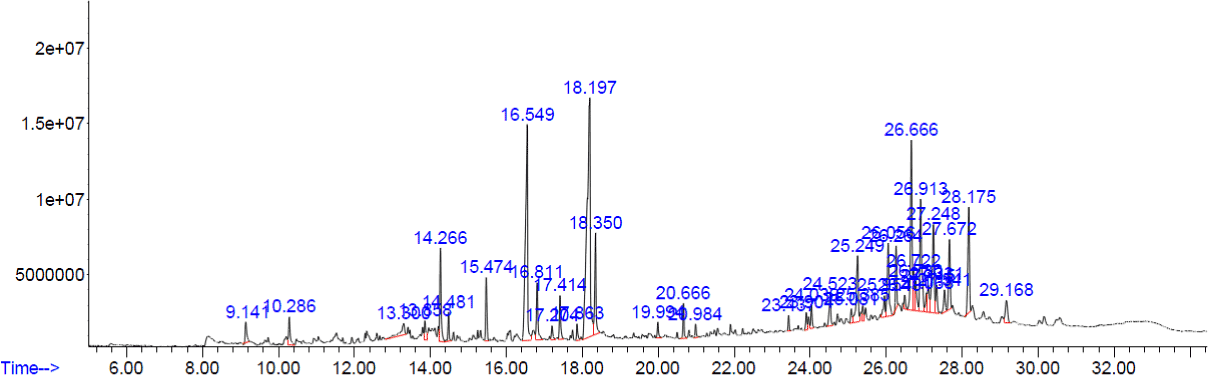
Figure 1. GC-MS chromatogram of methanolic extract of Tinospora cordifolia.
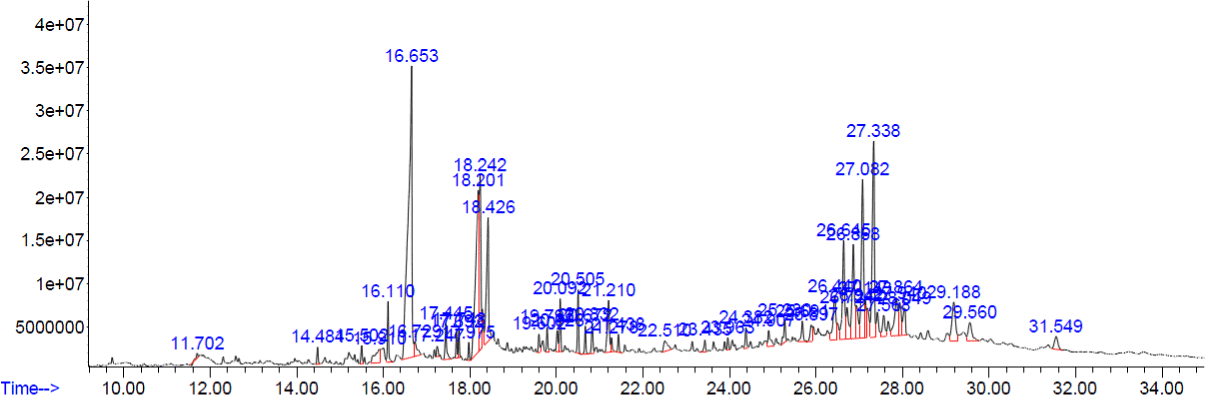
Figure 2. GC-MS chromatogram of methanolic extract of Corollacarpus epigaeuss
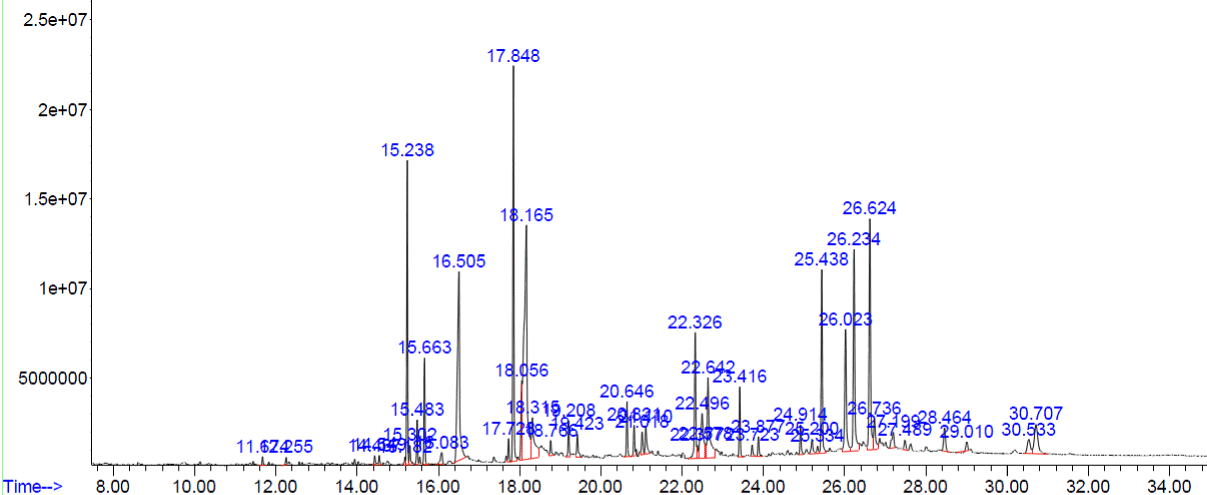
Figure 3. GC-MS chromatogram of methanolic extract of Acalypha indica
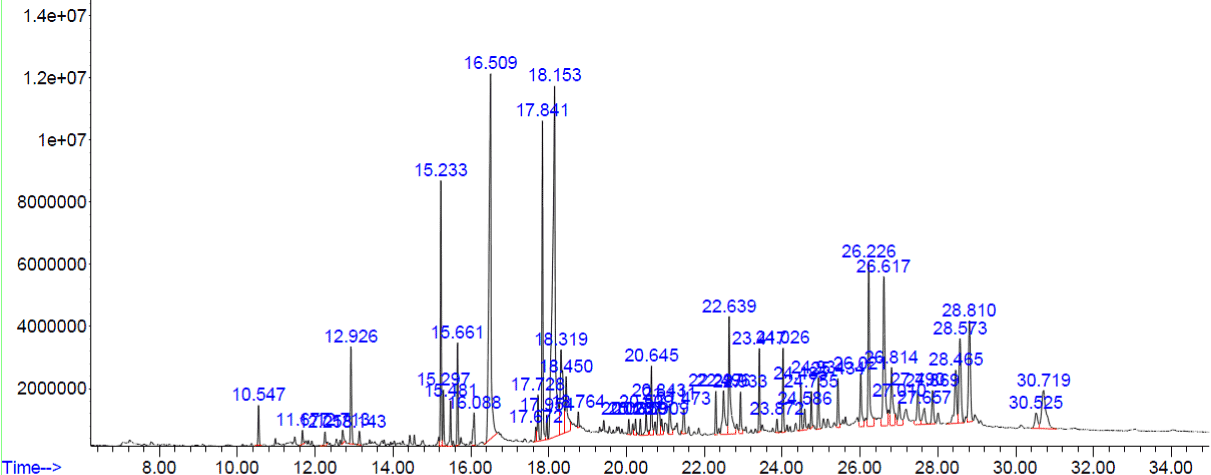
Figure 4. GC-MS chromatogram of methanolic extract of Lucas Aspera
The compounds which are covering more than 3% of peak areas are tabulated in (Table 1). Rest of the compounds are not shown in the (Table 1). Amyrin and lupeol had the same molecular formula and they are known to be similar compounds.
Table 1. Photoconstituents identified from the methanol extract of Tinospora cordifolia
|
No
|
RT (mins)
|
Peak area
|
Compound name
|
Molecular formula
|
-
|
16.552
|
11.99
|
n-Hexadecanoic acid
|
C16H32O2
|
-
|
18.194
|
20.17
|
9-Octadecenoic acid
|
C18H34O2
|
-
|
26.053
|
3.44
|
Campesterol
|
C28H48O2
|
-
|
18.350
|
3.51
|
Octadecanoic acid
|
C18H36O2
|
-
|
26.722
|
6.82
|
Beta-sitosterol
|
C29H50O
|
-
|
26.915
|
5.46
|
Alpha-amyrin
|
C30H50O
|
-
|
27.249
|
4.82
|
Lupeol
|
C30H50O
|
The compounds which are covering more than 3% of peak areas are tabulated in (Table 2). Rest of the compounds are not shown in the (Table 2). Stigmasterol and 22, 23-Dihydrospinasterone had the same molecular formula and they are known to be similar compounds.
Table 2. Phyto constituents identified from the methanol extract of Corollacarpus epigaeuss.
|
No
|
RT (mins)
|
Peak area
|
Compound name
|
Molecular formula
|
-
|
16.656
|
19.65
|
n-Hexadecanoic acid
|
C16H32O2
|
-
|
18.201
|
10.11
|
9,12-Octadecadienoic acid
|
C18H32O2
|
-
|
27.086
|
6.66
|
Stigmasterol
|
C29H48O
|
-
|
27.339
|
7.79
|
22, 23-Dihydrospinasterone
|
C29H48O
|
The compounds which are covering more than 3% of peak areas are tabulated in (Table 3). Rest of the compounds are not shown in the (Table 3).
Table 3. Phyto constituents identified from the methanol extract of Acalypha indica
|
No
|
RT (mins)
|
Peak area
|
Compound name
|
Molecular formula
|
-
|
15.237
|
6.10
|
Bicyclo (3.1.1) heptane
|
C7H12
|
-
|
16.508
|
9.03
|
n-Hexadecanoic acid
|
C16H32O2
|
-
|
17.845
|
8.92
|
Isophytol
|
C20H40O
|
-
|
18.164
|
15.08
|
9,12,15-Octadecatrienoic acid
|
C18H30O2
|
-
|
21.440
|
11.15
|
2-methyl-3-phenyl-1H-Indole
|
C15H13N
|
-
|
22.324
|
3.40
|
9-Nanodecene
|
C19H38
|
-
|
25.438
|
4.72
|
Vitamin E
|
C29H50O2
|
-
|
26.024
|
4.46
|
Campesterol
|
C28H48O
|
-
|
26.232
|
6.53
|
Stigmasterol
|
C29H48O
|
-
|
26.625
|
7.48
|
Beta-sitosterol
|
C29H50O
|
The compounds which are covering more than 3% of peak areas are tabulated in (Table 4). Rest of the compounds are not shown in the (Table 4).
Table 4. Phyto constituents identified from the methanol extract of Lucas Aspera
|
No
|
RT (mins)
|
Peak area
|
Compound name
|
Molecular formula
|
-
|
15.230
|
4.01
|
Bicyclo (3.1.1) heptane
|
C7H12
|
-
|
16.508
|
12.35
|
n-Hexadecanoic acid
|
C16H32O2
|
-
|
22.636
|
3.48
|
Octadecanoic acid
|
C18H36O2
|
-
|
26.224
|
4.12
|
Stigmasterol
|
C29H48O
|
-
|
26.881
|
1.97
|
Beta-sitosterol
|
C29H50O
|
Molecular docking
Docking was performed for all the 14 compounds identified from (Tables 1-4), to confirm the binding of these ligands at the active site of human and Venom PLA2. These compounds are listed below in (Table 5). The available Human PLA2 structure is the PLA2 complex with Indole-6 (PDB: 1DB5). This has interactions with His47, Asp48, Gly31, and Gly29 and also with calcium ion. In case of venom PLA2 (PDB: 2B17), the structure is complex with diclofenac which interacts with His48 and Asp49.
Note: Plant serials: 1- Tinospora cordifolia (commercial powder); 2- Tinospora cordifolia salt; 3- Acalypha indica (commercial powder); 4- Acalypha indica leaves; 5- Corallocarpus epigaeus (commercial powder); 6- Leucas aspera. PDB IDs, 2B17-Daboia russelii venom PLA2; 1DB5-Human. PLA2.
From the docking studies with venom and human PLA2, most of the compounds were found to show favorable docking score and glide energy (Table 5). Out of 14 compounds, Amyrin, sitosterol, 9,12,15-Octadecatrienoic acid, Octadecanoic acid, 9,12-Octadecadecenoic acid, n-Hexadecanoic acid, 9-Octadecenoic acid, 9-Octadecenoic acid and 2-methyl-3-phenyl-1H-indole have good binding affinity with the active site residues in both human and venom PLA2 targets. Pymol and ligplot picture for the vitaminE, amyrin and octadecanoic acid with venom and human PLA2 are shown in (Figures 5-10), respectively. But 22, 23-Dihydrospinaterone did not show any hydrogen bond interactions with the active site of human PLA2. 9- Nanodecene and Bicyclo (3.1.1) Heptane compounds did not have hydrogen bond interactions with both the PLA2 targets. However, these three compounds have many hydrophobic interactions with the active site of venom and human PLA2. Ligplots (Figures 11-13) are shown for 22, 23-Dihydrospinaterone, Nanodecene and Bicyclo (3.1.1) Heptane.
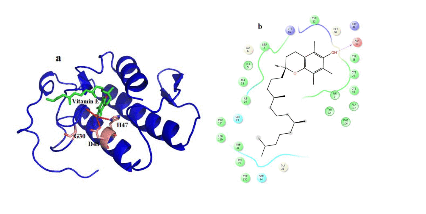
Figure 5. Hydrogen bond and hydrophobic interactions of the vitamin E at the active of venom PLA2.
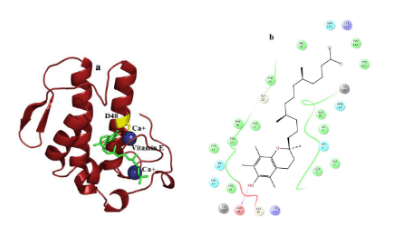
Figure 6. Hydrogen bond and hydrophobic interactions of the vitamin E at the active of human PLA2.
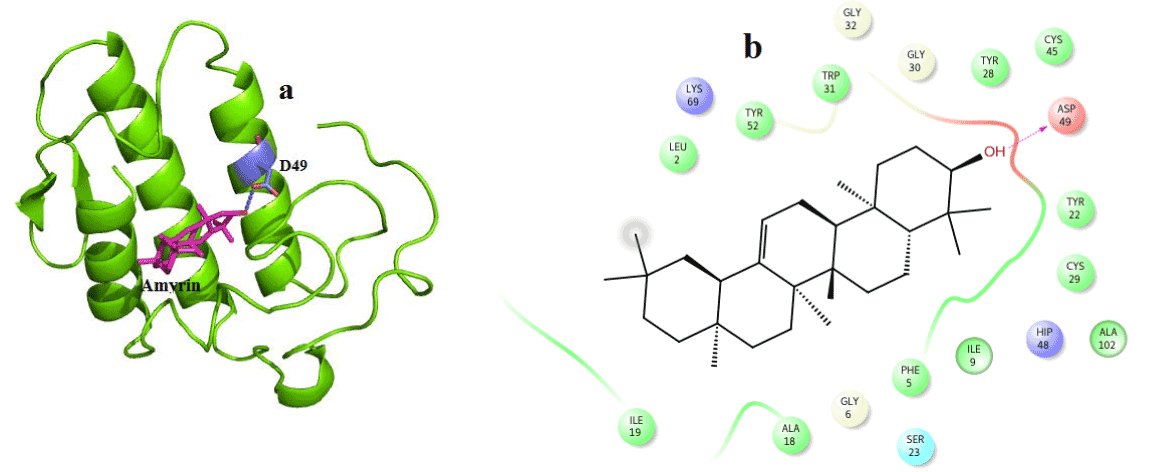
Figure 7. Hydrogen bond and hydrophobic interactions of the Amyrin at the active of venom PLA2.
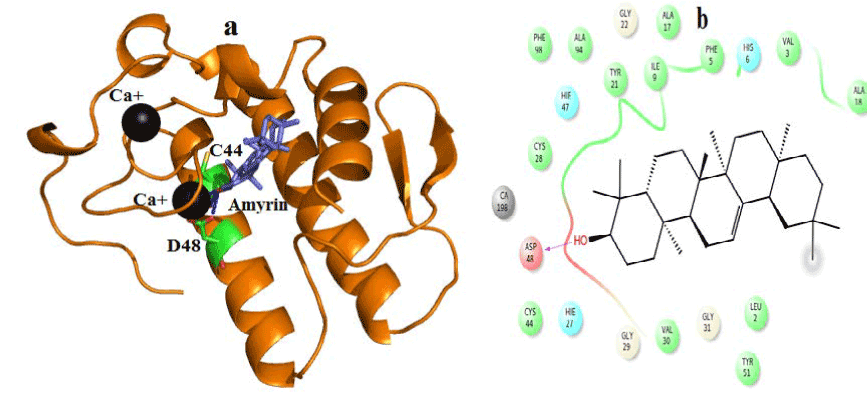
Figure 8. Hydrogen bond and hydrophobic interactions of the amyrin at the active of human PLA2.
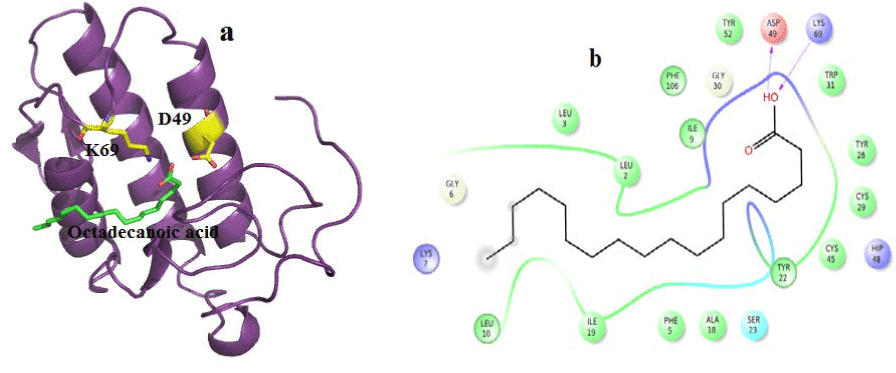
Figure 9. Hydrogen bond and hydrophobic interactions of the Octadecanoic acid at the active of venom PLA2
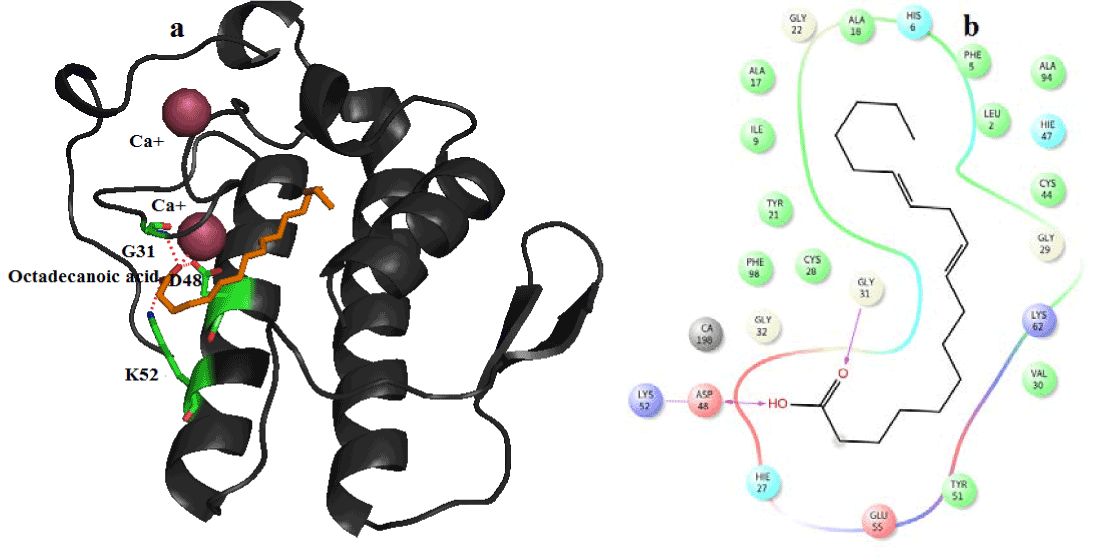
Figure 10. Hydrogen bond and hydrophobic interactions of the Octadecanoic acid at the active of human PLA2.
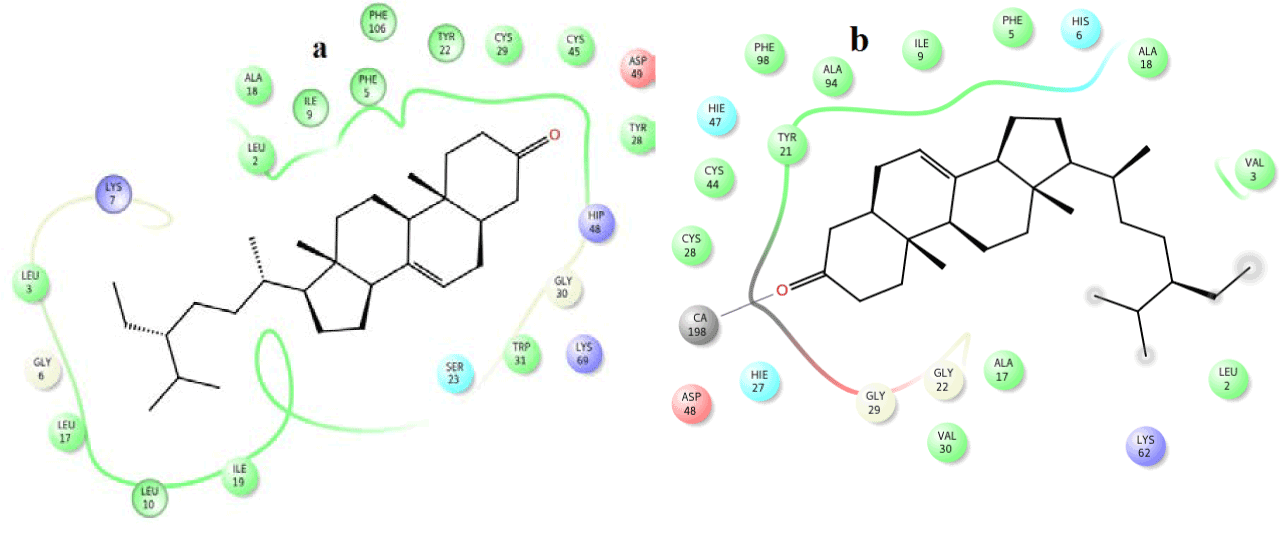
Figure 11. Hydrophobic interactions of the 22,23-dihydrospinasterone/stigmaterol at the active of venom and human PLA2.
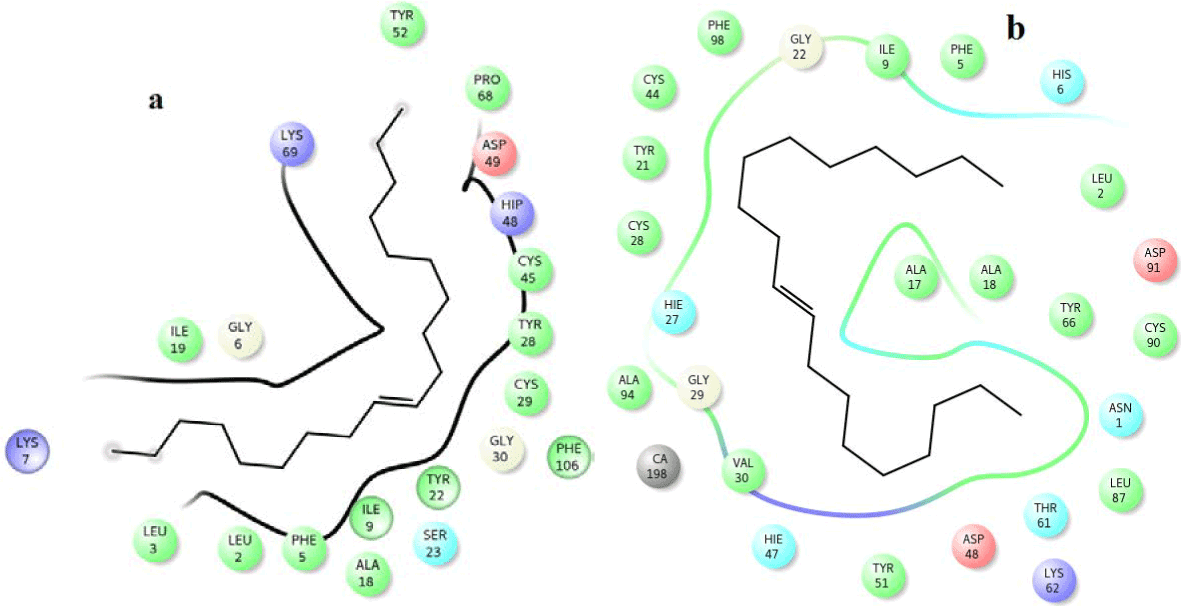
Figure 12. Hydrophobic interactions of the 9-nanodecene at the active of human PLA2.
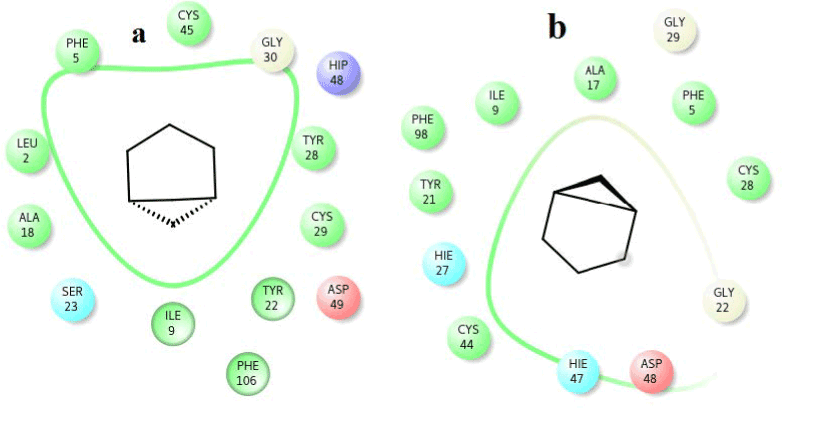
Figure 13. Hydrophobic interactions of the Bicyclo (3.1.1) heptane at the active of human PLA2.
In case of venom PLA2, vitamin E interacts with His 47, Asp 48 and Gly30 mediated by hydrogen bond interactions at a distance of 3.3 Ǻ, 2.7 Ǻ and 3.2Ǻ, respectively (Figure 5a) and other residues Tyr 22, Trp31, Cys 45, Tyr52 and Lys69 interact by hydrophobic interactions (Figure 5b). But in human PLA2, Vitamin E maintains only one interaction with Asp48 and it coordinates with calcium ion at a distance of 2.7 Ǻ, 2.8 Ǻ respectively (Figure 6a). Hydrophobic interactions of vitaminE with His47, Gly29, Cys44 and Tyr21 are maintained (Figure 6b).
In case of amyrin with venom PLA2, it maintains hydrogen interaction with Asp 49 at a distance of 3.0 Ǻ (Figure 7a) and hydrophobic interactions with His48, Gly30, Tyr 22, Trp31, Cys45, Tyr52 and Lys69 are shown in (Figure 7b).
In human PLA2, amyrin interacts with Asp48, Cys44 and it coordinates with calcium ion at a distance of 2.8 Ǻ, 3.2 Ǻ and 3.1 Ǻ respectively (Figure 8a). Hydrophobic interactions of amyrin with His47, Gly29, Gly31, Cys44 and Tyr 21are maintained (Figure 8b).Octadecanoic acid has hydrogen bond interactions with Asp 49, Lys69 at a distance of 2.6Ǻ, 2.8Ǻ respectively, in case of venom PLA2 (Figure 9a), and hydrophobic interactions with His48, Gly30, Tyr 22, Trp31, Tyr52, Cys 45 and Lys69 are shown in (Figure 9b). In human PLA2, Octadecanoic acid interacts with Asp48, Gly31, Lys 52 and it coordinates with calcium ion at a distance of 3.0 Ǻ, .3.1 Ǻ, 2.9Ǻ and 3.2 Ǻ, respectively (Figure 10a). Hydrophobic interactions of Octadecanoic acid with His47, Tyr21, Gly29, Cys44, Tyr 51 and Lys62 are maintained (Figure 10b).
MD Simulation:
Based on the docking studies, amyrin and octadecanoic acid bound complexes were chosen for MD study since the phytoconstituents amyrin and octadecanic acid are from the three plants, namely, Corollacarpus epigaeuss, Leucas aspera Spreng and Tinospora cordifolia. They showed minimum glide energy and have better binding affinity in terms of hydrogen bond and hydrophobic interactions with both venom and human PLA2 (Table 5). MD Simulation was performed to observe the molecular perturbation associated with the stability loss of the venom, human PLA2 complexes and also the co-crystal complex.
Table 5. Binding analysis of various antidote compounds with venom and human PLA2 from plant sources.
|
S.No
|
Compounds
|
PLA2
|
Docking score
|
Glide energy
|
D---H…A interactions
|
Distance (Ӑ)
|
|
kcal/mol
|
|
1.
|
Vitamin E (4)
|
2B17
|
-8.12
|
-50.05
|
H48 (NH…O)
|
3.3
|
|
(OH…O) D49
|
2.71
|
|
G30 (NH…O)
|
3.2
|
|
1DB5
|
-4.45
|
-48.248
|
(OH…O) D48
|
2.7
|
|
OH… Ca+
|
2.8
|
|
2.
|
Octadecanoic acid
|
2B17
|
-6.36
|
-50.38
|
(OH…O) D49
|
2.6
|
|
(1,5,6)
|
Y69 (NH…O)
|
2.8
|
|
|
1DB5
|
-4.756
|
-41.26
|
(OH…N) D48
|
3
|
|
G32 (NH…O)
|
3.1
|
|
K52 (NH…O)
|
2.9
|
|
3.
|
9-Octadecenoic Acid
|
2B17
|
-6.36
|
-50.38
|
(OH…O) D49
|
2.5
|
|
(1,6)
|
K69 (NH…O)
|
2.8
|
|
|
1DB5
|
-4.657
|
-40.321
|
K62 (NH…O)
|
2.9
|
|
(OH…O) D48
|
2.9
|
|
G31 (NH…O)
|
3.2
|
|
4.
|
Amyrin/Lupeol (1)
|
2B17
|
-7.02
|
-47.62
|
(OH…O) D49
|
3
|
|
1DB5
|
-6.56
|
-48.922
|
(OH…O) D48
|
2.8
|
|
OH… Ca+
|
3.2
|
|
(OH…O) C44
|
3.1
|
|
5.
|
9,12,15-Octadecatrienoic acid
|
2B17
|
-7.25
|
-47.15
|
H48 (NH…O)
|
3.2
|
|
(3,4)
|
(OH…O) D49
|
2.5
|
|
G30 (NH…O)
|
3.06
|
|
1DB5
|
-4.28
|
-39.883
|
(OH…O) D48
|
3
|
|
(OH…O) G29
|
2.8
|
|
6.
|
n-Hexadecanoic acid
|
2B17
|
-3.41
|
-45.95
|
H48 (NH…O)
|
3
|
|
(1,2,3,4,5,6)
|
(OH…O) D49
|
2.5
|
|
G30 (NH…O)
|
2.8
|
|
|
1DB5
|
-4.37
|
-38.78
|
K52 (NH…O)
|
3.2
|
|
(OH…O) E55
|
2.8
|
|
K62 (NH…O)
|
2.9
|
|
7.
|
Campesterol (1,4,6)
|
|
|
|
|
|
|
2B17
|
-9.09
|
-47.632
|
(OH…O) D49
|
2.8
|
|
1DB5
|
-6.064
|
40.247
|
(OH…O) D49
|
2.7
|
|
8.
|
9,12-Octadecadecenoic acid
|
2B17
|
-6.46
|
-43.58
|
G30 (NH…O)
|
3.1
|
|
(2,6)
|
(OH…O) D49
|
2.7
|
|
|
1DB5
|
-4.19
|
-40.621
|
K52 (NH…O)
|
3.3
|
|
(OH…O) D48
|
2.9
|
|
G31 (NH…O)
|
2.7
|
|
OH… Ca+
|
3
|
|
9.
|
22,23-Dihydrospinaterone/Stigmasterol (1,4,5,6)
|
2B17
|
-7.4
|
-40.77
|
H48 (NH…O)
|
3.2
|
|
1DB5
|
-5.998
|
-41.14
|
Ca+…OH
|
2.5
|
|
10.
|
α – Sitosterol
|
2B17
|
-8.06
|
-39.92
|
G30 (NH…O)
|
3.3
|
|
(1,4,6)
|
1DB5
|
-6.6
|
-40.159
|
G31 (NH…O)
|
2.9
|
|
OH….Ca+
|
2.7
|
|
11.
|
Isophytol (4)
|
2B17
|
-4.2
|
-43.78
|
G30 (NH…O)
|
3.2
|
|
1DB5
|
-4.61
|
-41.05
|
(NH…O) D48
|
2.7
|
|
OH… Ca
|
3
|
|
12.
|
2-methyl-3-phenyl-1H-indole (3)
|
2B17
|
-7.33
|
-37.39
|
(NH…O) D48
|
2.6
|
|
1DB5
|
-4.93
|
-36.619
|
(NH…O) D48
|
2.7
|
|
13.
|
9- Nanodecene (4)
|
2B17
|
-0.43
|
-34.65
|
---No----
|
---
|
|
1DB5
|
-4.89
|
-35
|
---No----
|
---
|
|
14.
|
Bicyclo (3.1.1) Heptane (4,6)
|
2B17
|
-5.43
|
-18.42
|
---No----
|
---
|
|
1DB5
|
-4.1
|
-18.056
|
---No------
|
---
|
The dynamic behavior of both complexes were calculated using RMSD, RMSF and Rg. RMSD for all the Cα atoms were calculated from the initial structure to study the convergence of the protein system (Figure 14a). In a case of Venom PLA2, cocrystal complex and amyrin bound complex showed similar trend of deviation till the end of simulation. At 15ns, the cocrystal complex remains much deviated than amyrin bound complex, resulting in final backbone RMSD of 2.0 to 2.3Ǻ during the simulation. Amyrin bound complex retained less deviation till the end of simulation. Octadecanoic acid bound complex exhibited higher fluctuation from 20ns to the end of simulation resulting in a backbone RMSD of 2.5 to 2.9 Ǻ. RMSD of human PLA2 is shown in (Figure 14b). Cocrystal complex and octadecanoic acid bound complex deviate much at 42ns and 35ns, respectively, resulting in backbone RMSD of 2.2Ǻ. Amyrin bound complex retained less deviation till the end of simulation and it maintains the stability.
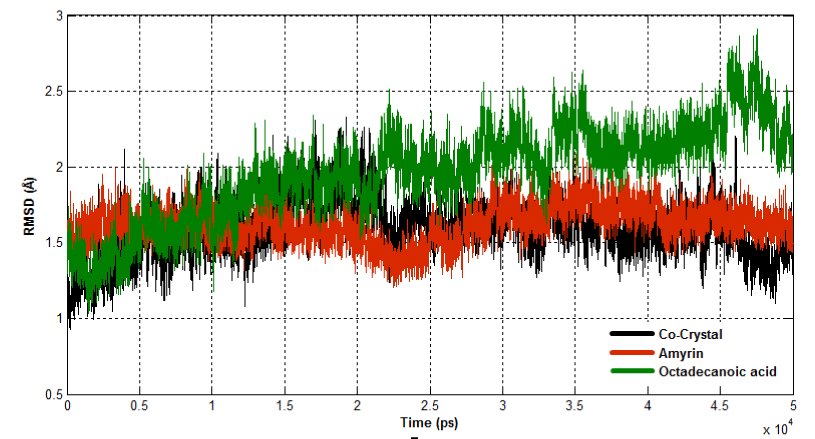
Figure 14a. Root Mean Square Deviation of backbone atoms of Venom PLA2 complexes.
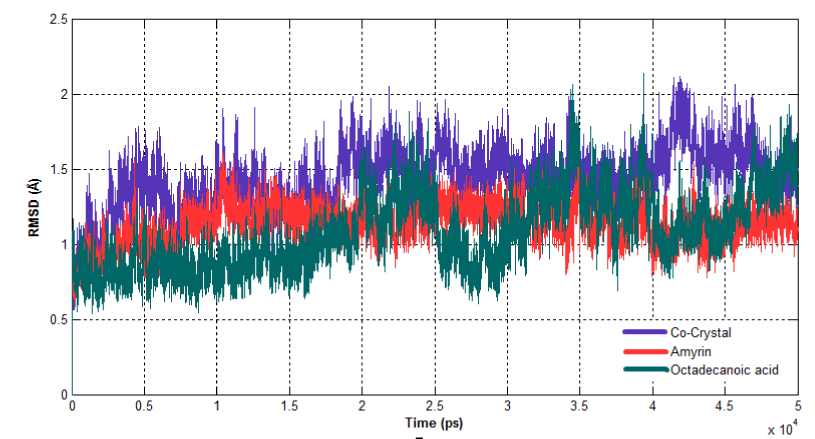
Figure 14b. Root Mean Square Deviation of backbone atoms of Human PLA2 complexes.
To observe the dynamic behavior of residues of different complexes of PLA2, atomic positional fluctuations of backbone residues of each PLA2 were computed. In venom PLA2, the fluctuation score exposed the occurrence of higher degree of flexibility in backbone residues present in the octadecanoic acid bound complex. Residues in amyrin bound complex depicted more fluctuations in the loop region (residues 35-40), (65-70), otherwise it maintains less fluctuations. Amino acid residues in cocrystal maintain less fluctuation compared with amyrin and octadecanoic acid bound complex residues and it maintains the stability (Figure 15a). Fluctuation score of amino acid residues in amyrin bound complex showed less degree of flexibility proved by more conformational restrictions in human PLA2. In the co-crystal complex, residues deviate more than the residues in the amyrin and octadecanoic acid bound complex (Figure 15b). Active site residues of Cys45, His48 and Asp49 fluctuate very less for all complexes proving that this region is very stable in both venom and human PLA2.
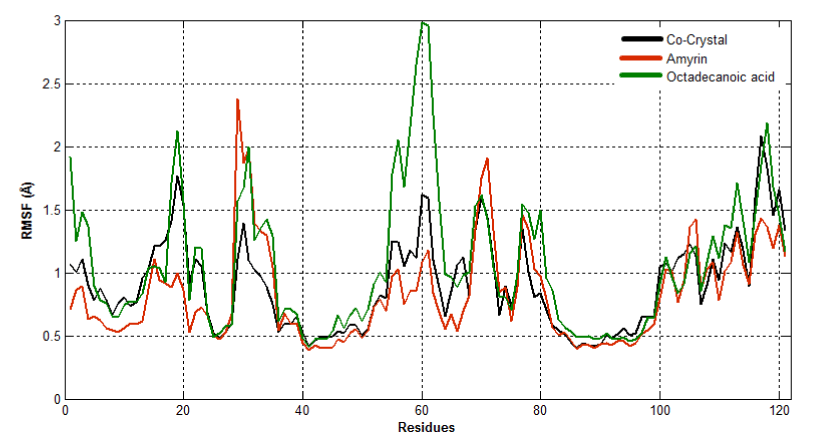
Figure 15a. Atomic positional fluctuations of Venom PLA2 complexes.
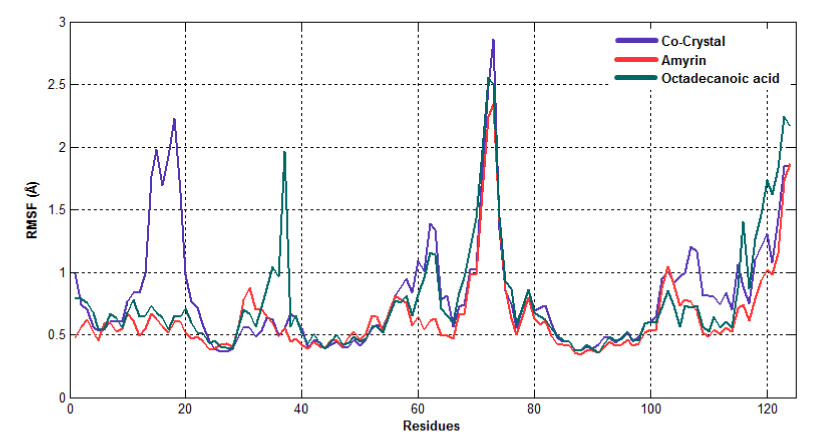
Figure 15b. Atomic positional fluctuations of human PLA2 complexes.
The radius of gyration (Rg) is the mass-weighted root mean square distance of group of atoms from their common centre of mass. Hence it provides an observation into global dimension of protein. In case of venom PLA2, major fluctuations are observed in co crystal complex and octadecanoic acid bound complex and it becomes less stable (Figure 16a). In human PLA2, all the three complexes maintain the similar way of fluctuations till the end of simulation (Figure 16b).
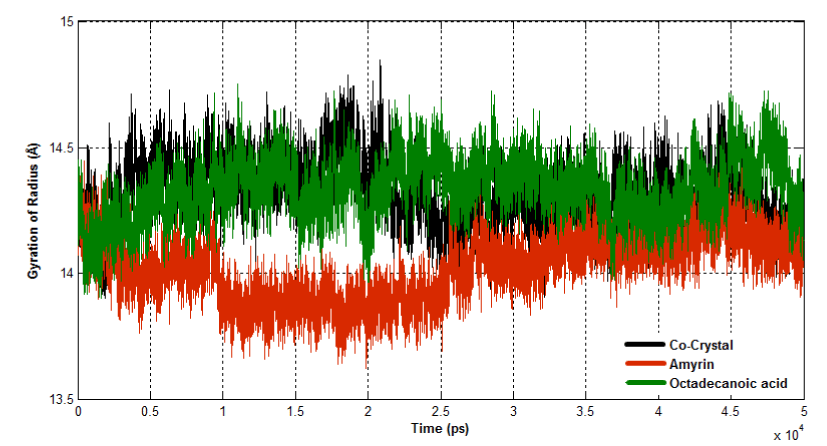
Figure 16a. Radius of Gyration for venom PLA2 complexes.
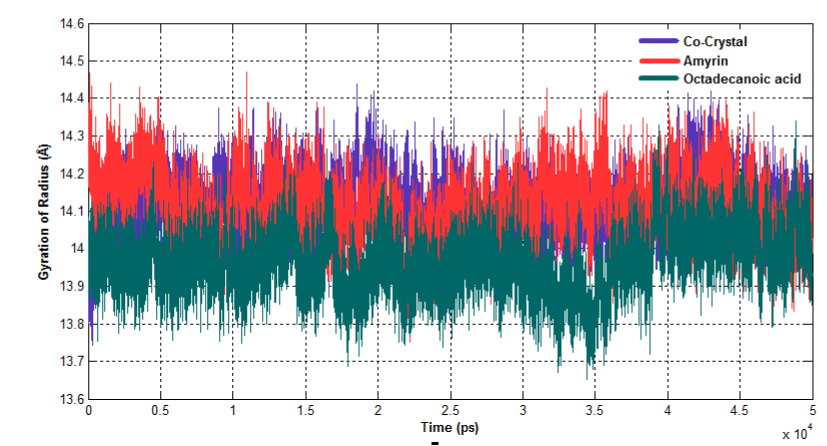
Figure 16b. Radius of Gyration for human PLA2 complexes.
The residue wise decomposition energy was calculated using the residues involved in hydrogen bond and hydrophobic interactions that can contribute to the delta free energy. In venom PLA2 complex, Leu2, Cys29, Cys45 and His48 residues contribute the minimum range of delta free energy (Figure 17a). The major contribution of free energy comes from Leu2, Phe5, Ala18, Tyr21, and Gly22 for all human PLA2 complexes shown in (Figure 17b). In cocrystal complex, Asp48 showed maximum energy of about 13 kcal/mol which is not favorable. In amyrin and octadecanoic acid bound complex, Cys44 and His47 maintain the least energy than the cocrystal complex.
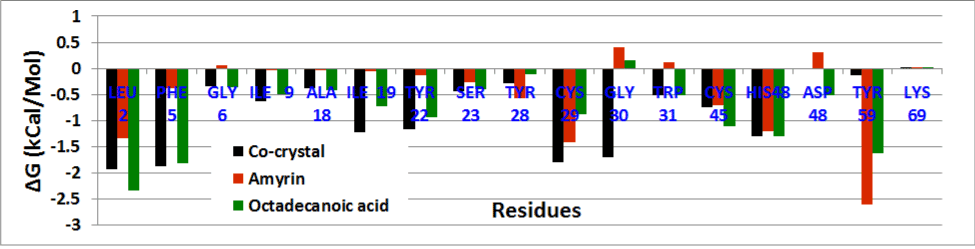
Figure 17a. Residue wise binding free energy decomposition venom PLA2 complexes.
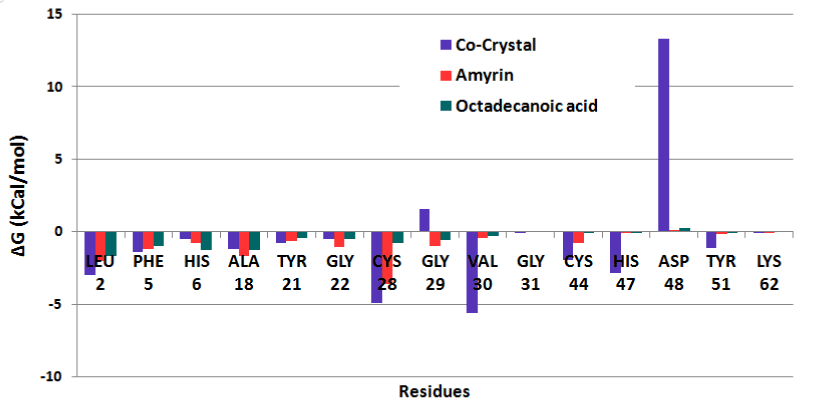
Figure 17b. Residue wise binding free energy decomposition human PLA2 complexes.
The binding free energy is the sum of bonded and non-bonded interactions in the molecule. Here the binding energy is calculated for all venom and human PLA2 complexes (Tables 6 & 7). In venom PLA2 complex, octadecanoic acid contributes the least energy of -48.53 kcal/mol, amyrin complex maintains least energy of -39.26kcal/mol in human PLA2.
Table 6. Binding Energy calculations for venom PLA2 Complexes
|
S.No
|
Energy Component
|
Average (Std.Dev)
|
|
Co-Crystal
|
Amyrin
|
Octadecanoic acid
|
|
|
VDWAALS
|
-31.53(±3)
|
-36.06(±2)
|
-47.74(±3)
|
|
|
EEL
|
-11.88(±9)
|
-2.23(±3)
|
-43.69(±6)
|
|
|
EGB
|
20.05(±7)
|
11.94(±2)
|
49.45(±4)
|
|
|
ESURF
|
-4.22
|
-4.86
|
-6.55
|
|
|
DELTA G gas
|
-43.42(±9)
|
-38.30(±3)
|
-91.44(±6)
|
|
|
DELTA G solv
|
15.83(±8)
|
7.07(±2)
|
42.90(±4)
|
|
|
DELTA TOTAL
|
-27.58(±4)
|
-31.22(±2)
|
-48.53(±3)
|
Table 7. Binding Energy calculations for human PLA2 Complexes
|
S.No
|
Energy Component
|
Average (Std.Dev)
|
|
Co-Crystal
|
Amyrin
|
Octadecanoic acid
|
|
|
VDWAALS
|
-47.47(±3)
|
-37.16(±3)
|
-26.48(±3)
|
|
|
EEL
|
-159.19(±14)
|
-2.00(±2)
|
7.06(±4)
|
|
|
EGB
|
211.60(±14)
|
4.11(±2)
|
3.16(±4)
|
|
|
ESURF
|
-5.64
|
-4.19
|
-3.93
|
|
|
DELTA G gas
|
-206.67(±14)
|
-39.17(±3)
|
-19.41(±5)
|
|
|
DELTA G solv
|
205.95(±14)
|
-0.08(±2)
|
-0.76(±4)
|
|
|
DELTA TOTAL
|
-0.71(±5)
|
-39.26(±3)
|
-20.18(±3)
|
2021 Copyright OAT. All rights reserv
From the Insilco analysis, it is proved that the best compounds amyrin and octadecanoic acid from the herbal plants behave like a cocrystal ligand at the active site of venom and human PLA2 structures.
Medicinal plants are used for screening and discovering the phytoconstituents which are helpful for finding novel medicine and clues for modern medicine. In reviewing the above study, it can be concluded that the venom neutralization is possible with the phytoconstituents that are present in herbal plants or they can act as anti-inflammatory agents/antidotes for snake bites. Computational studies also clearly prove that the compounds have great medicinal and pharmacological action towards curing inflammation. Further experimental studies are needed to confirm the above findings.
- Wadood A, Ghufran M, Jamal SB, Naeem M, Khan A, et al. (2013) Phytochemical analysis of medicinal plants occurring in local area of mardan. J.Biochem and Anal Biochem 2(4); 1000144.
- Ganesan S, Suresh N, Kesavan L (2004) Ethnomedicinal survey of lower Palani Hills of Tamil Nadu. Indian J Trad Knowledge 3(3); 299-304.
- Revathi P, Parimelazhagan T (2010) Traditional Knowledge on Medicinal plants used by the Irula tribe of Hasanur Hill, Erode district, Tamil Nadu, India. Ethnobotanical Leaflets 2010; 14:136-60.
- Kundal Das (2009) Medicinal plants for snake bite treatment-Future Focus. Ethnobotanical Leaflets 2009; 13:508-21.
- Ganavel R, Franklin (2014) Medicinal plant based antidotes against snake bite by Irula tribes of Tamilnadu, India. World J Pharm Sic 2(9); 1029-1033.
- Burke JE, Dennis EA (2009) Phospholipase A2 structure/function, mechanism, and signaling. J Lipid Res 50 Suppl: S237-242. [Crossref]
- Smith WL (1992) Prostanoid biosynthesis and mechanisms of action. Am J Physiol 263: F181-191. [Crossref]
- Yuan W, Quinn DM, Sigler PB, Gelb MH (1990) Kinetic and inhibition studies of phospholipase A2 with short-chain substrates and inhibitors. Biochemistry 29; 6082-6094. [Crossref]
- Ward RJ, Alves AR, Neto JR, Arni RK, Casari G (1998) A Sequence Space analysis of Lys49 phopholipases A2: clues towards identification of residues involved in a novel mechanism of membrane damage and in myotoxicity. Protein Eng 1998; 11, 285.
- Jeyaseelan K, Armugam A, Donghui M, Tan NH (2000) Structure and phylogeny of the venom group I phospholipase A(2) gene. Mol Biol Evol 17: 1010-1021. [Crossref]
- Fremont DH, Anderson DH, Wilson IA, Dennis EA, Xuong N (1993) Crystal structure of phospholipase A2 from Indian cobra reveals a trimeric association, Proc Natl Acad Sci 90; 342-346.
- Dijkstra BW, Kalk KH, Hol WG, Drenth J (1981) Structure of bovine pancreatic phospholipase A2 at 1.7A resolution. J Mol Biol 147; 97-123. [Crossref]
- Dennis EA (1994) Diversity of group types, regulation, and function of phospholipase A2. J Biol Chem 269; 13057-13060. [Crossref]
- Rajakannan V, Yogavel M, Poi M, Arockia JA, Jeyakanthan J, et al. (2002) Observation of additional calcium ion in the crystal structure of the triple mutant K56, 120, 121M of bovine pancreatic phospholipase A2. J Mol Biol 2002; 324, 755.
- Chandra V, Jasti J, Kaur P, Betzel C, Srinivasan, et al. (2002) First structural evidence of a specific inhibition of phospholipase A2 by alpha-tocopherol (vitamin E) and its implications in inflammation: crystal structure of the complex formed between phospholipase A2 and alpha-tocopherol at 1.8A resolution. J Mol Bio 2002; 320, 215.
- Chandra VS, Jasti J, Kaur P, Dey S, Srinivasan A, et al. (2002) Design of specific peptide inhibitors of phospholipase A2: structure of a complex formed between Russell's viper phospholipase A2 and a designed peptide Leu-Ala-Ile-Tyr-Ser (LAIYS). Acta Crystallogr Sect D 2002; 58; 1813-19.
- Ajay, Murcko MA (1995) Computational methods to predict binding free energy in ligand-receptor complexes. J Med Chem 38; 4953-4967. [Crossref]
- Schrodinger Small molecule Drug-Discovery Suite 2014-3; Scrodinger Suite 2014-3 Protein preparation wizard; Epik version 2.9: Schrodinger Suite 2014-3 Induce Fit Docking protocol Schrodinger, LLC, New York, NY, 2014.
- Schevitz RW, Bach NJ, Carlson DG, Chirgadze NY, Clawson DK, et al. (1995) Structure-based design of the first potent and selective inhibitors of human non-pancreatic secretory phospholipase A2. J Nat Struct Biol 2(6); 458-65. [Crossref]
- Singh N, Jabeen T, Sharma S, Somvanshi RK, Dey S, et al. (2006) Specific binding of non-steroidal anti-inflammatory drugs (NSAIDs) to phospholipase A2: structure of the complex formed between phospholipase A2 and diclofenac at 2.7A resolution. Acta Cryst D Biol Cryst 62 (4); 410-416.
- Jorgensen WL, Chandrasekhar J, Madura JD, Impey RW, Klein ML (1983) Comparison of simple potential functions for simulating liquid water. J Chem Phys 1983; 79, 926.
- Kim S, Thiessen PA, Bolton EE, Chen J, Fu G, et al. (2016) PubChem Substance and Compound databases. Nucleic Acids Res 44; D1202-1213. [Crossref]
- Case DA, Cheatham TE, Darden T, Gohlke H, Luo R, et al. (2005) The Amber biomolecular simulation programs. J Comput Chem 26: 1668-1688. [Crossref]
- Ponder JW, Case DA (2003) Force fields for protein simulations. AdV Protein Chem 2003; 66; 27–85. [Crossref]
- Duan Y, Wu C, Chowdhury S, Lee MC, Xiong G, et al. (2003) A point-charge force field for molecular mechanics simulations of proteins based on condensed-phase quantum mechanical calculations. J Comput Chem 24: 1999-2012. [Crossref]
- Berendsen HJC, Postma JPM, Van Gunsteren WF, Dinola A, Haak JR (1984) Molecular dynamics with coupling to an external bath. J Chem Phys 1984; 81, 3684.
- Cheatham TE, Miller JL, Fox T, Darden TA, Kollman PA (1995) Molecular dynamics simulations on solvated biomolecular systems: the particle mesh Ewald method leads to stable trajectories of DNA, RNA, and proteins. Journal of the American Chemical Society 1995; 117(14); 4193–4194.
- Ryckaert JP, Ciccotti G, Berendsen HJC (1997) SHAKE algorithm. J Comput Phys 1977; 23; 327.