Abstract
A pyrolysis technique of urea and dicyandiamide in an air atmosphere was used to prepare graphitic carbon nitride, and a modified precipitation technique was used to prepare Fe2O3 doped on g-C3N4 nanocomposites. Different techniques, such as UV-Vis, XPS, FT-IR, XRD, PL and BET surface area, were used to characterize the prepared materials. The results reveal that the wt% of Fe2O3 plays an important role in the control band gap of Fe2O3 doped on g-C3N4 nanocomposite. The photocatalytic performance of g-C3N4 and Fe2O3 doped on g-C3N4 nanocomposites was studied by measuring its photocatalytic reduction of Pb ions under visible light. Photocatalytic parameters such as the wt% of Fe2O3, photocatalyst dose and Pb ion concentration were also studied. The photocatalytic activity of doped on g-C3N4 is smaller than that of Fe2O3 doped on g-C3N4 nanocomposites. This can be attributed to the fact that the addition of Fe2O3 to doped on g-C3N4 decreases the electron-hole recombination rate and shifts the absorption of pg-C3N4 to a higher wavelength or alternatively due to the transfer of electrons between doped on g-C3N4 and Fe2O3.
Key words
g-C3N4, Fe2O3, photocatalytic reduction, Pb ion
Introduction
Industrialization technologies lead to many benefits for humans but also cause many environmental problems, such as water pollution. One of the most dangerous problems is pollution by heavy metals, as heavy metals are very difficult to remove from wastewaters. The Agency for Toxic Substances and Disease Registry considers Pb ions to be the second top water hazard that requires critical treatment [1]. Many sources can cause lead contamination of water, including natural or industry sources. The presence of Pb ions causes many problems to human health, such as brain damage from prolong exposure to Pb ions. The maximum safe level of Pb ions in drinking water is 10 and 15 ppb according to the World Health Organization and the Environmental Protection Agency, respectively [2,3]. The treatment of Pb ions in water has been carried out by many methods [4,5], but these methods are not effective due to the presence of harmful by-products [7], high cost [8] and the fact that pretreatment and a long residence time are needed [9,10]. Therefore, the photocatalysis process is a very effective method due to its very easy and effective execution. The most efficient photocatalyst is titanium dioxide due to its high stability and activity. The disadvantage of using titanium dioxide as a photocatalyst is its absorption in the UV region and fast recombination of electron and hole [11-13]. Many methods have been used to solve these two problems. The first method is doping by metal, and the second one is coupling by another semiconductor [14-21]. The third one is the synthesis of a novel photocatalyst working under visible light irradiation such as bismuth vanadate and bismuth oxychloride [22-25]. Currently, researchers prepare polymer-like semiconductor materials that are considered to be an efficient photocatalyst using visible light for environmental purification and hydrogen production [26-30]. Polymer-like semiconductor materials have many properties, such as high stability, low cost and a controllable surface. Therefore, a polymer-like semiconductor material can be considered as a new material for solar energy and environmental applications. There are three drawbacks for using it as a commercial photocatalyst: a small surface area, high recombination rate of electron- hole pairs and a lack of absorption above 460 nm. Researchers have overcome these drawbacks by three methods. One of them is to control the texture of polymer-like semiconductor materials, which increases adsorption ability and photocatalytic activity [31-38]. The second one is to extend the absorption range of polymer-like semiconductor materials by changing their electronic structure via metal and nonmetal doping [39-44]. The third one is to extend the absorption range of polymer-like semiconductor materials by changing their electronic structure by coupling with another semiconductor photocatalyst such as Bi2WO6, TaON, TiO2 [45-47] and so on. In this work, a new Fe2O3 doped on g-C3N4 photocatalyst was synthesized and characterized. The photocatalytic reduction of Pb ions using Fe2O3 doped on a g-C3N4 photocatalyst using visible light was studied.
Experimental
Synthesis of graphitic carbon nitride (g-C3N4)
A pyrolysis technique of urea and dicyandiamide in an air atmosphere was used to prepare graphitic carbon nitride as follows: 6 g of dicyandiamide was added to 10 g of urea and mixed carefully. The resulting mixture was heated for 4 h at 550°C by a Muffle Furnace. The resulting materials were washed several times by deionized water to confirm that there is residue adsorbed on the graphitic carbon nitride surface, which was then dried at 100°C for 12 h.
Preparation of Fe2O3@g-C3N4 nanocomposites
A modified precipitation technique was used to prepare Fe2O3 doped on g-C3N4 nanocomposites as follows: 1 g of g-C3N4 was dispersed by sonication in 60 ml of deionized water. Then, 0.15 g of iron nitrate was added dropwise to the g-C3N4 dispersed solution. Ammonia solution was also added, and the obtained materials were stirred for 3 h at room temperature. The obtained materials were dried and washed several times by ethanol and deionized water and dried at 80°C for 12 h under a vacuum drier. Fe2O3 doped on g-C3N4 nanocomposite was obtained by the calcination of the materials at 550°C for 2 h. The obtained Fe2O3 doped on g-C3N4 nanocomposite was labelled as Fe2O3 doped on g-C3N4- 1 wt%. Fe2O3 doped on g-C3N4- 2 wt%, Fe2O3 doped on g-C3N4- 3 wt% and Fe2O3 doped on g-C3N4- 4 wt% nanocomposites were prepared by the same method for Fe2O3 doped on g-C3N4- 1 wt% by changing only the amount of iron nitrate required.
Characterization of g-C3N4 and Fe2O3 doped on g-C3N4 nanocomposites
Nanostructure morphology and sample dimensions were measured using JEOL-JEM-1230 transmission electron microscopy (TEM). Samples were suspended in ethanol and ultrasonicated for 30 m. A small amount was then dried on a carbon coated copper grid and loaded into the TEM. In addition, N2-adsorption measurements were taken on treated samples (2 h under vacuum at 100°C) with a Nova 2000 series Chromatech apparatus at 77K to calculate surface area. The crystalline phase was determined by powder X-ray diffraction (XRD) using Bruker axis D8 with Cu Kα radiation (λ=1.540 Å) at room temperature. X-ray photoelectron spectroscopy (XPS) measurements were performed on a Thermo Scientific K-ALPHA spectrometer. Band gap performance was determined from an ultra violet-visible diffuse reflectance spectra (UV-Vis-DRS), which was measured using a UV-Vis-NIR spectrophotometer (V-570, Jasco, Japan) in air at room temperature to detect absorption over the range of 200 to 800 nm. Lastly, photoluminescence emission spectra (PL) were obtained with a Shimadzu RF-5301 fluorescence spectrophotometer.
Photocatalytic activity
The photocatalytic performance of g-C3N4 and Fe2O3 doped on g-C3N4 nanocomposites was studied by measuring its photocatalytic reduction of Pb ion under visible light. The experiments were conducted using a horizontal cylinder annular batch reactor. The photocatalyst was irradiated with a blue fluorescent lamp (150 W), and the reactor was doubly covered with a UV cut filter. In a typical experiment, the weight of the catalyst was suspended into a 300-ml, 100 mg/L lead nitrate solution. The reaction was carried out isothermally at 25°C, and samples of the reaction mixture were taken at different intervals for a total reaction time of 1 h. The lead concentration in the samples was estimated by Atomic absorption. The adsorption efficiency of Pb has been measured by applying the following equation:
% adsorption efficiency of Pb = (Co - C)/Co x 100
where Co is the initial concentration of lead in solution and C is the remaining concentration of lead in solution.
Results and discussion
Photocatalyst characterization
XRD examination: The XRD patterns of g-C3N4 and Fe2O3 doped on g-C3N4 nanocomposites are shown in Figure 1. The results demonstrated that g-C3N4 and Fe2O3 doped on g-C3N4 nanocomposites consist from the signal phase of g-C3N4. In addition, we noticed that there is no peak for Fe, Fe2O3 or Fe3O4 due to strong dispersion of Fe2O3 above the g-C3N4 surface or the amount of g-C3N4 is the low detection limit of XRD. Additionally, the characteristic peak of g-C3N4 at 27.4° was broad by the addition of Fe2O3. Broadening was increased by increasing the weight percent of Fe2O3, which means that the crystallite size decreased as the weight percent of Fe2O3 increased.
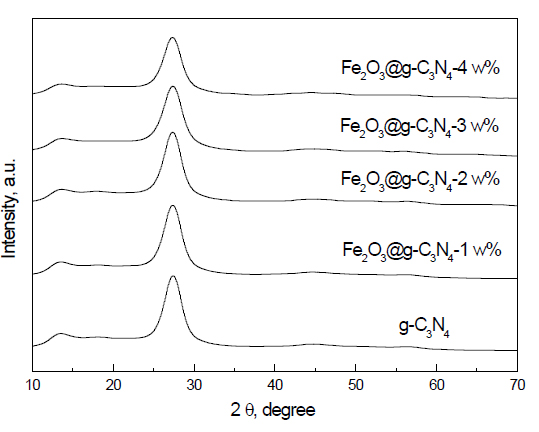
Figure 1. XRD patterns of g-C3N4 and Fe2O3@ g-C3N4 nanocomposites.
XPS examination: The XPS spectra Fe2O3 doped on g-C3N4 -3 wt% sample is shown in Figure 2. The results demonstrated that the presence of two peaks of C1S at binding energy equal to 287.6 and 284.5 eV confirms the presence of carbon as C=N, as shown in Figure 2A. The presence of a peak of N1s at a binding energy at 398.5 eV confirms the presence of nitrogen as C=N-C (sp2 hybridized nitrogen), as shown in Figure 2B. The presence of two peaks of Fe2p at a binding energy equal to 710.2 and 724.8 eV confirms the presence of Fe3+ ion, as shown in Figure 2C. The presence of two peaks of O1s at a binding energy equal to 529.6 and 532.1 eV confirms the presence of an O2- ion, as shown in Figure 2D. Therefore, the XPS spectra of C, N, Fe and O confirm that the structure of the nanocomposite is Fe2O3 doped on g-C3N4.
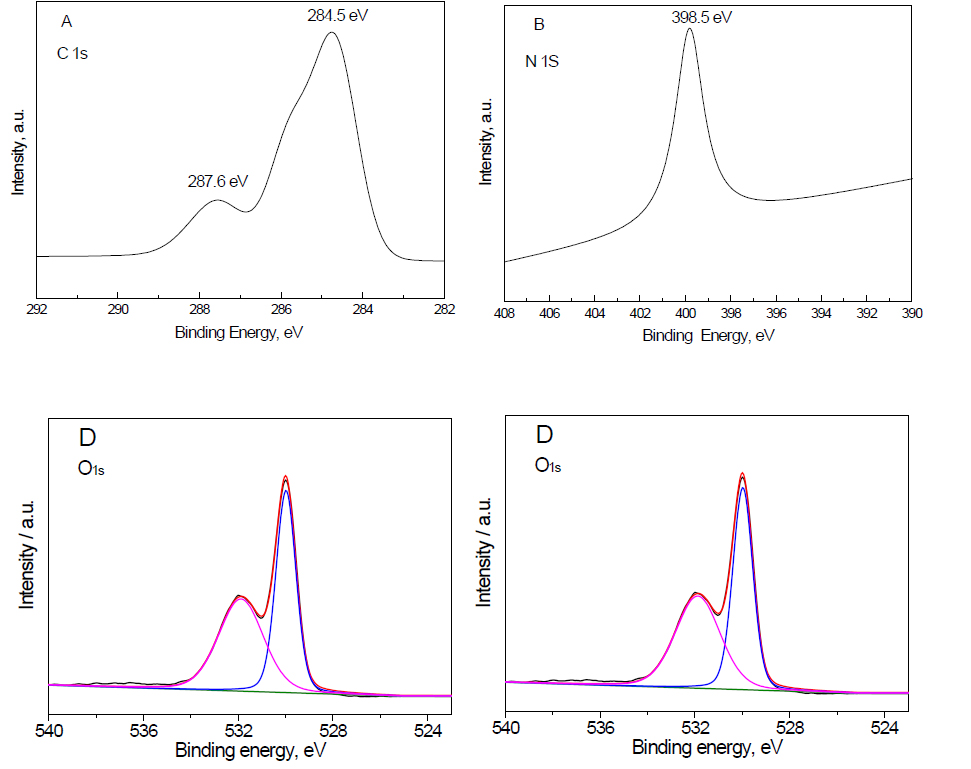
Figure 2. XPS spectra Fe2O3@ g-C3N4 -3 wt% sample, where (A) C1s; (B) N1S; (C) Fe2p and (D) O1s.
FT-IR examination: Figure 3 shows the FT-IR spectra of the g-C3N4, Fe2O3 and g-C3N4/Fe2O3. The results reveal that the formation of g-C3N4 was confirmed by the existence of a graphite-like sp2-bonding state and adsorption at 810 cm-1, which corresponds to the breathing mode of triazine. The characteristic stretching vibration of the tri-s-triazine heterocyclic rings is apparent in the range of 1200 to 1600 cm-1. The bands observed at 1317 and 1610 cm-1 are related to the C(sp2)-N and C(sp2)=N stretching modes, respectively. The broad band from 2900 to 3400 cm-1 is generally related to the stretching and deformation modes of the residual N-H groups and their intermolecular hydrogen bonding. For the g-C3N4/Fe2O3 composite, the weak peaks of g-C3N4 appeared in the spectrum of the sample with a low quantity of g-C3N4. The peaks at 1200 cm-1 and 3000 cm-1 are attributed to the C-N stretching vibration and N-H stretching mode of g-C3N4 in the g-C3N4/Fe2O3 sample.
TEM examination: The TEM images of g-C3N4 and Fe2O3 doped on g-C3N4 nanocomposite samples are shown in Figure 4. The results demonstrated that the dispersion of Fe2O3 above the g-C3N4 surface was increased as the weight percent of Fe2O3 was increased from 1 to 3 wt%, as shown in Figures 4A to D. Additionally, we noticed that the agglomeration of Fe2O3 above the g-C3N4 surface increased as the weight percent of Fe2O3 increased above 3 wt%, as shown in Figure 4E.
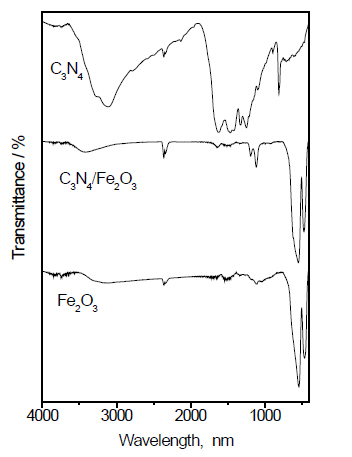
Figure 3. FT-IR spectra of Fe2O3@ g-C3N4 nanocomposite.
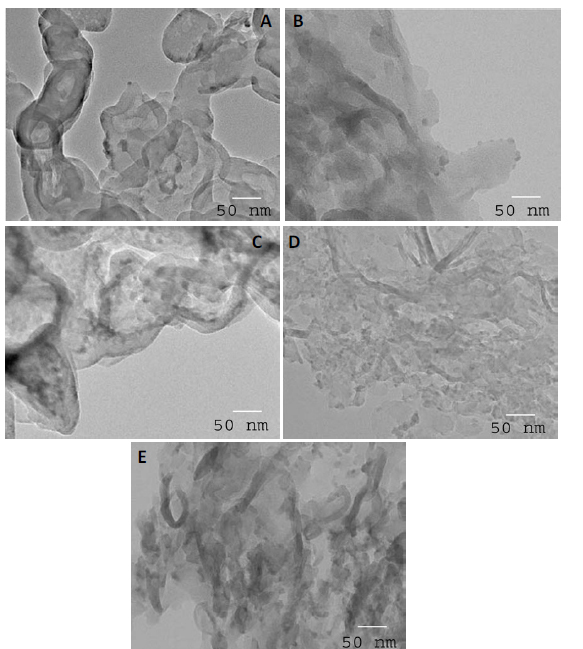
Figure 4. TEM images of g-C3N4 and Fe2O3@ g-C3N4 nanocomposites, where (A) g-C3N4; % (B) Fe2O3@ g-C3N4-1 wt%;(C) Fe2O3@ g-C3N4 -2 wt%; (D) Fe2O3@ g-C3N4 -3 wt% and (E) Fe2O3@ g-C3N4 -4 wt% samples
BET surface area examination: The BET surface area of g-C3N4 and Fe2O3 doped on g-C3N4 nanocomposite samples is shown in Table 1. The results demonstrated that the surface area of Fe2O3 doped on g-C3N4 nanocomposites is almost similar to that of the g-C3N4 sample. Therefore, BET surface area is not an important factor for the enrichment of the photocatalytic activity of graphitic carbon nitride.
Samples |
Surface area (m2/g) |
g-C3N4 |
80 |
Fe2O3@pg-C3N4 -1 wt% |
79.7 |
Fe2O3@pg-C3N4 -2 wt% |
79.6 |
Fe2O3@pg-C3N4 -3 wt% |
79.5 |
Fe2O3@pg-C3N4 -4 wt% |
79.4 |
Table 1. BET surface area of pg-C3N4 and Fe2O3 doped on pg-C3N4 samples
UV-Vis spectra examination: Figure 5 shows the UV-Vis spectra of g-C3N4 and Fe2O3 doped on g-C3N4 nanocomposite samples. The results demonstrated that the absorption edge of g-C3N4 was shifted to a longer wavelength as the weight percent of Fe2O3 was increased from 0 to 4 wt%. The band gap energy was calculated from the UV-Vis spectra, and the values obtained are 2.7, 2.6, 2.5, 2.3, and 2.2 eV, for g-C3N4, Fe2O3 doped on g-C3N4- 1 wt%, Fe2O3 doped on g-C3N4- 2 wt%, Fe2O3 doped on g-C3N4- 3 wt%, and Fe2O3 doped on g-C3N4- 4 wt%, respectively.
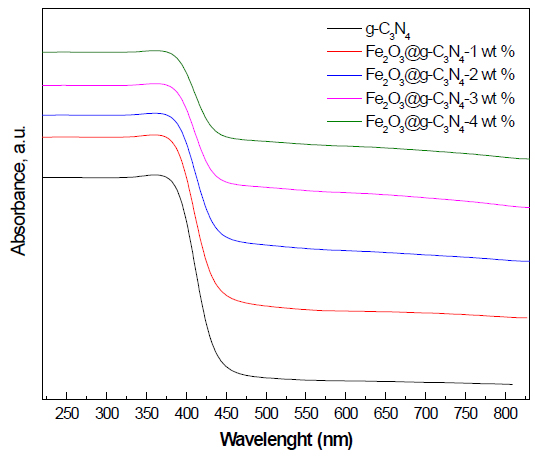
Figure 5. UV-Vis spectra of g-C3N4 and Fe2O3@ g-C3N4 nanocomposites.
PL spectra examination: The PL spectra of g-C3N4 and Fe2O3 doped on g-C3N4 nanocomposite samples is shown in Figure 6. The results demonstrated that the Pl peak intensity of g-C3N4 decreased as the weight percent of Fe2O3 was increased from 0 to 4 wt%. Thus, the presence of Fe2O3 on the g-C3N4 surface prevents electron- hole recombination by trapping photogenerated electrons.
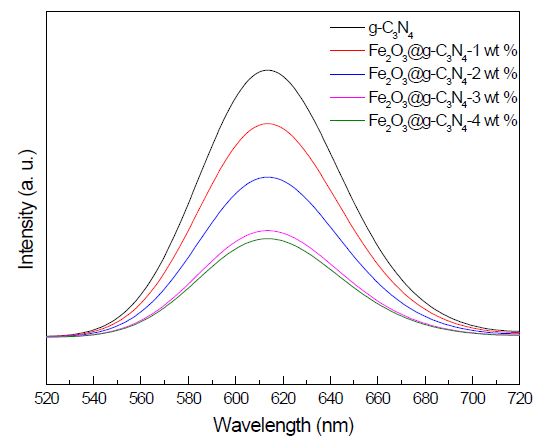
Figure 6. PL spectra of g-C3N4 and Fe2O3@ g-C3N4 nanocomposites.
Photocatalytic activities
Effect of weight percent of Fe2O3 on the photocatalytic activity of g-C3N4 nanocomposites for the removal of Pb ions: The effect of weight percent of Fe2O3 on the photocatalytic activity of g-C3N4 nanocomposites for the removal of Pb ions is shown in Figure 7. The results reveal that increasing the weight percent of Fe2O3 from 0 to 3 wt% increases the photocatalytic activity of g-C3N4 from 66 to 100%, respectively. In addition, we noticed that increasing the weight percent of Fe2O3 above 3 wt% has no significant effect on the photocatalytic activity of g-C3N4. Therefore, the weight percent of Fe2O3 plays an important role in the control band gap and the photocatalytic activity of the g-C3N4 photocatalyst. Fe2O3 doped on the g-C3N4 -3 wt% photocatalyst has the highest photocatalytic activity.
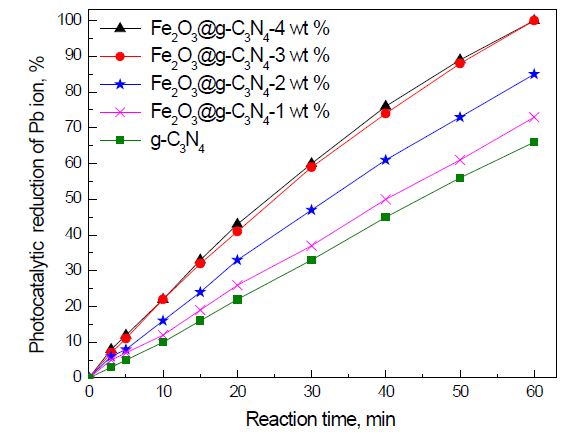
Figure 7. Effect of weight percent of Fe2O3 on photocatalytic activity of g-C3N4 nanocomposites for the removal of Pb ions.
Effect of dose of Fe2O3 doped on g-C3N4 -3 wt% photocatalyst on the photocatalytic activity of g-C3N4 nanocomposites for the removal of Pb ions: The effect of the dose of Fe2O3 doped on g-C3N4 -3 wt% photocatalyst on the photocatalytic activity of g-C3N4 nanocomposites for the removal of Pb ions is shown in Figure 8. The results reveal that the photocatalytic activity of Fe2O3 doped on g-C3N4 -3 wt% photocatalyst increased from 85 to 100% by increasing the dose of Fe2O3 doped on g-C3N4 -3 wt% photocatalyst from 0.5 to 1.0 g/L, respectively. Increasing the dose of Fe2O3 doped on g-C3N4 -3 wt% photocatalyst from 1.0 to 1.5 to 2.0 g/L decreases the reaction time required for the complete reduction of Pb ions from 60 to 50 to 40 min, respectively. This can be attributed to the fact that an increased dose of Fe2O3 doped on g-C3N4 -3 wt% photocatalyst will increase the number of active sites available for photocatalytic reduction. However, increasing the dose of Fe2O3 doped on g-C3N4 -3 wt% photocatalyst above 2.0 g/L increases the reaction time again from 40 to 60 min. Increasing the dose above a certain amount hinders the penetration of light to the surface
p of the photocatalyst and thus either decreases photocatalytic activity or increases reaction time.
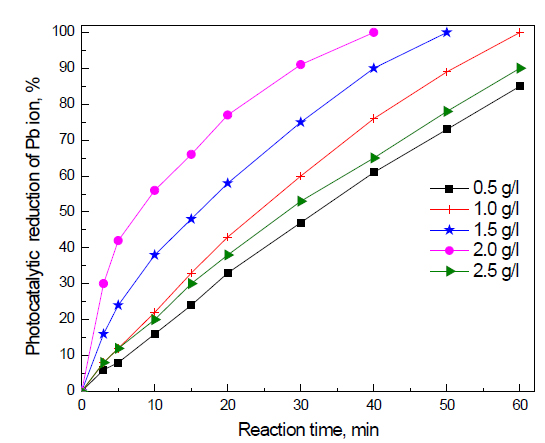
Figure 8. Effect of dose of Fe2O3@ g-C3N4 -3 wt % photocatalyst on photocatalytic activity of g-C3N4 nanocomposites for the removal of Pb ions.
Effect of initial concentration of Pb ions on the photocatalyst photocatalytic activity of g-C3N4 nanocomposites for the removal of Pb ions: The effect of initial concentration of Pb ions on the photocatalyst photocatalytic activity of g-C3N4 nanocomposites for the removal of Pb ions is shown in Figure 9. The results reveal that increasing the concentration of Pb ions from 25 to 100 ppm has no significant effect on the reaction time required to complete the reduction of Pb ions (20 min). Increasing the initial concentration from 50 to 75 to 100 to 125 to 150 increases the reaction time from 20 to 30 to 40 to 50 to 60 min, respectively.
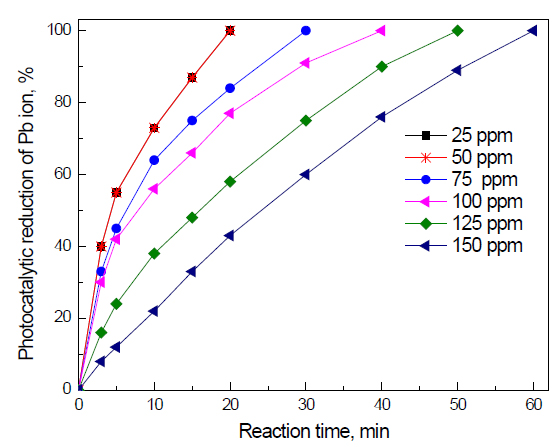
Figure 9. Effect of the initial concentration of Pb ions on the photocatalyst photocatalytic activity of g-C3N4 nanocomposites for the removal of Pb ions.
Recycling and reuse of Fe2O3 doped on g-C3N4 -3 wt% photocatalyst for the removal of Pb ions: The recycling and reuse of Fe2O3 doped on g-C3N4 -3 wt% photocatalyst for the removal of Pb ions is shown in Figure 10. The results reveal that Fe2O3 doped on g-C3N4 -3 wt% photocatalyst has photocatalytic stability for the reduction of Pb ions for five times.
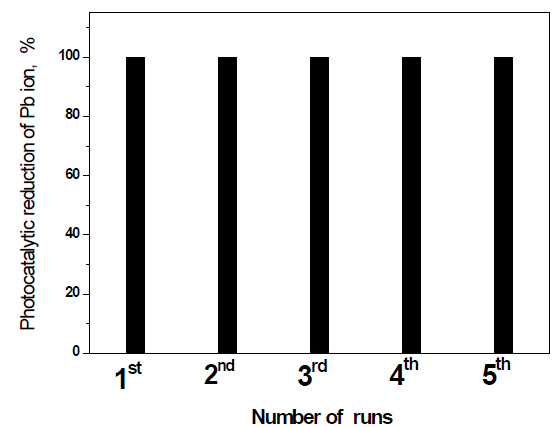
Figure 10. Recycling and reuse of Fe2O3@ g-C3N4 -3 wt % photocatalyst for the removal of Pb ions.
Conclusions
A pyrolysis technique of urea and dicyandiamide in an air atmosphere was used to prepare graphitic carbon nitride, and a modified precipitation technique was used to prepare Fe2O3 doped on g-C3N4 nanocomposites. Different techniques, such as UV-Vis, XPS, FT-IR, XRD, PL and BET surface area, were used to characterize the prepared materials. The results demonstrated that the band gap and photocatalytic activity of Fe2O3 doped on g-C3N4 nanocomposites can be controlled by controlling the weight percent of Fe2O3. The photocatalytic activity of Fe2O3 doped on g-C3N4 nanocomposites for the reduction of Pb ions is higher than that of the g-C3N4 photocatalyst. This can be attributed to the fact that the addition of Fe2O3 to g-C3N4 decreases the electron- hole recombination rate and shifts the absorption of pg-C3N4 to a higher wavelength or alternatively due to the transfer of electrons between g-C3N4 and Fe2O3. Fe2O3 doped on g-C3N4 -3 wt% photocatalyst has photocatalytic stability for the reduction of Pb ions for five times.
References
2021 Copyright OAT. All rights reserv
- Colborn, T, Kwiatkowski C, Schultz K, Bachran M (2011) Natural gas operations from a public health perspective. Human and ecological risk assessment: An International Journal 17: 1039-1056.
- Khan S, Shahnaz M, Jehan N, Rehman S, Shah MT, et al. (2013) Drinking water quality and human health risk in Charsadda district, Pakistan. Journal of Cleaner Production 60: 93-101
- Shawabkeh R (2009) Equilibrium study and kinetics of Cu2+ removal from water by zeolite prepared from oil shale ash. Process Safety Environ Protect 87: 261–266.
- Shawabkeh RA, Abu-Nameh ESM (2007) Absorption of phenol and methylene blue by activated carbon from pecan shells. Colloid J 69: 355–359.
- Zhang JW, Fang H, Wang JW, Hao LY, Xu X, et al. (2014) Chen, Preparation and characterization of silicon nitride hollow fiber membranes for seawater desalination. J Membr Sci 450:197–206.
- Pereira RF, Valente AJ, Burrows HD (2014) The interaction of long chain sodium carboxylates and sodium dodecylsulfate with lead (II) ions in aqueous solutions. J Colloid Interface Sci 414: 66-72. [Crossref]
- Burke DM, Morris MA, Holmes JD (2013) Chemical oxidation of mesoporous carbon foams for lead ion adsorption. Sep Purif Technol 104:150–159.
- Badani Z, Ait-Amar H, Si-Salah A (2007) The inhibitive effect of lead concentration on the biological treatment of wastewater of oil well drillings. Desalination 206: 295–299.
- Chang HT, Wu NM, Zhu F (2000) A kinetic model for photocatalytic degradation of organic contaminants in a thin-film TiO2 catalyst. Water Res 34: 407–416.
- Chen L, Graham ME, Li G, Gentner DR, Dimitrijevic NM, Gray KA (2009) Photoreduction of CO2 by TiO2 nanocomposites synthesized through reactive direct current magnetron sputter deposition. Thin Solid Films 517: 5641–5645.
- Sun D, Liu J, Li J, Feng Z, He L, et al. (2014) Solvothermal synthesis of spindle-like WO3/TiO2 particles with enhanced photocatalytic activity. Mater Res Bull 53:163–168.
- Yu C, Cao F, Li G, Wei R, Yu JC, et al. (2013) Novel noble metal (Rh, Pd, Pt)/BiOX(Cl, Br, I) composite photocatalysts with enhanced photocatalytic performance in dye degradation. Sep Purif Technol 120: 110–122.
- Leghari SAK, Sajjad S, Chen F, Zhang J (2011) WO3/TiO2 composite with morphology change via hydrothermal template-free route as an efficient visible light photocatalyst. Chem Eng J 166: 906–915.
- Yao L, Zhang YC, Li J, Chen Y (2014) Photocatalytic properties of SnS2/SnO2 nanocomposite prepared by thermal oxidation of SnS2 nanoparticles in air. Sep Purif Technol 122: 1–5.
- Zhao Y, Zhang Y, Li J, Chen Y (2014) Solvothermal synthesis of non-metals modified SnO2 nanoparticles with high visible-light-activated photocatalytic activity in the reduction of aqueous Cr(VI). Sep Purif Technol 129: 90–95.
- Fu Q, Saltsburg H, Flytzani-Stephanopoulos M (2003) Active nonmetallic Au and Pt species on ceria-based water-gas shift catalysts. Science 301: 935-938. [Crossref]
- Murray EP, Tsai T, Barnett SA (1999) A direct-methane fuel cell with a ceria-based anode. Nature 400: 649-651.
- Suresh S, Irvine AE (2015) The NOTCH signaling pathway in normal and malignant blood cell production. J Cell Commun Signal 9: 5-13.[Crossref]
- Corma A, Atienzar P, Garcia H, Chane-Ching JY (2004) Hierarchically mesostructured doped CeO2 with potential for solar-cell use. Nat Mater 3: 394.
- Morshed AH, Moussa ME, Bedair SEM, Leonard R, Liu SX, et al. (1997) Violet/blue emission from epitaxial cerium oxide films on silicon substrates. App Phys Lett 70: 1647.
- Tsunekawa S, Fukuda T, Kasuya A (2000) Blue shift in ultraviolet absorption spectra of monodisperse CeO2-xnanoparticles J Appl Phys 87:1318.
- Dunkle SS, Helmich RJ, Suslick KS (2009) BiVO4 as a Visible-Light Photocatalyst Prepared by Ultrasonic Spray Pyrolysis. J Phy Chem C 113:11980–11983.
- Zhang X, Ai ZH, Jia FL, Zhang LZ (2008) Generalized One-Pot Synthesis, Characterization, and Photocatalytic Activity of Hierarchical BiOX (X = Cl, Br, I) Nanoplate Microspheres. J Phy Chem C 112: 747–753.
- Xia J, Yin S, Li H, Xu H, Yan Y, et al. (2011) Self-assembly and enhanced photocatalytic properties of BiOI hollow microspheres via a reactable ionic liquid. Langmuir 27: 1200-1206. [Crossref]
- Xia J, Yin S, Li H, Xu H, Xu L, et al. (2011) Improved visible light photocatalytic activity of sphere-like BiOBr hollow and porous structures synthesized via a reactable ionic liquid. Dalton Trans 40: 5249–5258.
- Maeda K, Wang X, Nishihara Y, Lu D, Antonietti M, Domen K (2009) Photocatalytic Activities of Graphitic Carbon Nitride Powder for Water Reduction and Oxidation under Visible Light. J Phy Chem C 113: 4940–4947.
- Yan SC, Li ZS, Zou ZG (2009) Photodegradation performance of g-C3N4 fabricated by directly heating melamine. Langmuir 25: 10397-10401. [Crossref]
- Wang Y, Wang X, Antonietti M (2012) Polymeric graphitic carbon nitride as a heterogeneous organocatalyst: from photochemistry to multipurpose catalysis to sustainable chemistry. Angen Chem Int Ed 51: 68–89.
- Su F, Mathew SC, Möhlmann L, Antonietti M, Wang X, et al. (2011) Aerobic oxidative coupling of amines by carbon nitride photocatalysis with visible light. Angew Chem Int Ed Engl 50: 657-660. [Crossref]
- Guo Y, Chu S, Yan S, Wang Y, Zou Z (2010) Developing a polymeric semiconductor photocatalyst with visible light response. Chem Commun (Camb) 46: 7325-7327. [Crossref]
- Su F, Mathew SC, Lipner G, Fu X, Antonietti M, et al. (2010) mpg-C(3)N(4)-Catalyzed selective oxidation of alcohols using O(2) and visible light. J Am Chem Soc 132: 16299-16301. [Crossref]
- Goettmann F, Fischer A, Antonietti M, Thomas A (2006) Biopolymer-Activated Graphitic Carbon Nitride towards a Sustainable Photocathode Material. Angen Chem Int Ed 45: 4467–4471.
- Chen X, Jun YS, Takanabe K, Maeda K, Domen K, et al. (2009) Ordered Mesoporous SBA-15 Type Graphitic Carbon Nitride: A Semiconductor Host Structure for Photocatalytic Hydrogen Evolution with Visible Light. Chem Mater 21: 4093–4095.
- Li XH, Zhang J, Chen X, Fischer A, Thomas A, et al. (2011) Condensed Graphitic Carbon Nitride Nanorods by Nanoconfinement: Promotion of Crystallinity on Photocatalytic Conversion. Chem Mater 23: 4344–4348.
- Wang Y, Wang X, Antonietti M, Zhang Y (2010) Facile one-pot synthesis of nanoporous carbon nitride solids by using soft templates. Chem Sus Chem 3: 435-439. [Crossref]
- Dong G, Zhang L (2012) Porous structure dependent photoreactivity of graphitic carbon nitride under visible light. J Mater Chem 22: 1160–1166.
- Cui Y, Zhang J, Zhang Z, Huang J, Liu P, et al. (2011) Synthesis of bulk and nanoporous carbon nitride polymers from ammonium thiocyanate for photocatalytic hydrogen evolution. J Mater Chem 21: 13032–13039.
- Kailasam K, Epping JD, Thomas A, Losse S, Junge H (2011) Mesoporous carbon nitride–silica composites by a combined sol–gel/thermal condensation approach and their application as photocatalysts. Energy & Enviro Sci 4: 4668–4674.
- Chen X, Zhang J, Fu X, Antonietti M, Wang X (2009) Fe-g-C3N4-catalyzed oxidation of benzene to phenol using hydrogen peroxide and visible light. J Am Chem Soc 131: 11658-11659.[Crossref]
- Wang X, Chen X, Thomas A, Fu X, Antonietti M (2009) Metal-Containing Carbon Nitride Compounds: A New Functional Organic–Metal Hybrid Material. Adv Mater 2: 1609–1612.
- Ding Z, Chen X, Antonietti M, Wang X (2011) Synthesis of transition metal-modified carbon nitride polymers for selective hydrocarbon oxidation. Chem Sus Chem 4: 274-281. [Crossref]
- Zhang J, Grzelczak M, Hou Y, Maeda K, Domen K, et al.(2012) Photocatalytic oxidation of water by polymeric carbon nitride nanohybrids made of sustainable element. Chem Sci 3: 443–446.
- Ge L, Han C, Liu J, Li Y (2011) Enhanced visible light photocatalytic activity of novel polymeric g-C3N4 loaded with Ag nanoparticles. Appl Catal A-Gen 409–410: 215–222.
- Wang Y, Yao J, Li H, Su D, Antonietti M (2011) Highly selective hydrogenation of phenol and derivatives over a Pd@carbon nitride catalyst in aqueous media. J Am Chem Soc 133: 2362-2365. [Crossref]
- Silva CG, Faria JL (2010) Photocatalytic Oxidation of Phenolic Compounds by Using a Carbon Nanotube-Titanium Dioxide Composite Catalyst. Chem Sus Chem 3: 609–618.
- Yan SC, Lv SB, Li ZS, Zou ZG (2010) Organic–inorganic composite photocatalyst of g-C3N4 and TaON with improved visible light photocatalytic activities. Dalton Trans 39: 1488–1491.
- Ge L, Han C, Liu J (2011) Novel visible light-induced g-C3N4/Bi2WO6 composite photocatalysts for efficient degradation of methyl orange. Appl Catal B-Envi 108–109: 100–107.