Abstract
Nanotechnology product development and is raising concerns about the possible impacts on the environment. Zinc oxide nanoparticles (nano-ZnO), which are used as transparent sunscreens and cosmetics, find their way into the aquatic environment via surface water runoff near beaches and wastewater treatment plants. The purpose of this study was to examine the neurotoxicity of municipal effluent in fathead minnows exposed to either dietary nano-ZnO or ZnCl2. Adult male and female fathead minnows were exposed to 100 ng Zn/g of either nano-ZnO or ZnCl2 in the diet and to dilutions of municipal effluent for 21 days at 25°C. The following biomarkers were determined after the exposure period: tissue metal levels, brain DNA damage, lipid peroxidation, metallothioneins, dopamine, acetylcholinesterase, monoamine oxidase and mitochondrial electron transport activity (a marker of cellular energy expenditure). The data revealed that although fish did not significantly accumulate Zn from dietary nano-ZnO or ZnCl2, the difference in tissue levels of Zn was significantly higher in females than in males when nano-ZnO or ZnCl2 was added in the presence of municipal effluent. Monoamine oxidase and acetylcholinesterase activity and dopamine levels were induced by the municipal effluent, but was halted by the addition of both dietary Zn forms. Exposure of fish to dietary nano-ZnO led to more significant changes in mitochondrial electron transport activity, acetylcholinesterase activity, and dopamine and MT levels, while exposure to dietary ZnCl2 and municipal effluent led to additional changes in gonadosomatic index, dopamine, Ag and Cu levels. Increased brain LPO levels were reported in males exposed to the municipal effluent and dietary nano-ZnO. Decreased DNA strand breaks were observed in fathead minnows exposed to the municipal effluent, suggesting decreased DNA repair activity, but were not observed in the presence of dietary nano-ZnO and ZnCl2. In conclusion, the neurotoxicological properties of the municipal effluents could be modulated by dietary nano-ZnO or ZnCl2, and in the presence of municipal effluent, nano-ZnO effects were closely related to those in fish fed a ZnCl2-supplemented diet.
Key words
Fathead minnows, municipal effluents, zinc oxide nanoparticles, neurotoxicity, DNA damage, oxidative stress and energy expenditure.
Introduction
Nanotechnology is the production of engineered materials in the size range of 1-100 nm. The colloidal nature of these products brings about high specific surface areas with emerging physicochemical properties relative to that are not observed fromtheir constituents. The current development of the industry raises the issue of inadvertent releases of nanomaterials into the environment with unknown consequences on wildlife. Information on their persistence and stability in the environment is currently available [1]. Zinc oxide nanoparticles (nano-ZnO) are used in a wide variety of commercial applications, including personal care products, such as transparent sunscreens, as well as in cosmetics, ointments, pigments and lubricants because of their antibacterial properties [2]. The antibacterial activity of nano-ZnO is of added interest to consumers, who depend on the “controlled” release of Zn2+ ions in cream preparations [3,4]. Uncoated nano-ZnO has low zeta potential, which makes them susceptible to aggregation and precipitation in solution [5]. The presence of dissolved organic material (DOM), which is found at relatively high concentrations in some types of surface water (brown water) and municipal effluents, could limit aggregation and increase the proportion of the monomeric form of nano-ZnO in solution [6]. The increasing use of nano-ZnO-based sunscreens and cosmetics has raised the issue of the contamination of surface waters in highly populated areas with recreational beaches and their release by municipal effluents. The interaction between nano-ZnO and the organic matrix of municipal wastewaters is little understood at this time.
The effects of the toxicity of municipal effluents, which are highly complex mixtures, are diverse and include endocrine disruption, genotoxicity, inflammation and oxidative stress [7-9]. Municipal effluents are known to act as endocrine disruptors, affecting reproduction by interfering with estrogen and serotonin receptor pathways [10,11]. They also contain hormones and pharmaceuticals (17α-ethinyl-estradiol), which can contribute to disruption of sexual differentiation, gametogenesis and egg maturation. In a previous study, wild sexually immature spottail shiners collected downstream of a major municipal effluent outfall in the St. Lawrence River (QC, Canada) expressed vitellogenin mRNA, which codes for vitellogenin, the main egg yolk protein precursor normally expressed in females [12]. In addition, spermatogenesis was delayed in fish collected downstream where sperm counts and motility were significantly lower. The prevalence of intersex, a condition whereby males exhibit female oocytes, were above the background levels at 30% at the downstream sites. Serotonergic effects in trout exposed to municipal effluents were also observed, and serotonergic activity (serotonin-dependent ATPase activity in brain synaptosome) was correlated with brain tissue concentrations of some selective serotonin reuptake inhibitors [13].
These studies suggest that endocrine disruption that occurs in fish could resonate at the neurological level as well. The neurotoxicological properties of municipal effluents, which are sources of neuroactive agents (pharmaceuticals), estrogens and nanoparticles in the aquatic environment, in fish are not well understood. Fathead minnows exposed to municipal effluents were found to have induced plasma vitellogenin and evidence of ovipositors in male fish [14]. The secondary sexual characteristics of male were less apparent as evidenced by discoloration of the banding patterns, little development of the dorsal pad and absence of a dorsal fin dot. Nanoparticles and municipal effluents could also lead to oxidative stress and genotoxicity[15-17]. Nerve tissues are rich in polyunsaturated lipids, which can undergo lipid peroxidation (LPO) in the presence of reactive oxygen species. Indeed, hepatic LPO was significantly elevated in organisms found in the vicinity of sewage pollution (Bianchi et al., 2014). Oxidative stress could also lead to DNA damage by the formation of oxygen adducts (8-oxo-guanosine). Evidence of DNA damage in fish exposed to municipal effluents and to nanoparticles with surface area reactivity has been reported [16,17]. Metallothioneins (MT) a small molecular weight cysteine-rich proteins that bind essential divalent elements such Zn and copper (Cu) and non-essential elements such as cadmium, mercury and silver [18]. The MT biomarker provides useful information on the the presence and mobility of metal ions in cells. Neural activity could be monitored by acetylcholinesterase (AchE) activity, which is involved in the inactivation of acetylcholine, an important neurotransmitter in the central nervous system that is involved in learning, physiological stimulation and plasticity [19,20]. Monoamine oxidases (MAO) are located in the mitochondria and involved in the oxidative deamination of indoleamines (serotonin) and catecholamines (dopamine and adrenaline), which are major neurotransmitters in the brain. Catecholamines are considered stimulatory neurotransmitters involved in the activation of β-adrenergic signaling (sympathetic state) and feeding reward [21]. It has been shown that in fish under β-adrenergic stimulation, high levels of dopamine were associated with conditioned place preference paradigm behaviour (the preference of fish to stay or visit a tile for egg laying for example) and this response could be modulated by central cholinergic stimulation [22]. Decreased acetylcholinesterase activity was shown to reduce conditioned place preference behaviour, in fish suggesting an interaction between monoamine stimulation and cholinergic signalization in the brain. Neural activity is also coupled with metabolic energy expenditure, which can be determined by mitochondrial electron transport activity, which is associated with O2consumption and CO2 production in cells, which requires glucose for ATP production. In a previous study, elevated mitochondrial electron transport (MET) activity in visceral mass was observed in mussels exposed to municipal effluents, suggesting increased activity and energy expenditure. This suggests that aquatic organisms exposed to urban pollutants expend more energy than organisms from more pristine sites, which can compromise health status, growth and reproduction in the long term.
The purpose of this study was to examine the neurotoxicological effects of combined exposures to dietary nano-ZnO or ZnCl2 and municipal effluent in adult fathead minnows. Fathead minnows were exposed to nano-ZnO or ZnCl2 though their diets and to dilutions of a typical physicochemically treated effluent. The dietary route exposure for nano-ZnO was selected given the poor solubility of uncoated ZnO in water and to ensure that the fish were exposed to the nanoparticles present in the feed. For comparison purposes, fish were also exposed to dietary ZnCl2 to determine whether or not the same interaction with the municipal effluent and nano-ZnO diet occurred. The bioavailability of Zn was determined in fish carcasses, and biomarkers of stress were determined in brain tissue. The biomarkers were MT, LPO and DNA damage. Neurotoxicity was assessed by measuring changes in AchE, MAO and dopamine levels and mitochondrial electron transport activity. An attempt was made to highlight the cumulative effects of a physicochemically treated municipal effluent and dietary nano-ZnO or ZnCl2 for 21 days based on sex, municipal effluent concentrations and Zn forms in adult fathead minnows.
Materials and methods
Fathead minnow reproduction assay and exposure to municipal effluent
Fish were cultured and bred at a fathead minnow colony at the wet laboratory of the Aquatic toxicology laboratory at the Montreal Wastewater Treatment Plant (QC, Canada). The study employed a 21-day exposure regime with a 1:2 male to female ratio in 12.5 L tanks into which diluted municipal effluents was continuously pumped (1 L per hour). Briefly, two males and four females were held in a 12-L aquarium for a period of 7 days prior to exposure to the effluent, dietary ZnCl2 and nano-ZnO. The aquariums contained spawning tiles made from two 8-cm lengths of polyvinyl pipes with a 10-cm diameter, cut in half longitudinally, which were monitored in the mornings for egg production. Successful fertilization of spawned eggs under a microscope, and groups exhibiting the highest egg fertilization rate were selected for the experiment. In fully active fish, exposure to the effluent was initiated using concentrations of 5, 10 and 20% v/v at 25°C. The effluent was constantly renewed (1 L/hr flow rate) and was pre-heated to 25°C before being pumped into the fish aquariums. The exposure experiments were repeated with two replicate tanks for each treatment group. In addition to real-time exposure to the municipal effluents, one group of fish was exposed to either nano-ZnO- or ZnCl2-spiked feed at a nominal concentration of 100 µg of total Zn per kg of feed. The fish were fed daily with commercial feed during the exposure experiments (10 g per aquarium). The feed was placed in a Waring blender at low speed, and zinc (ZnCl2 or nano-ZnO, 50 nm diameter from Sigma Chemical Company) was added in 10 × 100µL volume increments to ensure homogenous distribution in the mixture. Control fish were exposed to aquarium and unspiked feed. The fish were exposed to these conditions at 25°C for 21 days under constant aeration16 h light and 8 h dark. Water pH, dissolved oxygen and temperature were monitored daily, and the spawning tiles were checked for egg production (the tiles were replaced with new ones when the egg density was >50% of the surface areaof the tile). At the end of the exposure period, the fish were anesthetized in a solution of 50 mg/L MS-222 (Sigma-Aldrich, Ontario, Canada) in accordance with the guidelines of the Animal Care Committee. Fork length and wet body weight, gonad weight and brain weight were recorded. The organs were then mixed with three (different tubes) volumes of homogenization buffer before freezing at -85°C. The homogenization buffer consisted of 250 mM sucrose and 25 mMHepes-NaOH, at pH 7.4, containing 1 mMdithiothreitol and 10 µg/ml apoprotinin (protease inhibitor) and the tissues were homogenized using a Teflon pestle tissue grinder (5 passes) on ice. A portion of the homogenate was centrifuged first at 3 000 x g for 15 min at 4°C, and the resulting supernatant (S3 fraction) was centrifuged at 15 000 x g for 30 min at 4°C. The supernatant (S15 fraction), S3 fraction and homogenate were then conserved at -85°C until analysis. The male and female secondary sexual characteristics were also evaluated: ovipositor, banding coloration in males, nuptial tubercles and head-sponge appearance. The fish carcasses were set aside for heavy metal analysis by ion plasma mass spectrometry, as described below.
Metal bioaccumulation
To determine metal bioaccumulation in fish, tissues were acid-digested with 8 ml of concentrated HNO3, 1 ml of concentrated HCl, and 2 ml of concentrated H2O2 (Seastar Baseline). The tissues were then digested during 2 h at 170°C using a microwave digestion system (Ethos EZ, Milestone ScientificInc, ON, Canada). The samples were completed to final volume of 12 ml with deionized water. Total metal concentrations were afterwards determined by XSERIES 2 ICP-MS (Thermo Scientific, USA) and standard solutions of these elements were used for calibration. The data were expressed as µg/g dry weight and reproductivity was better than 5%. The recovery for these metals was between 90% and 105%.
Neurotoxicity assessment
Acetylcholinesterase (AChE) activity was determined using the acetylthiocholine substrate assay [23]. The assay was performed using 3000 x g supernatant of homogenate in the presence of 0.5 mMacetylthiocholine and Ellman’s reagents (5,5'-Dithiobis(2-nitrobenzoic acid) at pH 7.2 in 100 mMTris-acetate buffer. The formation of thiocholine in time (0-30 min at 30°C) was followed by absorbance at 412 nm in clear polystyrene microplates (Synergy 4, BioTek Instruments, USA). A calibration curve was prepared using reduced glutathione, and the data was expressed as µmole thiols/min/mg protein in the S3 fraction. Monoamine oxidase (MAO) activity was determined by the coupled dichlorofluorescein-peroxidase activity as described elsewhere [24]. The mitochondria were first isolated by centrifugation of the S3 fraction at 9 000 x g for 20 min at 4°C, and the mitochondrial pellet was resuspended in the homogenization buffer and referred to as the mitochondrial fraction. The reaction mixture consisted of 100 µM tryptamine, 2 µM dichlorofluorescein, 100 µM aminotriazole (a catalase inhibitor) and 1 µg/mL horseradish peroxidase. The reaction was started by the addition of 50-100 µg/mL total protein of the mitochondrial fraction and incubated at 30°C for 0, 30, 45 and 60 min. Fluorescence readings were taken at 485 nm excitation and 520 nm emission at each time. Enzymatic activity was expressed as the increase in fluorescence/min/mg protein. Standard solutions of fluorescein were used for optimal instrument adjustments at these wavelengths and calibration.
Dopamine levels in the S15 fraction were determined using a luminescent enzyme-linked immunoassay, as previously described [8]. Briefly, 96-well luminescence plates (Microlite 2, Thermo Fisher Scientific, Ontario, Canada) were coated with 0.5 µg of BSA-conjugated dopamine (US Biological, Boston, USA) in 50 mMTris-HCl, pH 8.5 at 4°C overnight. The wells were washed with 100 µL PBS and 50 µL of dopamine standard, and prediluted S15 fraction samples and a blank were added to the wells. One volume of primary antibody (diluted at 1:5000; rabbit polyclonal to dopamine ab888, Abcam, MA, USA) was added. After incubation for 90 min at room temperature, the wells were washed three times with PBS and incubated with 100 µL of peroxidase-conjugated goat anti-rabbit IgC (1:10 000; StressGen, MI, USA) for 1 hour. Wells were washed three times with PBS, and peroxidase activity was determined using a chemiluminescent substrate (BM Chemiluminescence ELISA Substrate, Roche Diagnostics, QC, Canada). Luminescence readings were taken after 5 min using a luminescence microplate reader (Synergy 4, BioTek Instruments, USA). The data were expressed as µmol dopamine/mg protein in the S15 fraction.
Metallothioneins, oxidative stress and genotoxicity assessments
Lipid peroxidation (LPO) was determined in brain homogenates using the thiobarbituric acid method [25]. A volume of 50 µL of the homogenate was mixed with 200 µL of 10% trichloroacetic acid containing 1 mM FeSO4 and 100 µL of 0.7% thiobarbituric acid and heated at 70-80°C for 10 min. The mixture was cooled to room temperature and centrifuged at 10 000 x g for 5 min to remove any precipitates. A 200 µl volume was transferred to a 96-well dark microplate, and fluorescence readings were taken at 520 nm excitation and 600 nm emission. Standard solutions of tetramethoxypropane (stabilized form of malonaldehyde) were prepared for calibration on the blank (homogenization buffer). Results were expressed as µmole thiobarbituric acid reactants (TBARS) / mg total proteins in the homogenate. DNA damage was determined in brain homogenates using the alkaline precipitation assay [26] which is based on the precipitation of DNA-proteins in potassium dodecyl sulfate. Protein-free DNA strand breaks were measured in the supernatant by fluorometry. A 25-µL sample of the homogenate was mixed with 225 µL detergent solution (2% SDS containing 10 mM EDTA, 10 mMTris base and 40 mMNaOH) for 1 min, followed by the addition of 250 µL of 0.12 M KCl. The mixture was mixed by inversion, incubated at 60°C for 10 min, cooled on ice for 15 min and centrifuged at 8 000 x g for 10 min. A 50 µL volume of the supernatant was mixed with 150 µL of 100 µg/mL Hoescht in 0.1 M Tris-Acetate, pH 8.5, containing 4 mM sodium cholate and 0.4 M NaCl, and fluorescence readings were taken at 360 nm excitation and 450 nm emission. Standard solutions of salmon sperm DNA was prepared for calibration. The data were expressed as µg DNA strand/mg total protein in the homogenate.
Metallothionein (MT) levels were determined using the thiol spectrophotometric assay developed by [27]Viarengoet al. (1997) with some modifications. Since MT is also involved in the sequestration of oxygen radicals in addition to metal binding, a strong reduction step was added before the fractionation steps. Briefly, 100 µL of the S15 fraction were treated with 25 mM of Tris(2-carboxyethyl)phosphine for 30 min to ensure complete reduction [28]. The data were expressed as µg thiols/mg proteins.
Mitochondrial electron transport activity
Mitochondrial electron transport activity was determined using a dye reduction method, as previously described [29]. The assay is based on the reduction of a tetrazolium dye which was significantly associated with cellular respiration rates (CO2 production) in miscellaneous organisms [30]. The crude mitochondrial fraction was first obtained by centrifuging the S3 fraction at 9 000 x g for 20 min at 4°C. The pellet was resuspended in 0.1 M Tris-HCl, pH 8.5, containing 0.1 mM MgSO4, 0.1% Triton X-100 and 5% polyvinylpyrrolidone and resuspended by pipette aspiration. 1 mM of NADH and 0.2 mM NAPDH were then added to the mitochondrial suspension. The reaction was started by adding 1 mM of p-iodonitrotetrazolium. The reaction was allowed to proceed at 20°C for 30 min and absorbance readings were taken at 520 nm at 5-min intervals. The data were expressed as absorbance increase/30 min/mg mitochondrial protein content.
Data analysis
The exposure experiment consisted of 2 males and 4 females per treatment aquarium and the experiment was repeated twice. Tissue biomarkers were analyzed in N=4 males and N=4 females fish using two-way factorial analysis of variance (exposure groups and sex as the main factors) after verifying for homogeneity of variance and normality using Levene’s test and the Shapiro-Wilk test. Correlation analysis was also performed using the Pearson product moment correlation. To determine the physiological changes induced by exposure to municipal effluents and the two zinc formulations in the feed, a discriminant function analysis and factorial analysis were performed. All statistical tests were performed using Statistica software (version 8). Significance was set at α=0.05.
Results
In fish exposed to the municipal effluents and to each form of Zn, the condition factor (weight/fork length) was not significantly affected by the municipal effluent alone or with Zn treatments. There was a significant difference between sexes, with males being about 2.2 times larger than females, which is normal for this species. However, there was a significant difference between sexes and a marginal interaction between these two factors (p=0.08). In females, neither municipal effluent nor dietary Zn treatments were observed to have significant effects. In males, there was no significant change, although the data had more variance, but the difference between males and females was no longer significant for fish fed toto nano-ZnO alone. This small effect was lost however when municipal effluent was present. The gonadosomatic index (GSI) was significantly affected by both effluent- dietary Zn treatments and sex (two-way factorial ANOVA: effluent/Zn forms > sex>effluent/Zn treatments*sex interaction). In control fish, the GSI in males was significantly higher than in females. In males, the GSI was significantly increased at 20% effluent, but decreased when the fish were fed nano-ZnO- or ZnCl2-spiked feedfood, which suggests than exposure to municipal effluent increased the GSI, while dietary Zn decreased the GSI. In females, the GSI increased with municipal effluent concentration, while exposure to both forms of Zn in the diet had little effects on the GSI, although ZnCl2 increased the GSI compared to female controls and females exposed to nano-ZnO. A significant interaction between the two factors was also observed in the presence of the municipal effluent and the two forms of dietary Zn, with the GSI of females tending to be higher than that of males. Hence, males and females seem to respond differently to exposure to municipal effluent and forms of Zn. The GSI in males was seemingly more responsive to the decreasing effects of Zn than to stimulation by the municipal effluent, while in females, the effects of the municipal effluent were more apparent. The brain somatic index (BSI) was significantly affected by sex, exposure treatments with a significant sex * effluent/Zn treatments interaction (factorial two-way ANOVA: sex>sex* effluent/Zn treatments interaction> effluent/Zn treatments). The BSI in the controls was significantly higher in males than in females. Exposure to the municipal effluent decreased the BSI in males only, while nano-ZnO alone had effects. Exposure to combined dietary nano-ZnO and ZnCl2 with the municipal effluent increased the BSI but with less intensity than the municipal effluent alone. Correlation analysis (Table 2) revealed that the condition factor (fish weight/fork length) was not correlated with GSI but was positively correlated with BSI (r=0.67; p<0.001).
Table 1. General health status of Fathead Minnows exposed to municipal effluent, ZnO and dissolved Zn
|
Sex |
Fork length (mm) |
Fish weight
(g) |
Condition
factor
(g/mm) |
GSI |
Brain SI |
Controls |
M
F |
68.3 ± 1.7
46.25 ± 2.1c |
5.59 ± 0.68
1.25 ± 0.13c |
0.082 ± 0.009
0.027 ± 0.002c |
0.09 ± 0.01
0.022 ± 0.007c |
0.027 ± 0.006
0.01 ± 0.001c |
5% effluent |
M
F |
77 ± 1
44 ± 6 c |
8.39 ± 1.1
1.07 ± 0.41c |
0.11 ± 0.02
0.02 ± 0.006c |
0.014 ± 0.007a
0.049 ± 0.005c |
0.007 ± 0.001a
0.008 ± 0.001 |
10% effluent |
M
F |
73 ± 22
53 ± 15c |
7.2 ± 0.41
3.09 ± 2.3c |
0.09 ± 0.026
0.05 ± 0.029c |
0.007 ± 0.001a
0.048 ± 0.04 |
0.009 ± 5é-4 a
0.008 ± 0.003 |
20% effluent |
M
F |
75 ± 3
45 ± 3c |
7.35 ± 0.27
1.48 ± 0.24c |
0.098 ± 0.007
0.03 ± 0.003c |
0.011 ± 0.001a
0.013 ± 0.001 |
0.008 ± 0.003 a
0.02 ± 0.01 |
ZnO
(100 ug/g) |
M
F |
58 ± 2
50 ± 1 |
3.41 ± 0.05
1.54 ± 0.05 |
0.06 ± 0.003
0.03 ± 0.001 |
0.045 ± 0.005a
0.045 ± 0.005 |
0.01 ± 0.001
0.02 ± 0.01 |
ZnCl2
(100 ug/g) |
M
F |
66.5 ± 1.5
49.9 ± 0.5 |
5.16 ± 0.24
1.5 ± 0.05c |
0.078 ± 0.005
0.03 ± 0.001c |
0.07 ± 0.005
0.09 ± 0.005b |
0.02 ± 0.01
0.04 ± 0.01 |
5% effluent-ZnO |
M
F |
69 ± 10
47.5 ± 1.5c |
5.44 ± 2.2
1.43 ± 0.15c |
0.077 ± 0.02
0.03 ± 0.002 c |
0.065 ± 0.005
0.14 ± 0.001b,c |
0.015 ± 0.005
0.045 ± 0.01c |
5% effluent-ZnCl2 |
M
F |
69.5 ± 5.5
49.5 ± 4.5c |
6.13 ± 1.6
1.45 ± 0.32c |
0.087 ± 0.016
0.03 ± 0.004c |
0.08 ± 0.02
0.11 ± 0.001b |
0.045 ± 0.005
0.015 ± 0.005c |
10% effluent-ZnO |
M
F |
80 ± 1a
46 ± 4 c |
7.4 ± 0.93
1.28 ± 0.2 c |
0.092 ± 0.01
0.028 ± 0.002c |
0.045 ± 0.01a
0.07 ± 0.03 b |
0.05 ± 0.01a
0.015 ± 0.001c |
10% effluent- ZnCl2 |
M
F |
68.5 ± 6.5
50 ± 1 |
5.0 ± 0.8
1.45 ± 0.14c |
0.07 ± 0.005
0.03 ± 0.002c |
0.086 ± 0.02
0.085 ± 0.02b |
0.035 ± 0.01
0.0150.005 |
20% effluent-ZnO |
M
F |
76.5 ± 7.5a
48.5 ± 1.5c |
6.54 ± 0.85
1.43 ± 0.42c |
0.085 ± 0.003
0.03 ± 0.008c |
0.11 ± 0.02
0.22 ± 0.02b,c |
0.04 ± ---
0.01 ± 0.002c |
20 % effluent- ZnCl2 |
M
F |
67.5 ± 3.5
50.5 ± 4.5c |
5.09 ± 0.72
1.87 ± 0.34 |
0.075 ± 0.007
0.037 ± 0.003c |
0.08 ± 0.03
0.28 ± 0.003b,c |
0.04 ± ---
0.02 ± 0.001 |
a. Significantly different in males (treatment groups).
b. Significantly different in females (treatment groups).
c. Significantly difference between males and females (within a same treatment).
Table 2. Correlation analysis of the biomarker data.
| |
Fork length |
weight |
FC |
GSI |
Brain Index |
DNA brain |
LPO brain |
MT Brain |
DOP |
AChE |
MAO |
MET |
Fe |
Co |
Ni |
Cu |
Zn |
Ag |
Cd |
Fork length |
1 |
0.69
p<0.001 |
0.61
p<0.001 |
-0.05
p>0.1 |
0.79
p<0.001 |
0.29
p<0.01 |
0.68
p<0.001 |
-0.36
p<0.001 |
0.06
p>0.1 |
0.08
p>0.1 |
0.17
p=0.09 |
0.28
p<0.01 |
-0.10
p>0.1 |
-0.08
p>0.1 |
-0.25
p<0.05 |
-0.32
p=0.001 |
-0.63
p<0.001 |
-0.09
p>0.1 |
-0.07
p>0.1 |
weight |
|
1 |
0.98
p<0.001 |
-0.06
p>0.1 |
0.78
p>0.001 |
0.17
p>0.1 |
0.37
p<0.001 |
-0.34
p=0.001 |
0.1
p>0.1 |
-0.08
p>0.1 |
0.05
p>0.1 |
0.12
p>0.1 |
-0.07
p>0.1 |
-0.10
p>0.1 |
-0.24
p<0.01 |
-0.23
p<0.05 |
-0.39
p<0.001 |
-0.12
p>0.1 |
-0.05
p>0.1 |
FC |
|
|
1 |
-0.09
p>0.1 |
0.67
p<0.001 |
0.18
p=0.08 |
0.29
p<0.01 |
-0.33
p=0.001 |
0.07
p>0.1 |
-0.11
p>0.1 |
-0.05
p>0.1 |
0.10
p>0.1 |
-0.05
p>0.1 |
-0.1
p>0.1 |
-0.21
p<0.05 |
-0.20
p=0.05 |
-0.37
p<0.001 |
-0.12
p>0.1 |
-0.02
p>0.1 |
GSI |
|
|
|
1 |
-0.07
p>0.1 |
0.11
p>0.1 |
-0.08
p>0.1 |
-0.19
p=0.06 |
0.35
p<0.001 |
-0.04
p>0.1 |
0.04
p>0.1 |
0.09
p>0.1 |
0.49
p<0.001 |
0.61
p<0.001 |
0.47
p<0.01 |
0.55
p<0.001 |
0.15
p>0.1 |
0.60
p<0.001 |
-0.30
p<0.01 |
Brain Index |
|
|
|
|
1 |
0.17
p=0.09 |
0.55
p<0.001 |
-0.36
p<0.001 |
0.04
p>0.1 |
0.03
p>0.1 |
0.18
p=0.07 |
0.15
p>0.1 |
-0.20
p<0.05 |
-0.18
p=0.07 |
-0.20
p=0.06 |
-0.30
p<0.01 |
-0.40
p<0.001 |
-0.16
p>0.1 |
-0.15
p>0.1 |
DNA brain |
|
|
|
|
|
1 |
0.40
p<0.001 |
0.09
p>0.1 |
-0.10
p>0.1 |
0.25
p<0.05 |
0.10
p>0.1 |
0.36
p<0.001 |
-0.11
p>0.1 |
-0.11
p>0.1 |
-0.15
p>0.1 |
-0.30
p<0.01 |
-0.29
p<0.01 |
-0.07
p>0.1 |
-0.16
p>0.1 |
LPO brain |
|
|
|
|
|
|
1 |
-0.30
p<0.01 |
-0.05
p>0.1 |
0.37
p<0.001 |
0.36
p<0.001 |
0.33
p=0.001 |
-0.17
p=0.1 |
-0.17
p=0.08 |
-0.31
p<0.01 |
-0.35
p<0.001 |
-0.44
p<0.001 |
-0.16
p>0.1 |
-0.25
p=0.01 |
MT Brain |
|
|
|
|
|
|
|
1 |
-0.04
p>0.1 |
0.20
p=0.05 |
0.29
p<0.01 |
-0.31
p<0.01 |
-0.28
p<0.01 |
-0.28
p<0.01 |
-0.17
p=0.1 |
-0.21
p<0.05 |
0.03
p>0.1 |
-0.25
p<0.05 |
-0.21
p<0.05 |
DOP |
|
|
|
|
|
|
|
|
1 |
0.06
p>0.1 |
0.31
p<0.001 |
-0.32
p<0.001 |
0.37
p<0.001 |
0.45
p<0.001 |
0.40
p<0.001 |
0.33
p=0.001 |
-0.1
p>0.1 |
0.46
p<0.001 |
0.25
p=0.01 |
AChE |
|
|
|
|
|
|
|
|
|
1 |
0.62
p<0.001 |
0.17
p=0.1 |
-0.15
p>0.1 |
-0.11
p>0.1 |
-0.16
p>0.1 |
0.01
p>0.1 |
0.06
p>0.1 |
-0.02
p>0.1 |
0.03
p>0.1 |
MAO |
|
|
|
|
|
|
|
|
|
|
1 |
0.003
p>0.1 |
-0.24
p<0.05 |
-0.17
p=0.1 |
-0.19
p=0.08 |
-0.23
p<0.05 |
-0.04
p>0.1 |
-0.16
p>0.1 |
-0.32
p=0.001 |
MET Brain |
|
|
|
|
|
|
|
|
|
|
|
1 |
-0.05
p>0.1 |
-0.07
p>0.1 |
-0.01
p>0.1 |
-0.21
p<0.05 |
-0.09
p>0.1 |
-0.04
p>0.1 |
-0.02
p>0.1 |
Fe |
|
|
|
|
|
|
|
|
|
|
|
|
1 |
0.96
p<0.001 |
0.75
p<0.001 |
0.66
p<0.001 |
0.13
p>0.1 |
0.93
p<0.001 |
0.73
p<0.001 |
Co |
|
|
|
|
|
|
|
|
|
|
|
|
|
1 |
0.76
p<0.001 |
0.73
p<0.001 |
0.11
p>0.1 |
0.97
p<0.001 |
0.71
p<0.001 |
Ni |
|
|
|
|
|
|
|
|
|
|
|
|
|
|
1 |
0.64
p<0.001 |
0.28
p<0.01 |
0.74
p<0.001 |
0.66
p<0.001 |
Cu |
|
|
|
|
|
|
|
|
|
|
|
|
|
|
|
1 |
0.2
p=0.05 |
0.72
p<0.001 |
0.63
p<0.001 |
Zn |
|
|
|
|
|
|
|
|
|
|
|
|
|
|
|
|
1 |
0.1
p>0.1 |
0.17
p=0.08 |
Ag |
|
|
|
|
|
|
|
|
|
|
|
|
|
|
|
|
|
1 |
0.73
p<0.001 |
Metal levels in fish carcasses were also determined (Table 3). Tissue Zn levels were significantly affected by sex (factorial ANOVA: sex at p<0.001) only. The difference of Zn in fish tissue tended to be higher in females than in males and this difference increased when dietary ZnCl2 or nano-ZnO was present with the municipal effluent. However, neither the municipal effluent nor the forms of Zn in the diet alone influenced the difference in Zn levels in males and females. Total Zn levels in fish carcasses were significantly correlated with nickel (Ni; r=0.28; p<0.01) and copper (r=0.2; p=0.05). The levels of Ni were similar for both sexes in the controls. However, Ni was significantly increased in females by 20% municipal effluent, ZnCl2, and 10-20% municipal effluent in fish fed a ZnCl2-supplemented feed. In males, Ni was significantly induced at 10% municipal effluent in fish fed ZnCl2 supplements only. For copper (Cu) in carcasses, both the municipal effluent concentrations/dietary forms of Zn and sex were significant (sex>exposure treatments>sex* effluent/Zn treatments interaction). Cu levels were similar in males and females in the control fish. In females exposed to the municipal effluent, tissue Cu levels were significantly higher at a 20% concentration, with nano-Zn-spiked feed, 10% and 20% concentrations ZnCl2-spiked diet. In males, Cu levels were increased only at 10% effluent concentration with fish fed a ZnCl2-supplemented feed.
Table 3. Metal levels in fish carcass
Exposure
conditions |
Fe
µg/g dry weight |
Co
ng/g dry weight |
Ni
ng/g dry weight |
Cu
µg/g dry weight |
Zn
µg/g dry weight |
Ag
ng/g dry weight |
Cd
ng/g dry weight |
Controls |
M: 12.7 ± 4
F: 10.7 ± 1 |
M: 30 ± 10
F: 5 ± 0.5 |
M: 19 ± 4
F: 27 ± 6 |
M: 1.2 ± 0.08
F: 1.2 ± 0.1 |
M: 38 ± 6
F: 53 ± 3 |
M: 0.4 ± 0.01
F: 0.2 ± 0.001 |
M: 10 ± 3
F: 6 ± 0.5c |
Effluent 5% |
M: nd
F: 6.1 ± 1 |
M: 2 ± 0.5
F:7 ± 1 |
M: nd
F: 17 ± 0.1 |
M: nd
F: 1.8 ± 0.7 |
M: 25 ± 1
F:46 ± 10 |
M: nd
F: 1 ± 0.03 |
M: nd
F: 6 ± 2c |
Effluent 10% |
M: 8.2 ± 2
F: 18 ± 3b,c |
M:9 ± 2
F: 81 ± 30b |
M: 11 ± 0.5
F: 30 ± 0.8 |
M: 0.98 ± 0.3
F: 2.1 ± 0.1c |
M: 42 ± 7
F:59 ± 20 |
M: 1.2 ± 0.01
F: 3 ± 1b |
M: 4.5 ± 0.1a
F: 8 ± 0.2 |
Effluent 20% |
M: 12 ± 4
F: 20 ± 2b,c |
M: 73 ± 20a
F:136 ± 24b |
M:20 ± 2
F: 75 ± 5b,c |
M: 1.85 ± 0.4
F: 4.4 ± 0.8b,c |
M:28 ± 1
F:59 ± 15c |
M: 3.4 ± 0.1a
F:7 ± 1b,c |
M: 5.5 ± 2a
F: 8 ± 0.1 |
ZnO |
M: 8.4 ± 1
F: 8.5 ± 0.5 |
M: 6 ± 1
F:5 ± 0.5 |
M: 13 ± 2
F: 32 ± 10 |
M: 1.2 ± 0.01
F: 1.25 ± 0.15 |
M:34 ± 0.3
F:52 ± 8 |
M: 0.8 ± 0.2
F: 0.4 ± 0.2 |
M:5.5 ± 0.1a
F: 7 ± 1 |
ZnCl2 |
M: 9 ± 0.1
F: 9.3 ± 1 |
M: 4 ± 0.4
F:3.4 ± 0.5 |
M: 12 ± 2
F:60 ± 20b,c |
M:1.3 ± 0.25
F:1.2 ± 0.15 |
M: 24 ± 2
F:46 ± 1 |
M: 0.6 ± 0.1
F: 0.3 ± 0.1 |
M: 8.4 ± 1
F: 7 ± 0.5 |
Effluent 5%-ZnO |
M: 10 ± 0.05
F: 10 ± 0.05 |
M: 7.6 ± 0.2
F: 7.6 ± 0.2 |
M: 18 ± 3
F: 18 ± 3 |
M: 1.3 ± 0.02
F: 1.3 ± 0.2 |
M:38 ± 3
F:38 ± 5 |
M: 0.9 ± 0.2
F: 0.9 ± 0.1 |
M:6 ± 0.2
F:6 ± 0.2 |
Effluent 10%-ZnO |
M: 10.6 ± 0.5
F: 8.6 ± 0.5 |
M: 6.5 ± 0.1a
F: 6.6 ± 1 |
M: 11 ± 0.5
F: 11 ± 3 |
M: 1.5 ± 0.1
F:1.9 ± 0.8 |
M: 40 ± 7
F: 65 ± 10c |
M: 1 ± 0.05
F:0.7 ± 0.2 |
M: 7.7 ± 0.4
F: 7.5 ± 1 |
Effluent 20%-ZnO |
M: 10.6 ± 0.1
F: 10.5 ± 0.1 |
M: 4 ± 0.3a
F: 17 ± 2b |
M: 8 ± 0.5
F: 25 ± 4c |
M: 0.7 ± 0.03
F: 2.9 ± 0.6b,c |
M: 38 ± 6
F:55 ± 10 |
M: 0.1 ± 0.03
F:0.8 ± 0.05 |
M:4.8 ± 0.1a
F:8.4 ± 1 |
Effluent 5%-ZnCl2 |
M: 10.7 ± 2a
F: 11 ± 0.8 |
M: 9 ± 2a
F: 15 ± 2b |
M:26 ± 10a
F: 13 ± 0.5c |
M: 1.2 ± 0.1
F: 1.7 ± 0.2 |
M: 30 ± 4
F: 67 ± 10c |
M: 0.6 ± 0.1
F:0.6 ± 0.2 |
M: 5 ± 0.4a
F:5 ± 0.3 |
Effluent 10%-ZnCl2 |
M: 23 ± 0.4a
F: 61 ± 4b,c |
M: 157 ± 8
F: 442 ± 30 |
M: 68 ± 20a
F:122 ± 2b |
M: 2.4 ± 0.1a
F:4.9 ± 0.08b,c |
M: 29 ± 2
F: 68 ± 7c |
M: 7 ± 0.1a
F:24 ± 3b,c |
M: 13 ± 0.1
F:25 ± 0.5b,c |
Effluent 20%-ZnCl2 |
M: 14.5 ± 3a
F: 18 ± 1b |
M: 73 ± 25
F: 135 ± 20 |
M: 18 ± 3
F: 58 ± 1b |
M: 2 ± 0.1a
F:4.4 ± 0.5b.c |
M: 25 ± 3
F: 53 ± 9c |
M: 3.5 ± 1a
F: 7.3 ± 0.5bc |
M: 8 ± 1
F:10 ± 1 |
a. significantly different in males; b. significantly different in females; c. significantly different between males and females in the same treatment group. Nd: not determined
Brain dopamine levels were determined in fathead minnows exposed to municipal effluent and dietary forms of Zn (Figure 1A).FHM were exposed to the ME, nano-ZnO and ZnCl2 alone and in combination. The levels of brain dopamine (A), mono-amine oxidase (MOA) activity (B) and acetylcholinesterase (AChE) activity (C) are reported. The letter a indicates significant from controls and b significant between males-females at a given treatment condition.
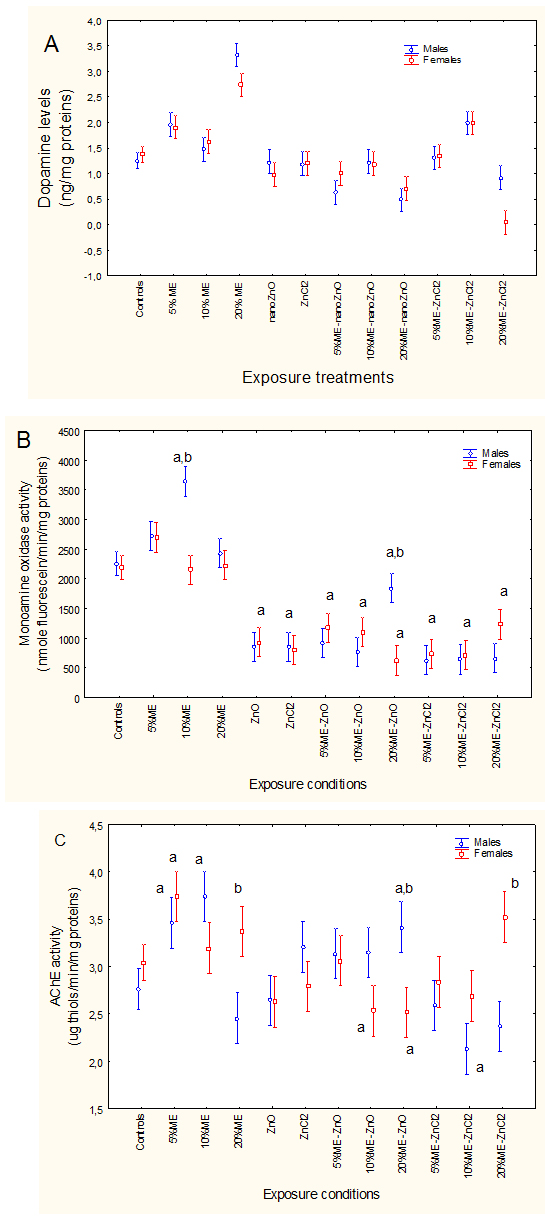
Figure 1.Neurological effects of fathead minnows exposed to ME, nano-ZnO and ZnCl2.
FHM were exposed to the ME, nano-ZnO and ZnCl2 alone and in combination. The levels of brain dopamine (A), mono-amine oxidase (MOA) activity (B) and acetylcholinesterase (AChE) activity (C) are reported. The letter a indicates significant from controls and b significant between males-females at a given treatment condition.
Factorial analysis of variance revealed that only the exposure concentrations were significant. Brain dopamine levels were increased after exposure to 20% municipal effluent, while exposure to either nano-ZnO or ZnCl2 alone had no effects. Combined exposure to dietary forms of Zn and the highest concentration of municipal effluent (20%) decreased dopamine levels, while exposure to 10% effluent increased dopamine levels in fish fed a ZnCl2-supplemented feed. Correlation analysis revealed that dopamine was significantly correlated with Co (r=0.29; p<0.05), Ni (r=0.32; p<0.05) and Ag (r=0.31; p<0.05). MAO activity was also determined in brain mitochondria (Figure 1B). Factorial analysis of variance revealed a significant effluent/Zn treatments *sex interaction. In control fish, MOA activity was similar between males and females. Exposure to the municipal effluent led to significant increases in MAO activity, while exposure to either forms of Zn significantly reduced MAO activity (at 33% of the controls). Co-exposure to the municipal effluent and either dietary nano-ZnO or ZnCl2did not restore MOA activity. Males were more sensitive to exposure to municipal effluent and were less sensitive to dietary nano-ZnO than to ZnCl2 in the presence of municipal effluent. Correlation analysis revealed that MAO activity was significantly correlated with dopamine (r=0.30; p<0.05), Fe (r=-0.24; p<0.05), Cu (r=-0.23; p<0.05) and Cd (r=-0.32; p=0.001). AChE activity was also determined in brain tissue as a general marker of neural activity (Figure 1C). As with MAO activity, factorial analysis of variance revealed that AChE activity was significantly influenced by a gender–exposure concentration interaction. AChE activity was significantly induced at low concentrations of municipal effluent (5 and 10%). Exposure to either dietary nano-ZnO or ZnCl2 did not influence AChE activity. The combination of municipal effluent and dietary nano-ZnO produced no change in AChE activity. However, the difference in AChE activity between males and females was significant in fish exposed to 20% municipal effluent and fed to forms of Zn. Correlation analysis revealed that AChE activity was significantly correlated with MOA activity (r=0.62; p<0.001).
Oxidative stress and metallothionein (MT) levels were also determined in brain tissue (Figures 2A and 2B).FHM were exposed to the ME, nano-ZnO and ZnCl2 alone and in combination. The levels of brain MT (A) and LPO levels (B) were reported. The letter a indicates significant from controls and b significant between males-females at a given treatment condition.Factorial analysis of variance revealed that MT levels in brain were significantly affected by sex* effluent/Zn treatments interaction. The levels of MT were higher in females compared to males in unexposed fish. This trend was lost upon exposure to combination of municipal and either forms of dietary Zn. Brain MT levels were increased by exposure to the municipal effluent at the lowest concentration (5%). Neither dietary nano-ZnO nor ZnCl2 significantly induced MT in male and female fish. Exposure to the combination of municipal and either forms of dietary Zn significantly decreased brain MT levels. Correlation analysis revealed that brain MT levels were significantly correlated with condition factor (r=-0.33; p=0.001), BSI (r=-0.36;p<0.001), AChE (r=0.2; p<0.05), MAO (r=0.29; p<0.01), Fe (r=-0.28; p<0.01), Co (r=-0.27; p<0.01), Cu (r=-0.21; p<0.05), Ag (r=-0.25; p<0.05) and Cd (r=-0.21;p<0.05). Lipid-mediated oxidative damage was also determined using the thiobarbituric acid reactants assay (Figure 2B). Factorial analysis of variance revealed a significant effluent/Zn treatments *sex interaction. Brain LPO levels were significantly higher in males compared to females in control fish. Male LPO levels were increased at 10% municipal effluent alone, 10 and 20% ME with dietary nano-ZnO treatment groups. There were no difference in LPO levels between males and females in control fish but levels in males were significantly lower at 20% municipal effluent and 10, 20% municipal effluent in fish fed a nano-ZnO-supplemented feed. Correlation analysis revealed that brain LPO levels were significantly correlated with condition factor (r=0.29; p<0.01), BSI (r=0.55;p<0.001), MT (r=-0.30;p<0.01), AChE (r=0.37; p<0.001), MAO (r=0.36; p<0.001), Ni (r=-0.31; p<0.01), Cu (r=-0.35; p<0.001), Zn (r=-0.44; p<0.001) and Cd (r=0.25;p<0.05).
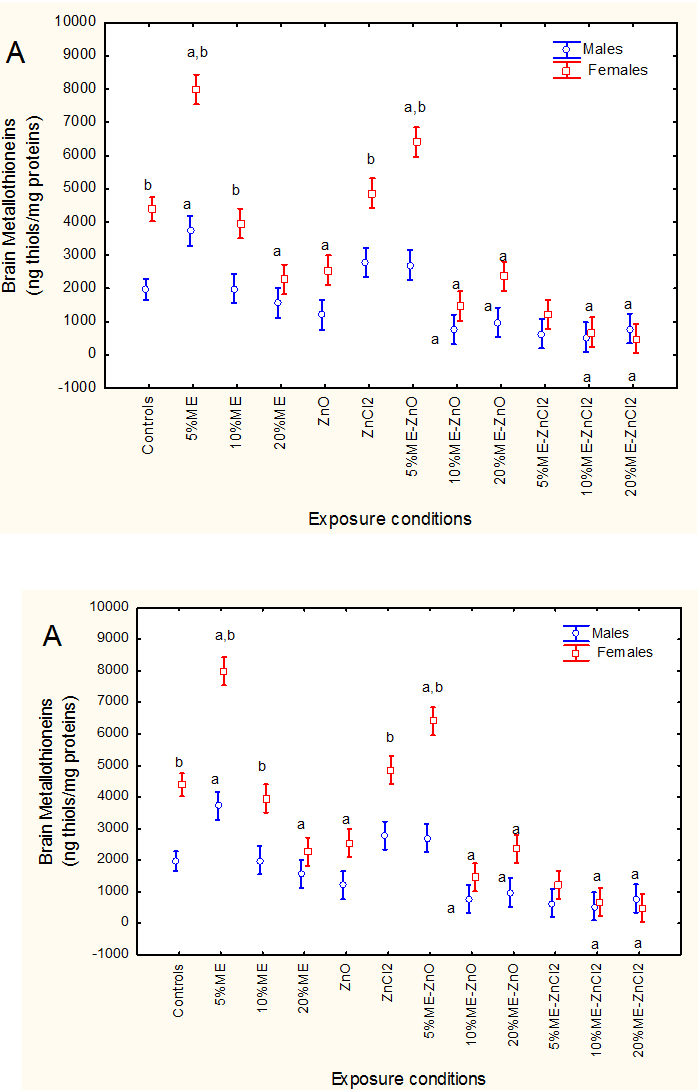
Figure 2.Oxidative stress and metallothioneins in fish brain.
FHM were exposed to the ME, nano-ZnO and ZnCl2 alone and in combination. The levels of brain MT (A) and LPO levels (B) were reported. The letter a indicates significant from controls and b significant between males-females at a given treatment condition.
Cellular metabolic energy expenditure 2021 Copyright OAT. All rights reservochondrial electron transport (MET) activity (Figure 3).FHM were exposed to municipal effluents, nano-ZnO and ZnCl2 alone and in combination, and cellular energy expenditure was determined following MET activity as described in Methods. The letter a indicates significant from controls and b significant between males-females at a given treatment condition.Factorial analysis of variance indicated that all factors were significant with effluent/Zn treatments *sex interaction. MET activity was similar in females and males. It was decreased in females exposed to municipal effluent alone and increased in males exposed to 10% municipal effluent. Dietary nano-ZnO slightly increased MET activity in females. The combination of 20% municipal effluent with fish fed nano-ZnO-spiked feed increased MET activity in males while the combination of the 20% municipal effluent with fish fed a ZnCl2-spiked feed increased MET activity in females. Correlation analysis revealed that MET activity was significantly correlated with brain LPO (r=0.33; p<0.001), MT (r=-0.31; p<0.01), DOP (r=-0.46; p<0.01), and Cu (r=-021; p<0.05). The extent of DNA damage was determined using the alkaline DNA precipitation assay (Figure 4).FHM were exposed to the ME, nano-ZnO and ZnCl2 alone and in combination and DAN strand breaks in brain homogenates were determined as described in Methods. The letter a indicates significant from controls and b significant between males-females at a given treatment condition.
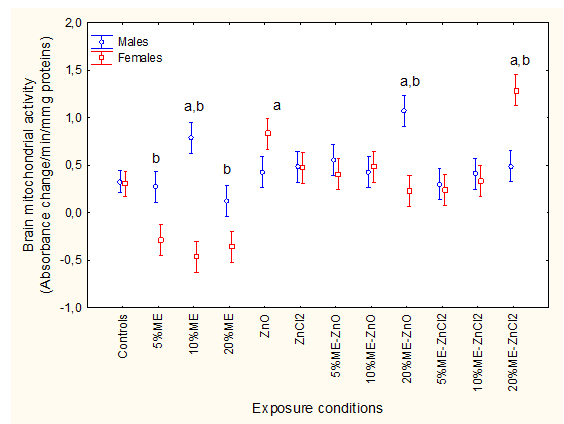
Figure 3 Brain energy expenditure in fish exposed to ME, nano-ZnO and ZnCl2.
FHM were exposed to municipal effluents, nano-ZnO and ZnCl2 alone and in combination, and cellular energy expenditure was determined following MET activity as described in Methods. The letter a indicates significant from controls and b significant between males-females at a given treatment condition.
Factorial analysis of variance revealed an effluent/Zn treatments*sex interaction. Baseline DNA strand breaks were similar between males and females and DNA strand breaks decreased at high municipal effluent concentration. Neither the dietary forms of Zn produced changes in DNA strand breaks levels. The combination of municipal effluent and nano-ZnO or ZnCl2 produced no significant changes. Correlation analysis revealed that brain DNA strand breaks were significantly correlated with LPO (r=0.4; p<0.001), AChE (r=0.25; p=0.01), MET (r=0.36; p<0.001), Cu (r=-0.30; p<0.01) and Zn (r=-0.29; p<0.01).
In the attempt to obtain a global view on the impacts of municipal effluent, nano-ZnO or ZnCl2 supplemented feed alone and in combination, a discriminant function and factorial analysis was performed (Figure 5).The data were analyzed to seek out general classes of responses and identified the most important biomarkers. Mean site classification was 70% and 4 clusters were identified. The biomarkers identified at the x and y axes are those with the high factorial weights. The effects of dietary nano-ZnO and the municipal effluent could be identified by the biomarkers on the x axis.Because was often a significant factor in the observed responses, it was included in the analysis as well. The mean classification efficiency was 70% which suggests good separation of the various treatments between the municipal effluent, nano-ZnO and ZnCl2 alone and in combination. The analysis generated four distinct clusters of treatments. The first cluster consisted of control males and females. The second cluster consisted of male and female fish exposed to the municipal effluent. The third cluster consisted of male and female fish fed a nano-ZnO diet. The 4th cluster consisted of male and female fish fed a ZnCl2diet alone and municipal effluent exposed fish fed either a nano-ZnO or ZnCl2 diet. This cluster suggests that when municipal effluent is present, the effects on fish fed a nano-ZnO-supplemented feed were similar to those in fish fed a ZnCl2 diet.
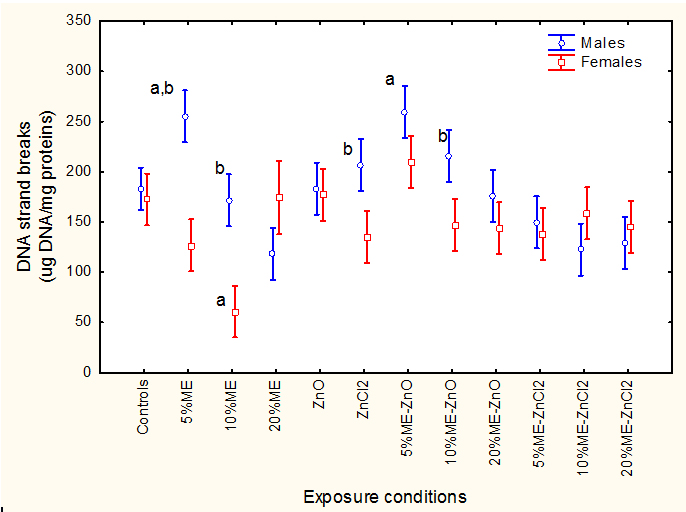
Figure 4. Brain DNA damage in fish exposed to ME, nano-ZnO and ZnCl2.
FHM were exposed to the ME, nano-ZnO and ZnCl2 alone and in combination and DAN strand breaks in brain homogenates were determined as described in Methods. The letter a indicates significant from controls and b significant between males-females at a given treatment condition.
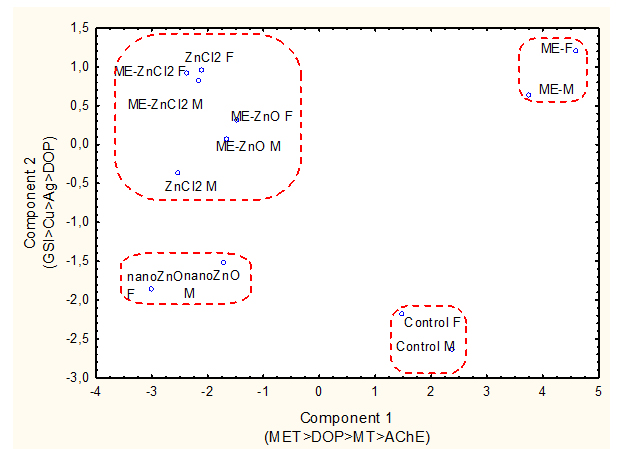
Figure 5.Discriminate function and factorial analyses of biomarker data.
The data were analyzed to seek out general classes of responses and identified the most important biomarkers. Mean site classification was 70% and 4 clusters were identified. The biomarkers identified at the x and y axes are those with the high factorial weights. The effects of dietary nano-ZnO and the municipal effluent could be identified by the biomarkers on the x axis.
Discussion
In this study, fathead minnows were fed a daily intake of 3 µg dietary Zn and continuously exposed to increasing concentrations of municipal effluent for 21 days. Total Zn levels in fish carcasses did not significantly change across all exposure treatments. This suggests that Zn was not accumulated in fish tissue with the feeding regime used after 21 days at 25°C, under which the fish were exposed to two modes of entry: dietary uptake and waterborne exposure. This is consistent with a recent study that found that dietary Cu and Zn did not accumulate in the heart, brain or muscle tissue of goldfish [31]. Dietary ZnOnano-ZnO were shown to accumulate primarily in the intestines, followed by the gills and liver. Neither brain MT nor LPO levels were significantly affected, which suggests that neither form of dietary Zn overwhelmed normal Zn homeostasis. However, dietary nano-ZnO and ZnCl2significantly decreased brain MAO activity, which suggests decreased turnover of monoamines in the central nervous system. There is little in the scientific literature on the neurotoxicityof Zn nanoparticles in fish. In another study, waterborne exposure of goldfish to suspensions of nano-ZnO resulted in accumulation in the gills and gut, with only a small fraction reaching more internal tissues, such as the liver and muscle tissue [17]. Moreover, nano-ZnO partitioned in metal-rich granules in the liver with no significant mobilization of Zn to the MT compartment (cytosol), suggesting that nano-ZnO could be found in cells and partition in insoluble granules. The lack of induction of MT suggests that nano-ZnO is rather stable in the liver and does not liberate Zn2+. The lack of MT response and superoxide dismutase activity was also found in medaka fish exposed to nano-ZnO, but heat shock protein 70 mRNA levels were up-regulated, indicating a different mode of action for nano-ZnO effects independent of Zn cation release [32]. However, nano-ZnO seemed to increase oxidative stress in the carp Cyprinuscarpioin the brain, liver and gills, but at much higher concentrations than that used in the present study (500 to 50 000 µg/L) [33]. Waterborne exposure to nano-ZnO at these concentrations decreased thiol levels and increased LPO in the organs described above. Exposure to the effluent increased brain dopamine levels, MAO activity and AChE activity, whereas dietary uptake of nano-ZnO and ZnCl2 eliminated these effects. MAO activity was readily decreased by either form of Zn compared to the controls, whereas the presence of municipal effluent had no effect. Brain AChE and liver superoxide dismutase were significantly decreased by nano-ZnO in the goldfish Carassiusauratus[34]. These effects suggests that lower brain and liver metabolic activity occurred, but only at high concentrations of nano-ZnO (160 and 320 mg/L) after 4 days.
Exposure to municipal effluents had more significant effects in fish than the relatively low concentrations of dietary nano-ZnO or ZnCl2. Indeed, exposure to 12 municipal effluents led to increased expression of MT and oxidative stress markers at the mRNA levels [35]. Increased MT levels were reported in brown trout exposed to sewage treatment plant effluent, suggesting the presence of labile divalent metals [36]. Municipal effluent on its own, produced significant changes in tissue Fe, Co, Cu, Ag and Cd levels and had no bearing effect on Zn tissue levels. Caged fish place downstream of a municipal effluent outfall led to increased oxidative stress, such as LPO and protein carbonyls [37]. Brain LPO levels were elevated in males exposed to municipal effluent in the presence of dietary nano-ZnO, but not in the presence of ZnCl2. The latter form of Zn is considered an antioxidant essential metal [38]while nano-ZnO can lead to oxidative stress in fish brain [33]. Increased oxidative stress was correlated with DNA strand breaks, suggesting that oxidative damage contributed to DNA strand breaks. Indeed, an analysis of covariance of brain DNA strand breaks with brain LPO as the covariate revealed that LPO contributed the most to DNA strand breaks and was no longer induced in fish exposed to both the municipal effluent and nano-ZnO. This supports the hypothesis that nano-ZnOinduced genotoxicity in fish exposed to municipal effluents is mediated by oxidative stress. The genotoxicity of municipal effluents could also result from altered DNA metabolism and stability [8]. Decreased DNA strand breaks were related to inhibition of purine synthesis by inhibition of dehydrofolatereductase activity, a key enzyme in purine synthesis in mussels exposed to the same type of municipal effluent [13]. Exposure to municipal effluent could also lead to more severe cytogenetic damage such as in micronuclei, as shown in RTG-2 cells exposed to such effluents [39]. The etiology of micronuclei formation is difficult to determine with complex mixtures, but the reported levels of bisphenolA, octylphenol and phthalates alone were not able to explain the observed genotoxicity of the effluents. The same was observed in rainbow trout exposed to a municipal effluent whose levels in oil products (C14-28), benzo(a)pyrene, heavy metals and suspended solids did not exceed the maximal permissible concentration for wastewaters, with the fish showing elevated incidence of micronuclei in blood and decreased macrophage counts [40]. Pharmaceutical products also contribute to the genotoxicity of the effluents [41]. Exposure of Daniorerio to realistic concentrations (i.e. those found in Italian municipal effluents) of sildenafil, atorvastatin and gemfibrozil for one week led to DNA damage. Genotoxicity was determined by the Comet assay and showed loss of DNA integrity in fish exposed to the above pharmaceuticals.
The increased levels of dopamine and AChE activity in fish exposed to municipal effluent is consistent with catecholamine-induced neuroactivity, associated with conditioned place preference behaviour[22]. The addition of nano-ZnO to the diet decreased AChE in females exposed to the municipal, suggesting decreased condition place preference behaviour. It would have been of interest to monitor this behaviour in females exposed to 10 and 20% of municipal effluent and dietary nano-ZnO in relation to the time spent near the spawning tiles. The estrogenic effects of municipal effluents could also have significant effects on fish brain and behaviour. Indeed, the brain is also a source of estradiol, with the young brain exhibiting increased E2 synthesis, cell proliferation and neurogenesis [42]. Exposure of fish to E2 increased monoamine oxidase activity and decreased serotonin levels in developing tilapia brains, which suggests a negative interaction between E2 and serotonin levels [43]. Exposure of E2 and phytoestrogens at environmentally realistic concentrations increased brain dopamine levels in Bettasplendens[44]. The increase in brain dopamine was located at the forebrain, but the application of therapeutic doses of phytoestrogens decreased dopamine levels. Exposure to E2 resulted in an increase in dopamine D2 receptor mRNA, which is involved in dopamine-induced inactivation of nerve cells and could represent a mechanism that protects dopaminergic neurons from toxic injury [45]. Increased dopaminergic activity was related to oocyte recruitment, which is negatively regulated by the expression of D2 dopamine receptors. The increase in dopamine D2 receptors was followed by decreased follicle-stimulating hormone (growth of ovarian follicles) and luteinizing hormone (involved in steroidogenesis) for steroidogenesis and oocyte growth. The increase in D2 dopamine receptors is consistent with decreased neuron energy expenditure (MET) in females, and the reported decreased egg production by municipal effluents reported elsewhere [46]. Interestingly, the inclusion of nano-ZnO and ZnCl2in the diet eliminated the decrease in MET activity in fish exposed to municipal effluent. In conclusion, exposure of adult fathead minnow to a physicochemically treated municipal leads to changes in brain dopamine levels and MAO, MET and AChE activity[47]. The addition of nano-ZnO and ZnCl2reversed the fish response to municipal effluents for dopamine, MAO and AchE in the brain, indicating a negative interaction between exposure to municipal effluent and dietary nano-ZnO and ZnCl2. On the whole, the fish responses to combined exposure of municipal effluent and either form of Zn were more closely correlated with dietary ZnCl2-induced effects, suggesting that dietary nano-ZnO effects are primarily explained by ZnCl2 in either the absence or presence of municipal effluents.
Acknowledgements
The authors thank Sophie Trépanier for running the fathead minnow exposure experiments. The work was funded by the Chemical Management Plan and the St. Lawrence Action Plan of Environment Canada.
References:
- Hadioui M, Leclerc S, Wilkinson KJ (2013) Multimethod quantification of Ag+ release from nanosilver. Talanta 105: 15-19. [Crossref]
- Kundu P, Anumol EA, Ravishankar N (2013) Pristine nanomaterials: synthesis, stability and applications. Nanoscale 5: 5215-5224. [Crossref]
- Shi LE, Li ZH, Zheng W, Zhao YF, Jin YF, et al. (2014) Synthesis, antibacterial activity, antibacterial mechanism and food applications of ZnO nanoparticles: a review. Food Addit Contam Part A Chem Anal Control Expo Risk Assess 31: 173-186. [Crossref]
- Li M, Pokhrel S, Jin X, Mädler L, Damoiseaux R, et al. (2011) Stability, bioavailability, and bacterial toxicity of ZnO and iron-doped ZnO nanoparticles in aquatic media. Environ Sci Technol 45: 755-761. [Crossref]
- Gagné F, Auclair J, Peyrot C, Wilkinson KJ (2015) The influence of zinc chloride and zinc oxide nanoparticles on air-time survival in freshwater mussels. Comp Biochem Physiol C Toxicol Pharmacol 172-173: 36-44. [Crossref]
- Keller AA, Wang H, Zhou D, Lenihan HS, Cherr G, et al. (2010) Stability and aggregation of metal oxide nanoparticles in natural aqueous matrices. Environ Sci Technol 44: 1962-1967. [Crossref]
- Holeton C, Chambers P A, Grace L. 2011. Wastewater release and its impacts on Canadian waters. Can.J.Fish.Aquat.Sci. 68, 1836-1859.
- Gagné F, André C, Cejka P, Hausler R, Fournier M (2011) Alterations in DNA metabolism in Elliptio complanata mussels after exposure to municipal effluents. Comp Biochem Physiol C Toxicol Pharmacol 154: 100-107. [Crossref]
- Arstikaitis J, Gagné F, Cyr DG (2014) Exposure of fathead minnows to municipal wastewater effluent affects intracellular signaling pathways in the liver. Comp Biochem Physiol C Toxicol Pharmacol 164: 1-10. [Crossref]
- Leet JK, Sassman S, Amberg JJ, Olmstead AW, Lee LS, et al. (2015) Environmental hormones and their impacts on sex differentiation in fathead minnows. Aquat Toxicol 158: 98-107. [Crossref]
- Gagné F, Blaise C, Hellou J (2004) Endocrine disruption and health effects of caged mussels, Elliptio complanata, placed downstream from a primary-treated municipal effluent plume for one year. Comp Biochem Physiol 138C: 33-44.
- Aravindaksham J, Paquet V, Gregory M, Dufresne, J, Fournier, et al. (2004) Consequences of Xenoestrogen Exposure on Male Reproductive Function in Spottail Shiners (Notropis hudsonius). Toxicological Sciences 78: 156-165.
- Lajeunesse A, Gagnon C, Gagné F, Louis S, Cejka P, et al. (2011) Distribution of antidepressants and their metabolites in brook trout exposed to municipal wastewaters before and after ozone treatment--evidence of biological effects. Chemosphere 83: 564-571. [Crossref]
- Tetreault GR, Bennett J, Cheng C, Servos, MR, McMaster ME (2012) Reproductive and histopathological effects in wild fish inhabiting an effluent-dominated stream, Wascana Creek, SK, Canada. Aquatic Toxicology 110-111: 149-161.
- Lacaze E, Devaux A, Bony S, Bruneau A, André C, et al. (2013) Genotoxic impact of a municipal effluent dispersion plume in the freshwater mussel Elliptio complanata: an in situ study. J Xenobiotics 3: 14-16.
- Dubey A, Goswami M, Yadav K, Chaudhary D (2015) Oxidative Stress and Nano-Toxicity Induced by TiO2 and ZnO on WAG Cell Line. PLoS One 10: e0127493. [Crossref]
- Fan W, Li Q, Yang X, Zhang L (2013) Zn subcellular distribution in liver of goldfish (carassius auratus) with exposure to zinc oxide nanoparticles and mechanism of hepatic detoxification. PLoS One 8: e78123. [Crossref]
- Shariati F, Shariati S (2011) Review on methods for determination of metallothioneins in aquatic organisms. Biol Trace Elem Res 141: 340-366. [Crossref]
- Menelaou E, Udvadia AJ, Tanguay RL, Svoboda KR (2014) Activation of α2A-containing nicotinic acetylcholine receptors mediates nicotine-induced motor output in embryonic zebrafish. Eur J Neurosci 40: 2225-2240. [Crossref]
- Kim YH, Lee Y, Kim D, Jung MW, Lee CJ (2010) Scopolamine-induced learning impairment reversed by physostigmine in zebrafish. Neurosci Res 67: 156-161. [Crossref]
- Leal E, Fernández-Durán B, Agulleiro MJ, Conde-Siera M, Míguez JM, et al. (2013) Effects of dopaminergic system activation on feeding behavior and growth performance of the sea bass (Dicentrarchus labrax): a self-feeding approach. Horm Behav 64: 113-121. [Crossref]
- Ninkovic J, Folchert A, Makhankov YV, Neuhauss SC, Sillaber I, et al. (2006) Genetic identification of AChE as a positive modulator of addiction to the psychostimulant D-amphetamine in zebrafish. J Neurobiol 66: 463-475. [Crossref]
- Bonacci S, Browne MA, Dissanayake A, Hagger JA, Corsi I, et al. (2004) Esterase activities in the bivalve mollusc Adamussium colbecki as a biomarker for pollution monitoring in the Antarctic marine environment. Mar Pollut Bull 49: 445-455.
- Gagné F (2014) Neuroendocrine disruption. In: Biochemical Ecotoxicology-Principles and Methods. First Edition, Chapter 9, Elsevier Inc USA: 145-170.
- Wills ED (1987) Evaluation of lipid peroxidation in lipids and biological membranes. In: Snell K, Mullock B. (Eds.), Biochemical Toxicology: A Practical Approach. IRL Press, Washington, USA:127.
- Olive PL (1988) DNA precipitation assay: a rapid and simple method for detecting DNA damage in mammalian cells. Environ Mol Mutagen 11: 487-495. [Crossref]
- Viarengo A, Ponzanon E, Dondero F, Fabbri R (1997) A simple spectrophotometric method for metallothionein evaluation in marine organisms: an application to Mediterranean and Antarctic molluscs. Mar Environ Res 44: 69–84.
- Haase H, Maret W (2004) A differential assay for the reduced and oxidized states of metallothionein and thionein. Anal Biochem 333: 19-26. [Crossref]
- Smolders R, Bervoets L, De Coen W, Blust R (2004) Cellular energy allocation in zebra mussels exposed along a pollution gradient: linking cellular effects to higher levels of biological organization. Environ Poll 129: 99-112.
- King F, Packard TT (1975) Respiration and the activity of the respiratory electron transport system in marine zooplankton. Limnol. Oceanog. 20: 849-854.
- Ates M, Arslan Z, Demir V, Daniels J, Farah IO (2015) Accumulation and toxicity of CuO and ZnO nanoparticles through waterborne and dietary exposure of goldfish (Carassius auratus). Environ Toxicol 30: 119-128. [Crossref]
- Wong SW, Leung PT, Djurisić AB, Leung KM (2010) Toxicities of nano zinc oxide to five marine organisms: influences of aggregate size and ion solubility. Anal Bioanal Chem 396: 609-618. [Crossref]
- Hao L, Chen L (2012) Oxidative stress responses in different organs of carp (Cyprinus carpio) with exposure to ZnO nanoparticles. Ecotoxicol Environ Saf 80: 103-110. [Crossref]
- Xia J, Zhao HZ, Lu GH (2013) Effects of selected metal oxide nanoparticles on multiple biomarkers in Carassius auratus. Biomed Environ Sci 26: 742-749
- Gagné F, Smyth SA, André C, Douville M, Gélinas M, et al. (2013) Stress-related gene expression changes in rainbow trout hepatocytes exposed to various municipal wastewater treatment influents and effluents. Environ Sci Pollut Res Int 20: 1706-1718. [Crossref]
- Burkhardt-Holm P, Bernet D, Hogstrand C (1999) Increase of metallothionein-immunopositive chloride cells in the gills of brown trout and rainbow trout after exposure to sewage treatment plant effluents. Histochem J 31: 339-346. [Crossref]
- Carney Almroth B, Albertsson E, Sturve J, Förlin L (2008) Oxidative stress, evident in antioxidant defences and damage products, in rainbow trout caged outside a sewage treatment plant. Ecotoxicol Environ Saf 70: 370-378. [Crossref]
- Formigari A, Irato P, Santon A (2007) Zinc, antioxidant systems and metallothionein in metal mediated-apoptosis: biochemical and cytochemical aspects. Comp Biochem Physiol C Toxicol Pharmacol 146: 443-459. [Crossref]
- Llorente MT, Parra JM, Sánchez-Fortún S, Castaño A (2012) Cytotoxicity and genotoxicity of sewage treatment plant effluents in rainbow trout cells (RTG-2). Water Res 46: 6351-6358. [Crossref]
- VosylienÄ MZ, KazlauskienÄ N, BarÅ¡ienÄ J, AndreikÄ naitÄ L, MilukaitÄ A, et al. (2010) Ecotoxicity and genotoxicity relating to fish in wastewaters discharged from the Vilnius treatment plant. Water Sci Technol 62: 859-865. [Crossref]
- Rocco L, Frenzilli G, Zito G, Archimandritis A, Peluso C, et al. (2012) Genotoxic effects in fish induced by pharmacological agents present in the sewage of some Italian water-treatment plants. Environ Toxicol 27: 18-25. [Crossref]
- Lin CJ, Fan-Chiang YC, Dufour S, Chang CF.Activation of brain steroidogenesis and neurogenesis during the gonadal differentiation in protandrous black porgy, Acanthopagrus schlegelii. Dev Neurobiol. In press.
- Tsai CL, Wang LH (1999) Effects of gonadal steroids on the serotonin synthesis and metabolism in the early developing tilapia brain. Neurosci Lett 264: 45-48. [Crossref]
- Clotfelter ED, McNitt MM, Carpenter RE, Summers CH (2010) Modulation of monoamine neurotransmitters in fighting fish Betta splendens exposed to waterborne phytoestrogens. Fish Physiol Biochem 36: 933-943. [Crossref]
- Levavi-Sivan B, Biran J, Fireman E (2006) Sex steroids are involved in the regulation of gonadotropin-releasing hormone and dopamine D2 receptors in female tilapia pituitary. Biol Reprod 75: 642-650. [Crossref]
- Lister A, Regan C, Van Zwol J, Van Der Kraak G (2009) Inhibition of egg production in zebrafish by fluoxetine and municipal effluents: a mechanistic evaluation. Aquat Toxicol 95: 320-329. [Crossref]
- Bradford MM (1976) A rapid and sensitive method for the quantitation of microgram quantities of protein utilizing the principle of protein-dye binding. Anal Biochem 72: 248-254. [Crossref]