Background: Prevention of hepatic encephalopathy and conservation of hepatic reserve are important in the treatment of cirrhosis. We performed a randomized prospective study to determine whether L-carnitine reduces ammonia levels and alleviates covert hepatic encephalopathy (CHE) in patients with cirrhosis.
Methods: Patients with cirrhosis who met the inclusion criteria (age: 20 to 79 years; serum ammonia level ≥ 60 µg/dL; presence of covert hepatic encephalopathy based on the number connection test B [NCT-B]) were randomly divided into a carnitine administration group and a control group. L-carnitine at a dose of 1000 mg was orally administered for 12 weeks in the carnitine group. Changes in ammonia levels and NCT-B scores were measured.
Results: Thirty-eight eligible patients were enrolled in each group. There were no significant differences in baseline characteristics. After 12 weeks of L-carnitine administration, serum ammonia levels were significantly lower in the carnitine group than in the control group (72.5 ± 33 vs. 89.4 ± 39 μg/dL) (p < 0.05). Patients with improved NCT-B scores were significantly more common in the carnitine group (n = 18) than in the control group (n = 9) (p = 0.03). Multivariate analysis identified body mass index < 25 (p = 0.001), albumin level < 3.5 g/dL (p = 0.029), and ammonia level ≥90 μg/dL (p = 0.048) as independent factors associated with a reduction in ammonia levels by ≥20 µg/dL during follow-up in the carnitine group.
Conclusion: Oral carnitine is an effective treatment for hepatic encephalopathy accompanying hyperammonemia in patients with cirrhosis.
L-carnitine, covert hepatic encephalopathy
BCAA: Branched-chain Amino Acids; BMI: Body Mass Index; BTR: BCAA/L-Tyrosine Molar Ratio; CHE: Covert Hepatic Encephalopathy; NCT-B: Number Connection Test B.
Hepatic encephalopathy caused by hyperammonemia is a frequent and serious complication of cirrhosis and commonly determines its prognosis. The efficacy of low-protein diet, branched-chain amino acids (BCAA), and lactulose are the main modern treatment approaches but are insufficient in most cases. In recent years, L-carnitine preparations have been used in Japan for the routine medical care of patients with secondary L-carnitine deficiency associated with cirrhosis.
Covert hepatic encephalopathy (CHE) is a disease without clear clinical symptoms, and cognitive abnormalities are observed only in patients with cirrhosis [1]. Since CHE has been reported to affect daily functioning and lead to car accidents [2-4], detecting and treating this disease at an early stage is beneficial to society. In addition, a study reported that CHE is a factor associated with poor prognosis in patients with cirrhosis [5]. Therefore, early detection and intervention are also important for improving prognosis.
Neuropsychiatric and neurophysiological tests are used to diagnose CHE. The latter are more commonly used in practice because neuropsychiatric tests are complex, need to be performed by a psychiatrist, and require electroencephalography. However, one relatively simple and widely used neuropsychiatric approach to detection of CHE is the neuropsychiatric test (NP-test), which consists of eight tests [6,7].
A number of studies performed outside of Japan have shown that L-carnitine can reduce serum ammonia levels. In contrast, the sparse Japanese studies were single-center trials [7], and no study has utilized both the NP-test and monitoring of ammonia levels during carnitine treatment.
Therefore, we performed a randomized prospective study to assess the efficiency of carnitine in reducing ammonia levels and alleviating encephalopathy in patients with cirrhosis.
Study design
This study was planned in 2016 by a steering committee at our hospital. Patients with liver cirrhosis who could receive L-carnitine for 3 months on an outpatient basis were enrolled between June 2016 and March 2017 and were randomly assigned to the oral administration of L-carnitine group (carnitine group) or no administration group (control group); they were followed-up to determine changes in serum parameters and results of a quantitative neuropsychiatric test.
Inclusion criteria were as follows: (1) 20 ≤ age ≤ 79 years, (2) no administration of carnitine within the 2 preceding weeks, (3) serum ammonia level exceeding 60 μg/dL, and (4) unsuccessful completion of the age-corrected number connection test B (NCT-B).
Exclusion criteria were as follows: (1) gastrointestinal bleeding; (2) giant shunts (diagnosed via enhanced computed tomography); (3) uncontrolled malignant tumors; (4) need of hemodialysis; (5) pregnancy; (6) receiving drugs causing hyperammonemia; and (7) overt hepatic encephalopathy decided based on the West-Haven criteria.
Administration of anti-hepatic encephalopathy drugs such as neomycin, lactulose, lactitol, branched chain amino acids, and rifaximin was permitted when the patients were already taking these drugs before the study, but we forbade starting the administration of these drugs during the study.
The primary endpoint was reduction of serum ammonia levels after 3 months of L-carnitine administration. The secondary endpoint was alleviation of hepatic encephalopathy and improved results in the NCT-B. Since the normal reaction time in the NCT-B varies with age, we used the cutoff values of the 90th percentile of the normal range reported by Kawaguchi et al. [8].
Study protocol
Patients who fulfilled the study requirements and provided written informed consent were randomly and prospectively divided by a third party affiliated with another division of our hospital using a randomizing software (Excel) program. The randomized register was kept in a locked box.
After randomization, administration of oral L-carnitine was then initiated and continued for 3 months. After the 3-month period, NCT-B was repeated, and the patients were encouraged to continue taking L-carnitine for as long as 1 year at their discretion. Serum laboratory tests were performed after 6 months and 1 year.
Target sample size and L-carnitine dose
The published studies [9-11] used a sample size of 50–60 patients in each group, and the administration of 900 mg of L-carnitine for 3 months led to a statistically significant improvement in the NCT-B results compared to the conventional treatment group (36.4% vs. 0%) [7]. Therefore, in this study, L-carnitine was administered orally at a dose of 1000 mg/day. We set α, β, and the dropout rate to 5%, 20%, and 20%, respectively, and selected a group size of 60 patients. Since the number of dropouts was expected to be small because of the short, 3-month study period, we performed an intermediate analysis to test for significant differences.
Written informed consent was obtained from all enrolled patients, and the ethical committees of our hospital approved this study.
Statistical analysis
Continuous variables were expressed as mean values and standard deviations and compared using the Mann-Whitney U test. Categorical variables were compared using the chi-square test.
The Cox proportional hazard regression model was used to evaluate factors contributing to an ammonia level decrease exceeding 20 μg/dL. The following variables were included in the univariate and multivariate analyses: NH3 level ≥ 90 μg/dL, body mass index (BMI) ≥25 kg/m2, tyrosine <120 nmol/mL, Child-Pugh score <6, aspartate amino transferase (AST) ≥40 U/L, prothrombin time (PT) ≥80%, albumin level (Alb) ≥3.5 g/dL, and choline esterase (Cho E) ≥200 U/L. Variables with p-values <0.05 in the univariate analysis were included in the multivariate analysis. Multivariate analyses were performed after ensuring that the variables were not correlated.
Changes in ammonia, albumin, total carnitine, free carnitine, acyl carnitine, taurine, Tyrosine, AST, and alanine aminotransferase (ALT) levels, PT, fasting blood sugar level (FBS), BCAA/L-tyrosine molar ratio (BTR), Fischer ratio, and Child-Pugh scores after the 3-month treatment were analyzed using the Wilcoxon signed-ranks test and Mann-Whitney U test or two-way repeated-measures analysis of variance. All statistical analyses were performed using IBM SPSS Statistics version 21 (IBM, Chicago, IL, United States).
Patient characteristics
Between June 2016 and March 2017, 76 patients who met the inclusion criteria were enrolled and randomly divided into the carnitine group (n = 38) and control group (n = 38) (Figure 1). Although no patient dropped out during the three-month follow-up, one patient in the control group chose to start receiving carnitine orally after the study and continued to take it during the follow-up period until 6 months. There were no significant differences between the two groups with regard to baseline characteristics (Table 1). The numbers of patients with Child-Pugh scores of A, B, and C were 29, 9, and 0, respectively, both in the carnitine and control groups. Twenty-seven and 28 patients in the carnitine and control groups, respectively, received BCAA. Safety parameters evaluated included blood tests (measurement of AST, ALT, γ-glutamyl transpeptidase, hemoglobin, bilirubin levels and PT) and no patients had severe side effects, with one patient having mild diarrhea.
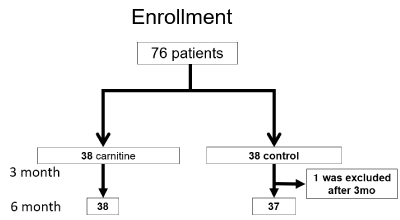
Figure 1: Patient enrollment chart. Seventy-six patients were enrolled (38 in the L-carnitine and control groups each) and evaluated after 3 months. Thirty-eight and 37 patients in the L-carnitine and control groups, respectively, were evaluated at 6 months.
Table 1. Baseline characteristics at entry.
| |
Carnitine (n=38) |
control (n=38) |
P |
Age |
69.9±8.5 |
70.2±8.9 |
0.98 |
Sex(male/females) |
(17/21) |
(16/22) |
0.74 |
HCV/HBV/NASH/Others |
20/3/10/5 |
19/2/9/8 |
0.80 |
Child-Pugh (A/B/C) |
29/9/0 |
29/9/0 |
1.00 |
Child-Pugh score |
6.08±1.1 |
6.05±1.1 |
0.92 |
HCC (yes/no) |
14/24 |
15/23 |
0.74 |
BCAA administration(y/n) |
27/11 |
28/10 |
0.71 |
WBC (×103/µL) |
4.3±1.3 |
4.4±1.3 |
0.56. |
RBC (×106/µL) |
3.9±0.5 |
3.9±0.9 |
0.86. |
Hb (g/dL) |
12.5 ±1.6 |
12.3 ±2.5 |
0.43 |
Plt (X104/mm3) |
11.5 ±4.7 |
11.8 ±4.6 |
0.59 |
AST (U/L) |
43.4±19.6 |
37.6 ±16.6 |
0.19 |
ALT (U/L) |
28.0±16.2 |
25.7±14.6 |
0.47 |
Total protein(g/dL) |
7.3±0.7 |
7.1±0.7 |
0.11 |
Alb (g/dL) |
3.5±0.5 |
3.6 ±0.7 |
0.94 |
T-Bill(mg/dL) |
1.2±0.5 |
1.2±0.4 |
0.95 |
Ammonia(μg/dL) |
92.2±31 |
91.8±29 |
0.95 |
LDH (IU/L) |
241±70 |
237±63 |
0.79 |
ALP (IU/L) |
428±192 |
386±161 |
0.30 |
γ-GTP(IU/L) |
46±34 |
65±86 |
0.22 |
BUN (mg/dL) |
17±6 |
17±8 |
0.66 |
Cre (mg/dL) |
0.7±0.2 |
0.7±0.1 |
0.93 |
Cho E (IU/L) |
195±70 |
206±105 |
0.61 |
FBS (mg/dL) |
104±58 |
103±51 |
0.95 |
PT (%) |
80.1 ±13 |
83.7 ±15 |
0.25 |
BMI(kg/m2) |
23.7 ±3.5 |
23.4 ±4.7 |
0.76 |
Fischer ratio |
2.26 ±0.9 |
2.63±1.4 |
0.17 |
Biochemical markers and NCT-B performance before and 3 months after L-carnitine administration
After 3 months of treatment, there were significant decreases in the carnitine group in terms of serum ammonia level (92.2 ± 31 μg/dL vs. 72.5 ± 33 μg/dL, p < 0.01) and significant increases (p < 0.001) in serum total carnitine level (60.5 ± 13.1 μmol/L vs. 97.3 ± 24 μmol/L), free carnitine level (48.0 ± 9.8 μmol/L vs. 75.2 ± 19.8 μmol/L), and acyl carnitine level (12.5 ± 4.8 μmol/L vs. 22.1 ± 8.9 μmol/L), whereas no such significant changes were observed in the control group (Table 2). In the carnitine group, the ammonia level decreased in 30 patients and increased in 8, whereas the corresponding numbers were 21 and 17 in the control group (p < 0.05). There were no significant changes in taurine and BTR levels and Fischer ratio after treatment in either group. The patients’ performance in the NCT-B reached normal levels in 18 patients in the carnitine group and only 9 in the control group after 3 months of treatment (p < 0.05). In the carnitine group, there were significant decreases in the improved NCT-B group (18 patients) in terms of serum ammonia level (91.9 ± 35 μg/dL vs. 62.5 ± 25 μg/dL) (p =0.006), whereas no significant changes were observed in the unimproved NCT-B group (20 patients) (92.5 ± 28 μg/dL vs. 82.1 ± 36 μg/dL) (p =0.32). In the control group, serum ammonia level tended to decrease in the improved NCT-B group (9 patients) (82.4 ± 17 μg/dL vs. 63.4 ± 21 μg/dL) (p =0.054), whereas no significant changes were observed in the unimproved NCT-B group (29 patients) (94.7 ± 31 μg/dL vs. 97.5 ± 41 μg/dL) (p =0.78).
Table 2. Biochemical markers pre and 3 months after treatment (* p<0.05 3M versus pre-treatment, * * p<0.01 3M versus pre-treatment, * * * p<0.001 3M versus pre-treatment, ‡ P<0.05 L-carnitine versus control, ‡‡P<0.001 L-carnitine versus control)
| |
L-carnitine (n=38) |
control (n=38) |
| |
Pretreatment |
3 mo Posttreatment |
pretreatment |
3 mo Posttreatment |
Ammonia(μg/dL) |
92.2±31 |
72.5±33 |
91.8±29 |
89.4±39 |
Total carnitine (μmol/L) |
60.5 ±13.1 |
97.3±24 |
62.1 ±11.6 |
64.8±14.5 |
Free carnitine (μmol/L) |
48.0±9.8 |
75.2±19.8 |
50.0 ±10.2 |
51.4 ±12.5 |
Acyl carnitine (μmol/L) |
12.5 ±4.8 |
22.1±8.9 |
12.0±4.1 |
14.0±9.1 |
Acyl carnitine/Free carnitine ratio |
0.25±0.08 |
0.30 ±0.11 |
0.25±0.08 |
0.28±0.2 |
Taurine (nmol/mL) |
68.9±38 |
65±29 |
72.5±19 |
66.6±24 |
BTR |
4.1±1.8 |
5.1±3.5 |
4.2±2.3 |
4.9±2.3 |
Fischer ratio |
2.3±0.8 |
2.6±1.4 |
2.6±1.4 |
2.6±1.0 |
Number of ammonia decrease/increase |
------------ |
30/8 |
------------ |
21/17 |
NCT-B(within normal limit/ abnormal) |
0/38 |
18/20 |
0/38 |
9/29 |
NCT-B changes after L-carnitine treatment
Among the 18 patients with improved NCT-B scores in the carnitine group, only one patient showed an increase in ammonia levels (Table 3). Despite a decrease in the ammonia levels, NCT-B scores did not improve in 13 patients. There was a statistically significant difference between these two subgroups (p = 0.04, chi-square test). In cases when ammonia decreased, there were significant decreases in the improved NCT-B group (17 patients) in terms of the serum ammonia level (92.7 ± 35 μg/dL vs. 60.5 ± 24 μg/dL) (p =0.005), whereas no significant changes were found in the unimproved NCT-B group (13 patients) even though their ammonia levels decreased (93.7 ± 30 μg/dL vs. 70.3 ± 30 μg/dL) (p =0.06).
Table 3. NCT-B changes after L-carnitine treatment
| |
NCT-B became normal (18) |
NCT-B did not change (20) |
Ammonia decrease
(30) |
17 |
13 |
Ammonia increase
(8) |
1 |
7 |
Comparison of subgroups with ammonia level reduction of ≥ 20 µg/dL and <20 µg/dL or ammonia level increase
During the course of carnitine administration, ammonia levels decreased by ≥20 µg/dL in 18 patients and decreased by <20 µg/dL or increased in 20 patients (Table 4). In the group with significant reduction, the pretreatment BMI was significantly lower, the pretreatment ammonia levels were significantly higher, and the pretreatment albumin levels were significantly lower (P < 0.05). Although there was no significant difference in the fractional carnitine concentrations, the increase in the blood levels at three months was significantly higher in the group in which ammonia levels decreased by ≥20 µg/dL than in the group with a reduction of <20 µg/dL or with an increase (P < 0.05).
Table 4. Factors contributing to reduction of serum ammonia more than 20μg/dL VS less than 20μg/dL and/or increase. (‡ P<0.05 ≧20μg/dL versus reduction<20μg/dL or increase)
| |
Reduction≧20μg/dL (n=18) |
Reduction<20μg/dL or increase (n=20) |
| |
Pretreatment |
3 mo Posttreatment |
pretreatment |
3 mo Posttreatment |
BMI |
22.3±3.0 ‡ |
|
24.7±3.7 |
|
Total carnitine (μmol/L) |
59 ±11 |
102±25 |
62±14 |
93±22 |
Free carnitine (μmol/L) |
47±9 |
78.8±21 |
49±10 |
72±18 |
Acyl carnitine (μmol/L) |
12 ±4 |
23±10 |
12±5 |
21±7 |
Acyl carnitine/Free carnitine ratio |
0.26 ±0.06 |
0.30 ±0.11 |
0.25±0.09 |
0.30±0.12 |
Δ Total carnitine(posttreatment-Pretreatment) (μmol/L) |
--------- |
43.4±20.8‡ |
--------- |
30.2±17.2 |
Δ Free carnitine (posttreatment-Pretreatment) (μmol/L) |
--------- |
32.1±16.8‡ |
--------- |
22.3±12.8 |
Δ Acyl carnitine (posttreatment-Pretreatment) (μmol/L) |
--------- |
11.3±8.9 |
--------- |
7.9±7.1 |
Ammonia(μg/dL) |
102±35‡ |
64±31 |
83±23 |
80±34 |
Albumin (g/dL) |
3.3±0.5‡ |
3.3±0.4 |
3.7±0.5 |
3.6±0.4 |
BTR |
3.8±1.8 |
4.3±2.6 |
4.3±1.7 |
5.9±4.1 |
Fischer ratio |
2.1±0.8 |
2.3±1.3 |
2.4±0.9 |
2.8±1.4 |
Prognostic factors
To identify factors associated with a reduction of serum ammonia level ≥ 20 μg/dL, we performed univariate and multivariate analyses (Table 5). In the univariate analysis, NH3 level ≥ 90 μg/dL (p = 0.022), BMI < 25 kg/m2 (p = 0.012), and albumin level < 3.5 g/dL were associated with a ≥ 20-μg/dL reduction in ammonia level, and these three factors were also identified as independent factors in the multivariate analysis.
Table 5. Factors contributing to reduction of serum ammonia more than 20μg/dL
|
|
univariate analysis |
|
multivariate analysis |
|
|
Sub-group |
Risk ratio |
95% CI |
P-Value |
Risk ratio |
95% CI |
P-Value |
Child-Pugh |
5, or 6≦ |
2.86 |
0.69-11.8 |
0.135 |
|
|
|
NH3 (μg/dL) |
<90, or 90≦ |
4.71 |
1.17-18.8 |
0.022 |
6.53 |
1.02-42.0 |
0.048 |
BMI (kg/m2) |
<25, or 25≦ |
0.16 |
0.03-0.75 |
0.012 |
0.035 |
0.003-0.453 |
0.010 |
Tyrosine (nmol/mL) |
<120, or 120≦ |
3.61 |
0.76-17.0 |
0.092 |
|
|
|
AST (U/L) |
<40, or 40≦ |
2.36 |
0.64-8.67 |
0.192 |
|
|
|
Alb (g/dL) |
<3.5, or 3.5≦ |
0.21 |
0.05-0.85 |
0.023 |
0.078 |
0.008-0.769 |
0.029 |
PT (%) |
<80, or 80≦ |
1.33 |
0.35-5.02 |
0.670 |
|
|
|
Cho E (U/L) |
<200, or 200≦ |
0.42 |
0.11-1.56 |
0.192 |
|
|
|
2021 Copyright OAT. All rights reserv
Further changes in ammonia level and occurrence of obvious hepatic encephalopathy
After 3 months of treatment, we recommended that the patients continue taking L-carnitine for as long as possible (up to 1 year). Between the 3- and 6-month time points, one person in the control group chose to start taking L-carnitine. After 6 months, there were significant decreases in serum ammonia level in the carnitine group (75.9 ± 40 vs. 89.9 ± 44) (p = 0.023) (Figure 2).
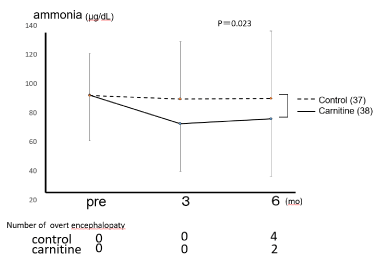
Figure 2: L-carnitine administration resulted in significant reductions in ammonia levels even after 6 months (two-way repeated-measures ANOVA, p = 0.023).
Six months into the study, 4 patients in the control group and 2 patients in the carnitine group had obvious encephalopathy (II), but there were no significant differences between the groups.
The prevalence of CHE was reported to be between 30% and 84% in patients with cirrhosis [7,12,13].
In the study by Romero-Gomez et al., 53% of patients with cirrhosis had covert encephalopathy, and 84% of patients who developed apparent encephalopathy during follow-up had covert encephalopathy initially. Therefore, patients with covert encephalopathy are at a high risk for developing overt encephalopathy, and early diagnosis of covert encephalopathy is important for timely intervention.
There are various NP tests, and several tests are generally combined to detect minimal encephalopathy. However, in practice, it is usually difficult to perform several tests at different institutions because of time restrictions and the high volume of patients. Saito et al. compared the tests to each other and concluded that NCT-B was superior in terms of diagnosing and monitoring minimal encephalopathy [7]. Therefore, we chose to diagnose minimal encephalopathy using NCT-B.
The mechanism of action of carnitine in hepatic encephalopathy has not been fully elucidated. Stimulation of the urea cycle is considered to play an important role [14-16]. Possible mechanisms of the reduction of ammonia levels by L-carnitine are (1) increased production of ATP, which is essential for the conversion of ammonia to urea, and (2) stimulation of the urea cycle via production of N-acetylglutamate. L-carnitine administration was shown to significantly reduce blood ammonia levels in rats and mice [17]. In human patients, a rapid reduction in blood ammonia levels by L-carnitine combined with BCAA [18], reduction in ammonia levels by L-carnitine administration for 90 days in apparent encephalopathy [10,19], and improvement in CHE [20] were reported. However, in these studies, the dosage of L-carnitine was relatively high (2g), and fractional amino acids or carnitine levels in the blood were not analyzed.
According to the literature, blood ammonia levels are not highly correlated with blood L-carnitine levels [21]. In addition, L-carnitine in the blood constitutes less than 1% of total L-carnitine, which is primarily present in muscles. Although Shiraki et al. reported a correlation between L-carnitine levels in the blood and liver; however, it is difficult to understand the exact relationship between L-carnitine blood levels and the amount of L-carnitine in the entire body. A dose of 2 g or more is commonly used in studies outside of Japan. In contrast, a Japanese study on carnitine dosage demonstrated that both 900 and 1200 mg were effective in reducing muscle cramps, with the higher dose showing a greater effect [22]. Therefore, we used a new formulation, a 1000 mg FF tablet, which is equivalent to the 1200 mg dose used in the above report.
There are a number of studies on the relationship between ammonia levels and liver disease, and conflicting results have been reported. In chronic liver diseases, blood ammonia levels were found to be increased [23], decreased [24], or unchanged [25], and there is no unified view at present [26]. The present study did not show remarkably large changes. Furthermore, some studies reported that blood ammonia levels are correlated with the grade of hepatic encephalopathy [27], whereas others argue against this [28]. In the present study, there were no cases with advanced hepatic encephalopathy, and serum ammonia levels were not high in most cases.
In the group in which the ammonia levels decreased by ≥20 µg/dL, BMI values and albumin levels were low, which indicates that most patients were malnourished. A low BMI value is generally accompanied by low muscle mass. In addition, although there was no correlation between the ammonia and L-carnitine levels at baseline, higher increases in blood L-carnitine levels after administration corresponded to greater decreases in ammonia levels. The reduction in the ammonia levels by L-carnitine takes place not in the muscles but in the liver. Therefore, the lower the muscle mass, which contain most of the total L-carnitine, the larger the effect of L-carnitine supplementation becomes. This presumably led to higher increases in L-carnitine levels in the blood, resulting in stronger stimulation of the urea cycle and a larger reduction in ammonia levels in the liver.
To summarize, the use of L-carnitine in the present study was demonstrated to be very safe, with no severe adverse events observed during the follow-up, and effective, with persistent reduction in ammonia levels six months after oral administration. However, the effect of long-term administration on the incidence of hepatic encephalopathy needs to be further investigated.
We would like to thank Editage (www.editage.jp) for English language editing. Registration number of the article: R000025857, UMIN: UMIN000022552.
The authors declare that they do not have conflicts of interest with respect to this manuscript.
- Zhou YQ, Chen SY, Wang JY (2009) Development and evaluation of the quality of life instrument in chronic liver disease patients with minimal hepatic encephalopathy. J Gastroenterol Hepatol 24: 408-415. [Crossref]
- Bajaj JS, Pinkerton SD, Heuman DM (2012) Diagnosis and treatment of minimal hepatic encephalopathy to prevent motor vehicle accidents: a cost-effectiveness analysis. Hepatology 55: 1164-1171. [Crossref]
- Bajaj JS, Saeian K, Heuman DM (2009) Minimal hepatic encephalopathy is associated with motor vehicle crashes: the reality beyond the driving test. Hepatology 50: 1175-1183. [Crossref]
- Groeneweg M, Quero JC, Schalm SW (1998) Subclinical hepatic encephalopathy impairs daily functioning. Hepatology 28: 45-49. [Crossref]
- Dhiman RK, Kurmi R, Chawla Y (2010) Diagnosis and prognostic significance of minimal hepatic encephalopathy in patients with cirrhosis of liver. Dig Dis Sci 55: 2381-2390. [Crossref]
- Kato A, Tanaka H, Okita K (2013) Nutritional management contributes to improvement in minimal hepatic encephalopathy and quality of life in patients with liver cirrhosis: A preliminary, prospective, open-label study. Hepatol Res 43: 452-458. [Crossref]
- Saito M, Hirano H, Azuma T (2016) Serum level of taurine would be associated with the amelioration of minimal hepatic encephalopathy in cirrhotic patients. Hepatol Res 46: 215-224. [Crossref]
- Malaguarnera M, Pistone G, Astuto M, Dell'Arte S, Finocchiaro G, et al. (2003) L-Carnitine in the treatment of mild or moderate hepatic encephalopathy. Dig Dis 21: 271-275. [Crossref]
- Malaguarnera M, Pistone G, Elvira R, Leotta C, Scarpello L, et al. (2005) Effects of L-carnitine in patients with hepatic encephalopathy. World J Gastroenterol 11: 7197-7202. [Crossref]
- Malaguarnera M, Vacante M, Giordano M, Pennisi G, Bella R, et al. (2011) Oral acetyl-L-carnitine therapy reduces fatigue in overt hepatic encephalopathy: a randomized, double-blind, placebo-controlled study. Am J Clin Nutr 93: 799-808. [Crossref]
- Quero JC, Hartmann IJ, Schalm SW (1996) The diagnosis of subclinical hepatic encephalopathy in patients with cirrhosis using neuropsychological tests and automated electroencephalogram analysis. Hepatology 24: 556-560. [Crossref]
- Romero-Gomez M, Boza F, Aguilar-Reina J (2001) Subclinical hepatic encephalopathy predicts the development of overt hepatic encephalopathy. Am J Gastroenterol 96: 2718-2723.
- Kawaguchi T, Konishi M, Takikawa Y (2017) Updating the neuropsychological test system in Japan for the elderly and in a modern touch screen tablet society by resetting the cut-off values. Hepatol Res 47: 1335-1339.
- O'Connor JE, Costell M, Grisolia S (1984) Protective effect of L-carnitine on hyperammonemia. FEBS Lett 166: 331-334. [Crossref]
- O'Connor JE, Costell M, Grisolia S (1987) Effect of L-carnitine on ketone bodies, redox state and free amino acids in the liver of hyperammonemic mice. Biochem Pharmacol 36: 3169-3173. [Crossref]
- Costell M, O'Connor JE, Grisolia S (1984) Effects of L-carnitine on urea synthesis following acute ammonia intoxication in mice. Biochem Biophys Res Commun 120: 726-733. [Crossref]
- Horiuchi M, Kobayashi K, Saheki T (1992) Carnitine administration to juvenile visceral steatosis mice corrects the suppressed expression of urea cycle enzymes by normalizing their transcription. J Biol Chem 267: 5032-5035. [Crossref]
- Malaguarnera M, Risino C, Rampello L (2009) Branched chain amino acids supplemented with L-acetylcarnitine versus BCAA treatment in hepatic coma: a randomized and controlled double blind study. Eur J Gastroenterol Hepatol 21: 762-770.
- Malaguarnera M, Vacante M, Pennisi G (2011) Acetyl-L-carnitine improves cognitive functions in severe hepatic encephalopathy: a randomized and controlled clinical trial. Metab Brain Dis 26: 281-289.
- Malaguarnera M, Gargante MP, Cristaldi E, Vacante M, Risino C, et al. (2008) Acetyl-L-carnitine treatment in minimal hepatic encephalopathy. Dig Dis Sci 53: 3018-3025. [Crossref]
- Shiraki M, Shimizu M, Moriwaki H, Okita K, Koike K (2017) Carnitine dynamics and their effects on hyperammonemia in cirrhotic Japanese patients. Hepatol Res 47: 321-327. [Crossref]
- Nakanishi H, Kurosaki M, Tamaki N (2015) L-carnitine Reduces Muscle Cramps in Patients with Cirrhosis. Clin Gastroenterol Hepatol 13: 1540-1543.
- Fuller RK, Hoppel CL: (1983) Elevated plasma carnitine in hepatic cirrhosis. Hepatology 3: 554-558.
- Rudman D, Sewell CW, Ansley JD (1977) Deficiency of carnitine in cachectic cirrhotic patients. J Clin Invest 60: 716-723.
- Chen SH, Lincoln SD (1977) Increased serum carnitine concentration in renal insufficiency. Clin Chem 23(2 PT. 1): 278-280.
- Krahenbuhl S (1996) Carnitine metabolism in chronic liver disease. Life Sci 59:1579-1599.
- Ong JP, Aggarwal A, Mullen KD (2003) Correlation between ammonia levels and the severity of hepatic encephalopathy. Am J Med 114: 188-193.
- Kundra A, Jain A, Kar P (2005) Evaluation of plasma ammonia levels in patients with acute liver failure and chronic liver disease and its correlation with the severity of hepatic encephalopathy and clinical features of raised intracranial tension. Clin Biochem 38: 696-699.