The objective of the present study was to evaluate the effect of active compounds from Leptadenia reticulate [W&A] leaf on serum glucose in normal and diabetic rats. Diabetes was induced by Streptozotocin (STZ) and High Fat Diet (HFD) in wistar rats. An isolated fraction of ETLR (100mg/kg) and Metformin (50mg/kg) was administered orally. An isolated fractions showing for higher anti diabetic activity was subjected to column chromatography that led to isolation of a pure compound, which was given trivial name LR-1. The fraction D from ETLR was found to lower the FBG level significantly (P<0.05) in diabetic rats. To ensure the compounds responsible for anti-diabetic activities associated with D respectively. Further column chromatographic analysis was carried out with D using various solvent systems and which was given trivial name LR-1. LR-1 was phenolic compound nature (Flavonoids) confirmed by spectral analysis.
blood glucose, Leptadenia reticulate [W&A], flavonoids
The chemistry of natural products is an emerging area in drug development activity. The secondary metabolite derived from plant and animal sources are proved to be an effective therapeutic agent in various diseases [1]. Naturally the secondary metaboilites of the plant provide defence mechanisms against predators, pathogens, and for self-protection against herbivory and microbes [2]. The scientists are exploiting the natural products of the plant and they are focusing their attention to isolate the secondary metabolites of the plant and animals for treating various ailments [3]. The important plant secondary metabolites are namely alkaloids, glycosides, tannins, lignins, flavanoids, terpenes, volatile oils, fixed oils, steroids so on [4]. The chemistry of natural products helps the scientists to find out the structure of the secondary metabolites by using various separation techniques such as Colum chromatography, thin layer chromatography (TLC) and sophisticated analytical techniques such as UV, IR, NMR and Mass spectroscopy. Currently, at least 119 chemical substances derived from 90 plant species can be considered as important drugs that are in use in one or more countries [5]. Among these some of the successful drugs are isolated from the natural sources such as antibiotic “penicillin’’ from Penicillium notatum, antimalarial agent “quinine’’ from Cinchona succirubra, narcotic analgesic aspirin precursor “salicin’’ from white willow bark Salix alba, cardiac glycoside “digoxin’’ from digitalis purpurea and so on [6]. More recently, anticancer agents “vincristine and vinblastine” are isolated from the Catharanthus roseus; and these agents are successfully prescribed by the physicians for the treatment of cancer [7]. The interesting results of our preliminary studies with the ethanolic extracts of Leptadenia reticulata [W&A] (ETLR) [8] have motivated to isolate anti-diabetic active compounds from the leaves of LR for the management hypoglycaemic and hypolipidemic activities.
Preparation of different plant extracts
Leptadenia reticulate [W&A] leaves were collected from the forest of kalakatu, Tirunelveli District, India. Taxonomic identification was made from botanical survey of medicinal plants, Siddha Unit, Government of India, Palayamkottai anthenticated by Chelladurai Botonist. A voucher specimen No (CCRAS-167/2011). Fresh plant leaves were shade dried at room temperature, ground into fine powder and stored in airtight containers. Then extracted (amount 500g) with solvents of increasing polarity such as petroleum ether, ethyl acetate, and ethanol, for 72 hours with each solvent, by continuous hot extraction using the soxhlet apparatus at a temperature of 60°C. The extracts were concentrated under reduced pressure using a rotary evaporator to constant weight. The extracts were collected and preserved in a desiccator until used for further studies.
Fractionation, isolation, purification and characterization of compounds from the ethanol extract
Chromatographic techniques were used for the isolation of compounds from the fractions. The column chromatographic technique most commonly used for the separation of compounds into several fractions according to the affinity or solvating capacity of the compounds to the solvent used. The study involves in fractionation and isolation of compounds from pharmacologically active ethanol extract. The structure of the compound were tried to establish by spectroscopic methods.
Study design
In order to carry out column chromatography, a solvent system was established by developing TLC technique. The silica gel (100-200 mesh size) slurry was made with the solvent system established earlier. The slurry was poured time to time into the column very carefully and the silica gel was allowed to settle down to from a uniform packing. Then the stop-cock of the column was opened and the excess of solvent over the column head was allowed to run. The dry crude ethanol extract (10g) was mixed with small amount of silica gel in a mortar to get a free flowing powder. The powdered sample was then applied carefully on the top of the prepared column and successfully eluted with solvent/solvent system using various solvent systems such as benzene, benzene: chloroform, chloroform: methanol, methanol: ethanol and ethanol alone to separate the eluate. The eluate with same Rf value are pooled together and evaporated to dryness.When the mixture of solvent system used, the ratio of mixtures are prepared as 90:10, 80:20, 70:30, 60:40, 50:50, 40:60, 30:70, 20:80 and 10:90. Elutes were collected in a number of conical flasks marked from fractions 1-100. Elutes were spotted successfully on TLC plate and the flasks having similar spots were combined together.
Animals
Male Wistar rats each weighing 180–220g was obtained from RMMCH in Annamalai University at Chidambaram, Tamil Nadu, India. The guidelines of the Committee for the Purpose of control and Supervision of Experiments on Animals (CPCSEA) of the Government of India were followed, and prior permission was granted from the Institutional Animal Ethics Committee (No. 842/CPCSEA). Rodent laboratory chow and water were accessed ad libitum, and rats were maintained on a 12h light/dark cycle in a temperature regulated room (20–25°C) during the experimental procedures.
Effect of ETLR on FBG and lipid profile in diabetic rats
Various isolated fractions of ETLR (100mg/kg) were evaluated for their anti-diabetic effect in fed with high energy diet of 20% sucrose and 10% lard. The STZ was freshly dissolved in citrate buffer (0.01mol/L, pH 4.5) and kept on ice prior to use. One week later STZ inductions of diabetes in wistar rats, the fasting blood glucose levels were measured [9]. The hyperglycemic rats (blood glucose >240mg/dl) were divided into 10 groups (each with 3 rats). Distilled water, metformin and various isolated fractions of ETLR (100mg/kg) daily administered orally to normal control, diabetic control and the treatment groups respectively for 3 weeks.
Purification of isolated fraction
Nearly 1gm of the fraction is weighed and mixed with silica gel and poured into the column. The column is eluted with different solvents by polarity basis. Aliphatic fractions are separated by the solvent petroleum ether. In this solvent system, some distinct bands are formed. That fraction is collected and evaporated to dryness. The aromatic fractions are separated by the n-hexane: ethyl acetate mixture in the ratio of 1:1. The polar fraction present in the extract is eluted by using chloroform. The second polar fraction of the extract is eluted by using methanol. The column fraction which is collected and evaporated to dryness is used for further studies.
Analysis of fraction
The fraction was characterized by spectroscopy techniques like Perkin-Elmer Vector 22 model FT-IR Spectrophotometer (Nujol), 1H NMR spectra were recorded in a BRUKER DPX-200MHz using TMS as internal standard and Mass spectrometer spectra was recorded in SHIMADZU QP 50000 and was given a trivial name LR - 1.
Statistical analysis
Data are expressed as ± SEM. Statistical analysis was performed by one-way analysis of variance (ANOVA). The least significant difference test was used for mean comparisons and P<0.05 was considered to be statistically significant.
Column chromatography study with ETLR
The column chromatography study was carried out with ETLR to separate the eluates namely, F 1–24 using benzene as a solvent system, F 25–54 using benzene: chloroform, F 55–81 using chloroform, F 82–108 using chloroform: methanol, F 109–135 using methanol alone, F 136 – 174 using methanol: ethanol finally ethanol alone is used the eluate F 175–200. The volume of each eluate is 50 ml. The eluates with same Rf value were pooled together and evaporated to dryness. The pooled fraction of DVLR such as F 1–24, F 25–54, F 55–81, F 82–108, F 109–135, F 136–174 and F 175–200 are named as A, B, C, D, E, F and G respectively.The pooled eluates of A, B, C, D, E, F, G were tested in fasting blood glucose level in streptozotocin induced diabetic rats.
Effects of 3-week administration of various isolated fractions ETLR (100mg/kg), and Metformin (50mg/kg) on blood glucose in streptozotocin (STZ) induced diabetic Rats
From the study it was observed that the fraction “D” showed significant (P<0.05) decrease in blood glucose but the other fractions did not show significant effect of blood glucose when compared with normal control. The results of the effect of various isolated fractions of ETLR (100mg/kg) on the blood glucose level in STZ induced diabetic rats are shown in Table 1.
Table 1. Effect of Various Isolated Fractions of ETLR (100 mg/kg) on the Blood Glucose Level in STZ Induced Diabetic Rats
Treatment |
Fasting blood glucose |
0 day |
7th day |
14th day |
21st day |
Normal control |
78.4 ± 3.7 |
77.9 ± 4.2 |
78.5 ± 2.7 |
76.6 ± 3.6 |
Diabetic control |
67.3 ± 5.8 |
261.8 ± 5.3 |
259.3 ± 4.8 |
251.4 ± 2.8 |
Fraction – A |
72.3 ± 2.7 |
263.4 ± 4.6 |
214.8 ± 2.6 |
189.4 ± 4.6 |
Fraction – B |
78.8 ± 5.4 |
258.3 ± 2.8 |
226.6 ± 4.9 |
172.3 ± 5.7 |
Fraction – C |
79.9 ± 8.5 |
261.8 ± 1.9 |
219.5 ± 3.7 |
165.4 ± 3.2 |
Fraction – D |
83.4 ± 6.8 |
249.9 ± 7.4 |
162.7 ± 5.3 |
91.4 ± 7.4* |
Fraction – E |
74.5 ± 5.1 |
252.2 ± 3.5 |
198.4 ± 1.9 |
146.8 ± 2.6 |
Fraction – F |
76.7 ± 4.7 |
245.6 ± 5.7 |
187.5 ± 6.5 |
156.7 ± 6.1 |
Fraction – G |
75.3 ± 3.6 |
259.4 ± 6.2 |
191.1 ± 3.9 |
140.5 ± 5.3 |
Metformin |
80.3 ± 3.4 |
251.4 ± 5.5 |
142.3 ± 3.1 |
87.4 ± 6.1* |
n=3. * P<0.05 vs control group
S. No |
Solvent system used in column elution |
Eluates |
Volume of pooled eluate (ml) |
Solvent system used for TLC |
Nature of compound |
|
|
|
|
|
|
1. |
Hexane alone |
F 1 – F 3 |
300 |
Methanol: Ethyl acetate: Acetic acid (10: 20: 70) |
|
2. |
Ethyl acetate: Hexane (25: 75) |
F 4 – F 9 |
300 |
Methanol: Ethyl acetate: Acetic acid (10: 20: 70) |
|
3. |
Ethyl acetate: Hexane (50: 50) |
F 10 – F 14 |
300 |
Methanol: Ethyl acetate: Acetic acid (10: 20: 70) |
|
4. |
Ethyl acetate: Hexane (25: 75) |
F 15 – F 20 |
300 |
Methanol: Ethyl acetate: Acetic acid (10: 20: 70) |
|
5. |
Ethyl acetate (100) |
F 21 – F 26 |
300 |
Methanol: Ethyl acetate: Acetic acid (10: 20: 70) |
|
6. |
Methanol: Ethyl acetate (10: 90) |
F 27 – F 33 |
300 |
Methanol: Ethyl acetate: Acetic acid (10: 20: 70) |
|
7. |
Methanol: Ethyl acetate (20: 80) |
F 34 – F 35 |
300 |
Methanol: Ethyl acetate: Acetic acid (10:20: 70) |
|
8. |
Methanol: Ethyl acetate (50: 50) |
F 36 – F 37 |
300 |
Methanol: Ethyl acetate: Acetic acid (10: 20: 70) |
Amorphous powder with decomposition point * |
9. |
Methanol alone (100) |
F 38 – F 40 |
100 |
Methanol: Ethyl acetate: Acetic acid (10: 20: 70) |
|
Purification of pooled column fraction of ETLR by column chromatography
From the results of anti-diabetic effect, the fraction “D” from ETLR showed promising results. Hence this fraction was subjected to further purify using column chromatography and followed by TLC. The natures of fractions obtained are listed in Table 2.
Table2. The Column Chromatographic Fractions of D from ETLR and their TLC Analysis
* is the compound from the fractions of (F36 – 37) named as LR – 1
Characterization of compounds using various analytical techniques
IR Studies with LR – 1: The IR spectra exhibit characteristic absorption band at 1617.31cm-1 which shows that the compound possesses -OH bending and a C=O strecthing is present at 1669.53cm-1. The IR spectra exhibit characteristic absorption band at 3227.84cm-1 which shows that the aromatic –CH stretching and 3420.22cm-1 which shows that –OH stretching. The spectrum of the compound is given in Figure 1.
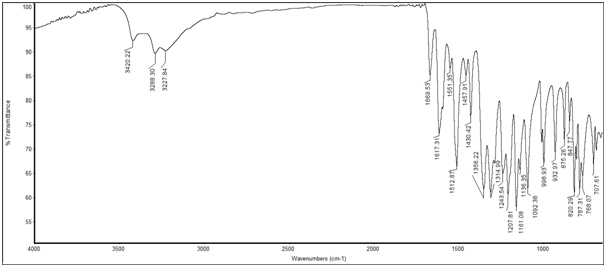
Figure 1. IR Spectrum of the Compound LR-1 from ETLR
5.4.2.13C-NMR Studies with LR–1: From the spectra it was observed that the 13C-NMR showed 22 signals. It revealed that the chemical shift was observed at d93.91ppm, d98.80ppm (Aliphatic C=C), d115.38-d164.18ppm (Aromatic carbon) d206.96ppm (-C=O) and d144.58-d164.18ppm (Aromatic ipso carbon). The spectrum of the compound is given in Figure 2.
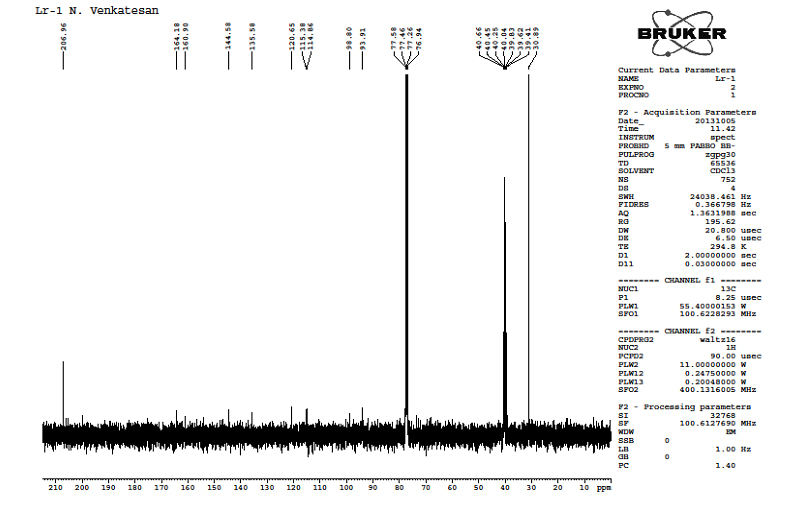
Figure 2. 13C-NMR Spectrum of LR -1 from ETLR
5.4.3.1H-NMR Studies with LR–1: From the spectra, it was observed that –OH at d0.94, d0.97, d1.00, d1.03ppm. Aromatic –CH observed that d6.96 - d7.78ppm. The spectrum of the compound is given in Figure 3.
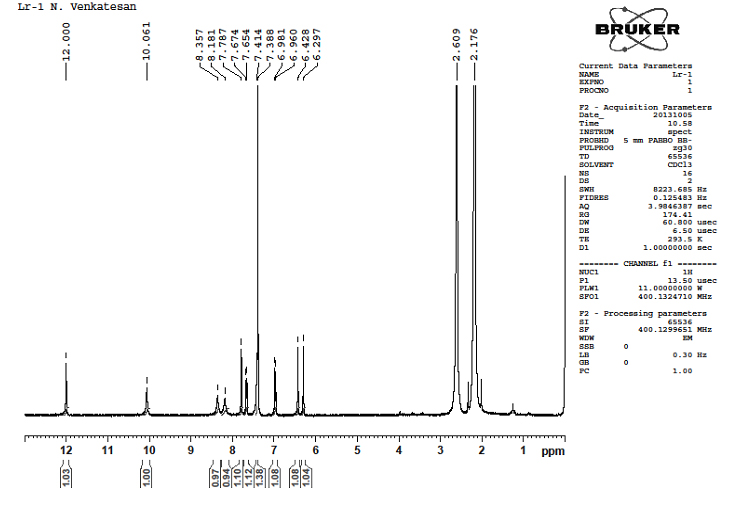
Figure 3. 1H-NMR spectrum of LR -1 from ETLR
5.4.4. Mass spectrum studies with LR–1: From the mass spectrum of LR–1, it was observed that a molecular ion signal m/z=201.18. The observed fragmentation pattern shows the similarity of a compound having an aromatic origin. The spectrum of the compound is given in Figure 4.
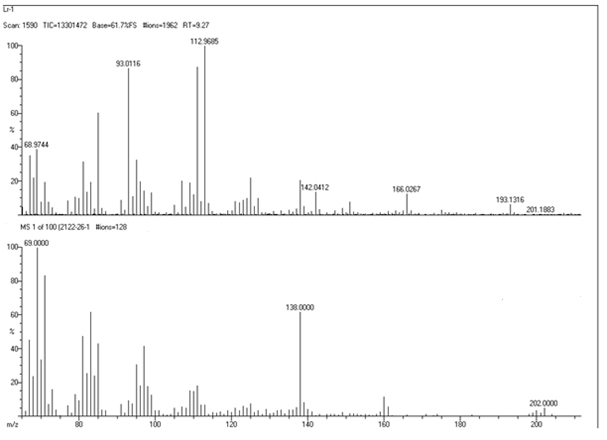
Figure 4. Mass spectrum of LR – 1 from ETLR
Now a day, the interest in the study of natural product is growing rapidly, especially as a part of drug discovery programs. In our previous studies proved that the anti-diabetic activities are associated with the active constituents of ETLR [8]. In continuation to the previous study, we have shown interest to isolate the pure constituents responsible for the above mentioned pharmacological action. An attempt was made to isolate the purified compounds responsible for anti-diabetic activity using column chromatography technique with ETLR. The fraction “D” from ETLR showed strong anti-diabetic activity on a par with the standard drug metformin. To ensure the compounds responsible for anti-diabetic activities associated with “D” respectively, In addition a column chromatographic analysis was carried out with “D” using various solvent systems. We isolated one compound named as LR-1 from the column which were amorphous powders with decomposition point; however LR-1 was phenolic compound nature (Flavonoids) confirmed by spectral analysis. At present, the exact Mechanism of action of the isolated fraction of LR-1 is not yet known and will be the subject of further studies.
2021 Copyright OAT. All rights reserv
The authors confirm that this article content has no conflicts of interest.
- Croteau R (1981) In biosynthesis of Isoprenoid compounds. Wiley, New York 1: 225.
- Mann J (1992) Murder, magic, and medicine. Oxford university press, Oxford, UK 111.
- Ou SY, Luo YL, Huang CH, Jackson M (2009) Production of coumaric acid from sugarcane bagasse Inn. Food Sci Emerg Tech 10: 253–259.
- Croteau R, Kutchan TM, Lewis NG (2000) Natural products (secondary metabolites). In B. Buchanan W. Gruissem, Joneas R [eds] Biochemistry and Molecular Biology of Plants. American Society of Plant Biologists, Rockville MD, 1250–1268.
- Newman DJ, Cragg GM, Snader KM (2000) The influence of natural products upon drug discovery. Nat Prod Rep 17: 215–234.
- Viktorin M, Sartorius AG (1999) One hundred year anniversary of aspirin. The drug extracted from the willow bark, Gottingen, Germany. Labor Praxis 23: 82–85.
- Harbone JB (1982) Phytochemical methods. Chapman & Hall, New York.
- Venkatesan N, Anton Smith A (2014) Effect of active fraction isolated from the leaf extract of Leptadenia reticulata on plasma glucose concentration and lipid profile in streptozotocin-induced diabetic rats. Chin J Nat Med 12: 0455–0460. [Crossref]
- Venkatesan N, Anton Smith A (2013) Effect of active fraction isolated from the leaf extract of Dregea volubilis [Linn.] Benth on plasma glucose concentration and lipid profile in streptozotocin induced diabetic rats. Springer Plus 2: 394. [Crossref]