Background: The optimal hemoglobin (Hb) target in patients with chronic kidney disease (CKD) treated with erythropoietin (EPO) has not been established. The prevalent view is that normalization of Hb increases the risk of death and cardiovascular (CV) events.
Methods: The impact of baseline hematocrit (Htc) on survival and CV complications was evaluated in 1591 hemodialysis patients treated with EPO. Patients were classified into five Htc groups: Group 1: < 30%; Group 2: ≥ 30-35%; Group 3: > 35-40%; Group 4: > 40-45%; Group 5: > 45%. End-points were all-cause, CV, and coronary mortality, and major CV events.
Results: Patients with lower Htc (< 30%) had a reduced survival compared to patients with the higher (> 45%) Htc (p=0.009, HR=2.02, % CI 1.19–3.42). Age (HR 1.03 %CI 1.02–1.04 p=0.0001), diabetes (HR 1.99, %CI 1.56–2.35 p=0.0001), associated CV disease (HR 1.63 %CI 1.28–1.79 p=0.0001), left ventricular mass index (HR 1.003 %CI 1.001–1.003 p=0.004), and Htc < 30% (HR 1.92 %CI 1.03-3.57 p=0.039) were the independent predictors of all-cause mortality. The incidence of CV and coronary death and CV events did not differ among groups.
Conclusion: Normal or above-normal Htc was associated with better survival compared to Htc<30% in patients treated with EPO, suggesting that complete correction of anemia may not be harmful in some selected groups of patients.
Anemia is associated with increased mortality in patients with advanced chronic kidney disease (CKD) [1]. It has been shown that patients on dialysis with hematocrit (Htc) lower than 20% have a reduced survival rate [2].
Partial correction of anemia by erythropoietin (EPO) and its analogs improves quality of life and reduces morbidity and mortality in patients with CKD [3-5]. On the other hand, normalization of hemoglobin (Hb) level has been related to increased mortality and/or cardiovascular (CV) complications by some authors [6-9] but not by others [1, 10-12]. Current KDIGO guidelines [13] indicate that a target Hb level of 9.5–11.5 g/dL (corresponding to Htc 30% to 35%) is preferable in CKD patients treated with EPO, but that view is not yet considered definitive. The European Best Practice Guidelines [14] suggest that Hb values of 11–12 g/dL should be generally sought. These results have raised the question of what is the optimal Hb target associated with lower CV and death risk.
The purpose of this retrospective work was to verify the impact of graded baseline Htc levels on mortality and CV events in hemodialysis patients on the waiting list for renal transplantation and being treated regularly with EPO. We reviewed data prospectively from a large registry (the KiHeart cohort) of CKD patients evaluated in our service who were on the waiting list for renal transplantation.
This work was performed according with the postulates of the Helsinki declaration, and all patients provided a signed informed consent. This was a single-center observational study of data collected prospectively in 1591 adult (>18 years old) hemodialysis patients treated with EPO on a regular basis. Patients were being considered to receive their first kidney graft from a deceased donor at the Renal Transplant Unit, Division of Urology, University of São Paulo Medical School and were referred to the Heart Institute (InCor) for cardiovascular assessment before being formally included on the waiting list. All patients were on dialysis and had been treated with EPO for at least three months without major complications, such as allergic reactions or aplastic anemia. The starting dose of EPO was 4000 units 3 times/week. EPO was administered regularly to all individuals according to the protocols of different dialysis centers without interference by the investigators. All individuals received concomitant treatment with iron and pholate.
A prespecified comprehensive cardiovascular investigation was performed, as previously reported [15,16]. Patients underwent 12-lead resting EKG and transthoracic echocardiography as part of their evaluation. Noninvasive testing for CAD with dipyridamole/adenosine myocardial stress testing by SPECT with Tc-99m Sestamibi was performed in patients with obstructive coronary artery disease (CAD), symptoms of CAD, and in asymptomatic subjects with risk factors for CAD. Patients having noninvasive testing suggestive of CAD or multiple (more than one) risk factors, like age ≥50 years; diabetes, types 1 or 2; or having CVD, such as angina, previous myocardial infarction or stroke, left ventricular dysfunction, or extracardiac atherosclerosis, were eligible for coronary angiography. Significant CAD was arbitrarily defined as luminal stenosis ≥ 70% in one or more epicardial arteries or a 50% narrowing of a left main coronary artery by visual estimation from 2 independent experts.
Patients had been treated by maintenance hemodialysis performed in 4-hour sessions, 3 times/week using a bicarbonate bath. Patients were maintained on statins, aspirin, ACE inhibitors (or angiotensin receptor blockers), and b-blockers, regardless of symptoms or results of evaluation, according to current guidelines for secondary prevention of cardiovascular events [17] and were seen at least 2 times/year in our service. Censored events were verified during clinical visits, by telephone, or electronic mail. No individual was lost to follow-up. Patients were followed from the time of study inclusion until death, occurrence of CV events, or renal transplantation.
The primary end-point was all-cause mortality. Secondary end-points were cardiovascular (myocardial infarction, sudden death, stroke, and heart failure) and coronary (myocardial infarction, sudden death, and death associated with coronary intervention) death, and the incidence of combined major CV events (myocardial infarction, unstable angina, sudden death, stroke, heart failure, and coronary or peripheral vascular intervention).
Patients were classified into 5 groups according with the baseline hematocrit level: Group 1: Htc < 30%; Group 2: Htc ≥ 30-35%; Group 3: Htc> 35-40%; Group 4: Htc > 40-45%; Group 5: Htc > 45%.
Statistical analysis
Values are expressed as means, standard deviation of the means, medians, and percentages. For analysis of the data, we used the SPSS statistical program (SPSS Statistics, version 20.0; IBM, Armonk, NY). Univariate analysis was performed with chi-square testing, Student t test, A-NOVA, Mann-Whitney test, or median test, as indicated. Survival curves were constructed using the Kaplan-Meier method and compared with the log-rank test. Cox proportional hazards model was used to verify the variables independently associated with outcomes. The variables selected for multivariate Cox model were age, sex, dyslipidemia, smoking, diabetes, hypertension, angina, associated CVD, left ventricular mass index, and Htc group. A p value of less than 0.05 was considered significant.
The median observation time was 39.3 months for the whole population. Table 1 shows the main clinical and laboratory characteristics of the groups. The relatively high prevalence of diabetes and associated CV and coronary disease in all groups is remarkable. Patients with the lower level of Htc (Group 1) had an increased prevalence of hypertension and higher systolic and diastolic blood pressures, serum triglycerides, and left ventricular mass index. Patients in that group also had a tendency to be younger and were predominantly females. On the other hand, patients with the higher Htc had less hypertension and reduced systolic and diastolic blood pressures and left ventricular mass index. The groups were well balanced in terms of race and prevalence of smokers, presence of diabetes, presence of angina, associated cardiovascular disease, time on dialysis, body mass index, creatinine, total-cholesterol, glucose, reduced left ventricular ejection fraction, altered myocardial scan, coronary artery disease, and coronary intervention.
Table 1. Characteristics of the study groups (n = 1592).
Variable |
Hct < 30%
Group 1
n=132 (8%) |
Hct ≥ 30–35%
Group 2
n=476 (30%) |
Hct > 35–40%
Group 3
n=564 (35%) |
Hct > 40–45%
Group 4
n=331 (21%) |
Hct > 45%
Group 5
n=89 (6%) |
p |
Age, years |
52.5 ± 11.1 |
54.0 ± 10.4 |
54.9 ± 10.8 |
55.4 ± 10.3 |
53.5 ±10.8 |
0.051 |
Males, n (%) |
82 (62) |
289 (61) |
353 (62) |
225 (68) |
66 (74) |
0.058 |
White, n (%)
Afro-Brazilian, n (%)
Oriental, n (%) |
84 (64)
43 (33)
5 (3) |
334 (70)
111 (23)
31 (7) |
402 (71)
138 (24)
34 (5) |
233 (70)
88 (27)
10 (3) |
54 (61)
29 (33)
6 (6) |
0.082 |
Smokers, n (%) |
43 (33) |
135 (28) |
180 (32) |
87 (26) |
35 (39) |
0.34 |
Diabetes, n (%) |
55 (42%) |
203 (43) |
244 (43) |
138 (42) |
40 (45) |
0.44 |
Hypertension, n (%) |
112 (85) |
398 (84) |
454 (80) |
269 (81) |
27 (70) |
0.03; 1X5, 2X5 |
Angina, n (%) |
22 (17) |
83 (17) |
85 (15) |
43 (13) |
8 (9) |
0.22 |
CV disease, n (%) |
59 (45) |
217 (46) |
219 (39) |
147 (44) |
44 (49) |
0.14 |
Time on dialysis, months (median) |
26.1 |
22.0 |
18.5 |
22.0 |
20.0 |
0.29 |
BMI kg/m2 |
25.7 ± 5.3 |
25.6 ± 4.9 |
25.9 ± 4.5 |
25.6 ±4.5 |
24.9 ± 4.8 |
0.36 |
SBP, mm Hg |
165 ± 30 |
161 ± 30 |
160 ±31 |
158 ± 29 |
148 ± 33 |
0.001, 1x5, 2x5, 3x5, 4x5 |
DBP, mm Hg |
94 ± 17 |
93 ± 16 |
93 ± 16 |
92 ± 16 |
88 ± 18 |
0.03; 1x5, 3x5 |
Creatinine |
8.5 ± 3.0 |
8.3 ± 3.9 |
8.6 ±3.0 |
8.7 ± 2.9 |
9.3 ± 3.3 |
0.06 |
T-cholesterol |
169 ± 52 |
171 ± 48 |
173 ± 46 |
174 ± 46 |
176 ± 74 |
0.66 |
Triglycerides |
128 ± 70 |
160 ± 132 |
166 ± 121 |
165 ± 104 |
159 ± 85 |
0.02; 1x3, 1x4 |
Glucose |
118 ± 63 |
122 ± 83 |
117 ± 60 |
117 ± 59 |
119 ± 57 |
0.75 |
LV mass index |
172 ± 56 |
157 ± 51 |
148 ± 53 |
139 ± 45 |
134 ± 60 |
0.001, 1x3, 1x4, 1x5, 2x4, 2x5 |
LV EF < 40%, n (%) |
15 (16) |
45 (12) |
69 (17) |
41 (12) |
15 (17) |
0.31 |
Altered myocardial scan, n (%) |
42/108 (39) |
133/417 (32) |
153/476 (32) |
87/331 (26) |
27/89 (30) |
0.47 |
Coronary artery disease, n (%) |
41/85 (48) |
156/286 (55) |
182/334 (54) |
115/214 (54) |
40/59 (68) |
0.11 |
Coronary intervention, n (%) |
8/41 (22) |
38/156 (26) |
49/182 (29) |
36/115 (34) |
19/40 (48) |
0.07 |
The incidence of death by any cause is shown in Figure 1. Patients with lower Htc (< 30%) had significantly reduced survival compared to patients with higher (> 45%) Htc (p=0.009, HR=2.02, %CI 1.19 – 3.42).
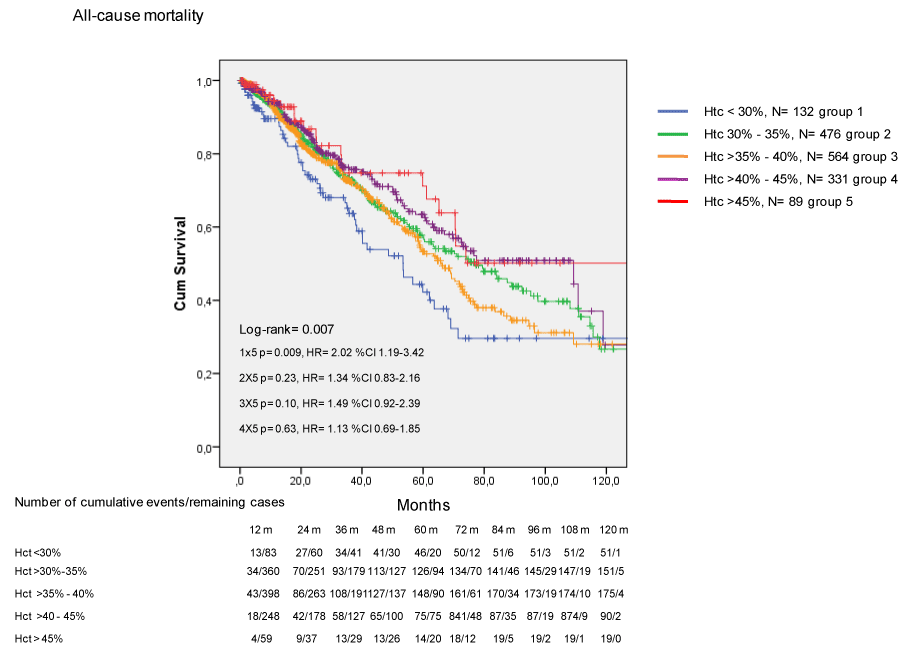
Figure 1. Incidence of death by any cause in CKD patients treated with EPO.
The incidence of CV death (Figure 2) and coronary death (Figure 3) were similar among groups. Finally, Htc levels were not related to the occurrence of combined major CV events (Figure 4).
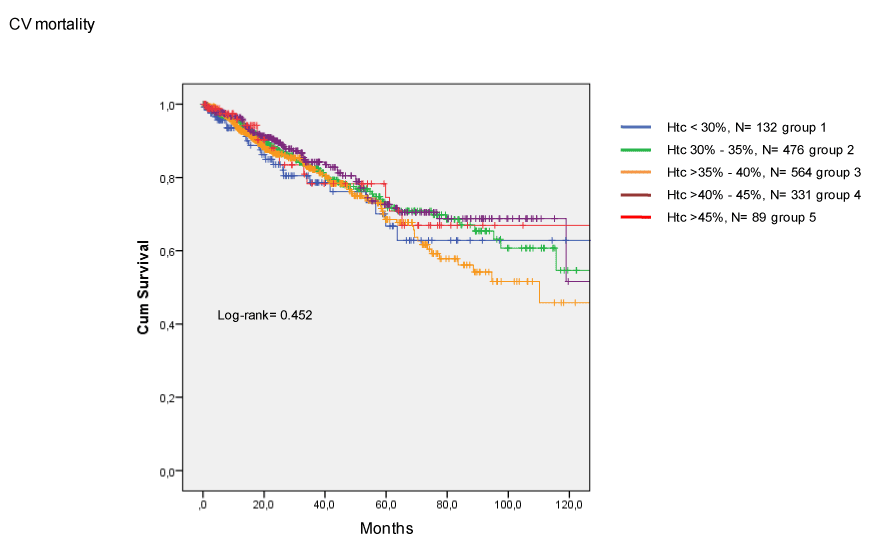
Figure 2. Incidence of cardiovascular death in CKD patients treated with EPO.
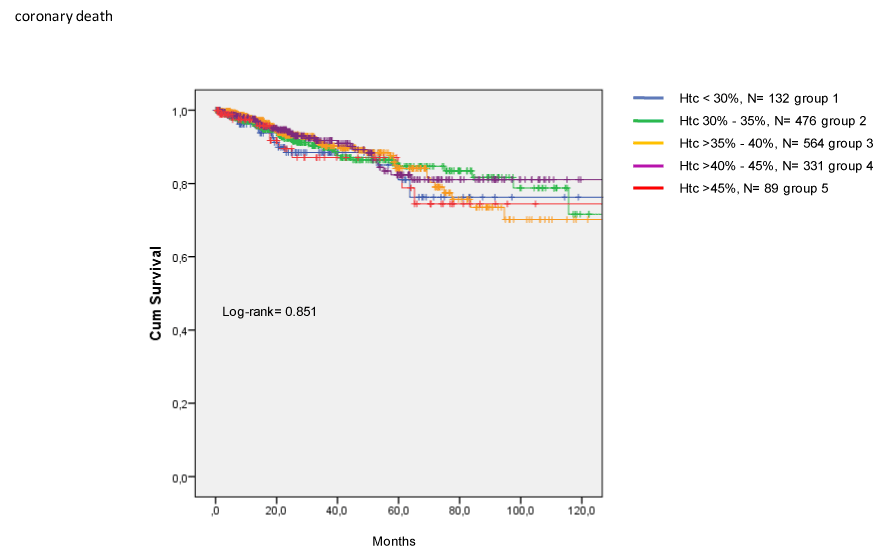
Figure 3. Incidence of coronary death in CKD patients treated with EPO.
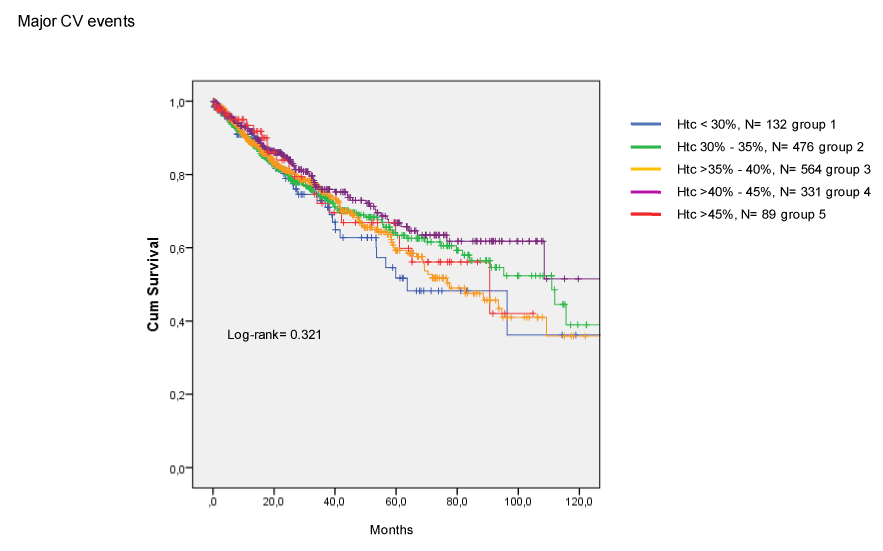
Figure 4. Incidence of cardiovascular events in CKD patients treated with EPO.
On the multivariate analysis (Cox proportional model), age, diabetes, CV disease, left ventricular mass index, and Htc < 30% were the independent predictors of all-cause mortality (Table 2).
Table 2. Variables associated with all-cause mortality in CKD patients on dialysis (Cox proportional model)
|
Variable
|
Hazard ratio
|
Confidence interval
|
p
|
|
Age, years
|
1.03
|
1.018-1.043
|
0.0001
|
|
Sex, male
|
0.979
|
0.756-1.269
|
0.87
|
|
Dyslipidemia
|
1.013
|
0.805-1.276
|
0.91
|
|
Smoking
|
1.056
|
0.815-1.368
|
0.68
|
|
Diabetes
|
1.996
|
1.564-2.546
|
0.0001
|
|
Hypertension
|
1.312
|
0.960-1.795
|
0.09
|
|
CV disease
|
1.629
|
1.281-1.795
|
0.0001
|
|
Angina
|
1.154
|
0.844-1.576
|
0.37
|
|
LV mass index
|
1.003
|
1.001-1.005
|
0.005
|
|
Hematocrit
|
1.922
|
1.035-3.570
|
0.039
|
Table 3 shows the discrete causes of cardiovascular and noncardiovascular deaths according to different levels of Htc. Because of the small number of events per group, no statistical analysis was attempted. The incidence of CV deaths was the same in patients with lower (<30%) and higher (>45%) Htc, while the incidence of noncardiovascular death and of all-cause mortality appear to be reduced in patients with the higher Htc.
Table 3. Discrete causes of cardiovascular and noncardiovascular death in hemodialysis patients according with different levels of hematocrit.
|
Cardiovascular deaths
|
|
|
Htc < 30%
n = 132
Group 1
|
Htc ≥ 30-35%
n = 476
Group 2
|
Htc > 35-40%
n = 564
Group 3
|
Htc > 40-45%
n = 331
Group 4
|
Htc > 45%
n = 89
Group 5
|
|
Myocardial infarction, n (%)
|
2 (1.5)
|
15 (3.2)
|
15 (2.7)
|
7 (2.1)
|
5 (5.6)
|
|
Sudden death, n (%)
|
8 (6.1)
|
32 (6.7)
|
33 (5.8)
|
13 (3.9)
|
4 (4.5)
|
|
Stroke, n (%)
|
8 (6.1)
|
14 (3.9)
|
23 (4.1)
|
7 (2.1)
|
3 (3.4)
|
|
Heart failure, n (%)
|
1 (0.75)
|
9 (1.9)
|
9 (1.6)
|
5 (1.5)
|
1 (1.1)
|
|
Others,* n (%)
|
2 (1.5)
|
14 (2.9)
|
20 (3.5)
|
5 (1.5)
|
1 (1.1)
|
|
Total
|
21 (16)
|
84 (18)
|
110 (19)
|
36 (11)
|
14 (16)
|
|
Noncardiovascular deaths
|
|
Infection, n (%)
|
7 (5.3)
|
33 (6.9)
|
43 (7.6)
|
10 (3.0)
|
2 (2.2)
|
|
Bleeding, n (%)
|
1 (0.75)
|
3 (0.6)
|
2 (0.3)
|
5 (1.5)
|
0 (0.0)
|
|
Hepatic failure, n (%)
|
2 (1.5)
|
2 (0.4)
|
1 (0.2)
|
0 (0.0)
|
0 (0.0)
|
|
Cancer, n (%)
|
2 (1.5)
|
2 (0.4)
|
4 (0.4)
|
0 (0.0)
|
0 (0.0)
|
|
Others, ** n (%)
|
4 (3.0)
|
9 (1.9)
|
6 (1.1)
|
7 (2.1)
|
2 (2.2)
|
|
Total, n (5)
|
16 (12)
|
49 (10)
|
56 (10)
|
22 (6.6)
|
4 (4.5)
|
|
Total
|
|
Death by any cause, n (%)
|
37 (28)
|
133 (28)
|
166 (29)
|
58 (18)
|
18 (20)
|
* gangrene, arrhythmia, pulmonary edema, pulmonary embolism, aortic dissection
** trauma, uremia, exogenous intoxication, pancreatitis, emphysema, surgery-related.
In this study of renal transplant candidates who underwent a comprehensive CV evaluation we found that Htc < 30% was a predictor of all-cause mortality and that this effect was mainly related to differences between the higher and lower Htc strata. This work also provides a detailed description of CV characteristics of the subjects, frequently lacking in previous investigations of renal transplant candidates treated with EPO.
The negative impact of anemia on prognosis of patients with CKD is a well-known phenomenon and is usually attributed to CV events, such as heart failure, and to nutritional factors [1]. In the present investigation, we observed that left ventricular mass index increased with the reduction in Htc and was also an independent predictor of mortality together with age, diabetes, associated CV disease, and Htc group. However, low Htc predicted all-cause mortality but not CV mortality or CV events, suggesting that non-CV factors, not measured in this investigation, were also important.
Although the optimal target level of Hb in patients on dialysis is controversial, there is no evidence that complete correction of anemia will improve survival or reduce CV events in this set. On the contrary, normal or near-normal Hb was associated with a poorer prognosis, at least in select populations, such as in patients with diabetes and/or clinically significant cardiovascular disease [6]. Congruent with these views, the KDIGO [13] and European [14] guidelines consider that a target Hb higher than 13 g/dL is not recommended in CKD patients receiving EPO.
Therefore, our finding that normal and above-normal Htc was associated with better survival is somehow surprising. Indeed, these patients had a significantly lower mortality compared to patients with Htc < 30%. We also did not find evidence linking higher Htc to either CV events or CV deaths.
These results must be interpreted with caution. It is possible that patients with higher baseline Htc were those with better general health and, therefore, with a higher possibility of survival. Both the higher Htc and survival might be explained by their better clinical condition at the initiation of the study. The lower baseline systolic and diastolic blood pressures observed in patients with Htc > 45% supports this interpretation. Even so, it remains a fact that Htc was an independent predictor of prognosis after taking into account other confounding factors. A second possibility is that EPO could be a cause of death. It has been proposed that the higher risk of adverse events in dialysis patients may not be related to the Hb level per se but to the use of a high dose of EPO [10, 18]. In the present study, patients with lower Htc could be those in need of higher doses of EPO, as reported by Moreno et al. [10]. Unfortunately, we do not have information regarding the dose of EPO used in any of the groups to test that hypothesis. Finally, most data showing a negative impact of anemia correction in CKD are at least 10 years old. The widespread use of cardioprotective medication, as well as improvements in dialysis technology may have positively interfered with the results in patients with higher Htc since that time.
2021 Copyright OAT. All rights reserv
In conclusion, we found that normal or above-normal Htc was associated with better survival compared to survival in CKD patients with Htc < 30% who were on dialysis receiving EPO. The data suggest that complete correction of anemia may not be harmful and does not increase the incidence of CV death or CV events, at least in low-risk patients. On the other hand, it is not possible to conclude that correction of anemia was protective.
This was a retrospective single-center study. Htc was measured only at baseline, and the dose of EPO could not be assessed. Although the CV investigation was comprehensive, we did not include non-CV factors that could be relevant. Vascular access clotting was not evaluated. The number of patients in higher Htc strata was relatively small compared to the number of patients in the other groups.
Funded by The Zerbini Foundation, São Paulo, Brazil.
The authors declare no conflicts of interest.
- Madore F, Lowrie EG, Brugnara C, Lew NL, Lazarus JM, et al. (1997) Anemia in hemodialysis patients: variables affecting this outcome predictor. J Am Soc Nephrol 8: 1921-1929. [Crossref]
- Lowrie EG, Lew NL. (1990) Death risk in hemodialysis patients: the predictive value of commonly measured variables and an evaluation of death rate differences between facilities. Am J Kidney Dis 15: 458-482
- Paoletti E, Cannella G (2006) Update on erythropoietin treatment: should hemoglobin be normalized in patients with chronic kidney disease? J Am Soc Nephrol 17: S74-77. [Crossref]
- Xia H, Ebben J, Ma JZ, Collins AJ (1999) Hematocrit levels and hospitalization risks in hemodialysis patients. J Am Soc Nephrol 10: 1309-1316. [Crossref]
- Collins AJ, Li S, St Peter W, Ebben J, Roberts T, et al. (2001) Death, hospitalization, and economic associations among incident hemodialysis patients with hematocrit values of 36 to 39%. J Am Soc Nephrol 12: 2465-2473. [Crossref]
- Besarab A, Bolton WK, Browne JK, Egrie JC, Nissenson AR, et al. (1998) The effects of normal as compared with low hematocrit values in patients with cardiac disease who are receiving hemodialysis and epoetin. N Engl J Med 339: 584-590. [Crossref]
- Singh AK, Szczech L, Tang KL, Barnhart H, Sapp S, et al. (2006) Correction of anemia with epoetin alfa in chronic kidney disease. N Engl J Med 355: 2085-2098. [Crossref]
- Phrommintikul A, Haas SJ, Elsik M, Krum H. (2007) Mortality and target haemoglobin concentrations in anaemic patients with chronic kidney disease treated with erythropoietin: a meta-analysis. Lancet 369: 381-388. [Crossref]
- Palmer SC, Navaneethan SD, Craig JC, Johnson DW, Tonelli M, et al. (2010) Meta-analysis: erythropoiesis-stimulating agents in patients with chronic kidney disease. Ann Intern Med 153: 23-33. [Crossref]
- Moreno F, Sanz-Guajardo D, López-Gómez JM, Jofre R, Valderrábano F. (2000) Increasing the hematocrit has a beneficial effect on quality of life and is safe in selected hemodialysis patients. Spanish Cooperative Renal Patients Quality of Life Study Group of the Spanish Society of Nephrology. J Am Soc Nephrol 11: 335-342. [Crossref]
- Drüeke TB, Locatelli F, Clyne N, Eckardt KU, Macdougall IC, et al. (2006) Normalization of hemoglobin level in patients with chronic kidney disease and anemia. N Engl J Med 355: 2071-2084. [Crossref]
- Brookhart MA, Schneeweiss S, Avorn J, Bradbury BD, Liu J, et al. (2010) Comparative mortality risk of anemia management practices in incident hemodialysis patients. JAMA 303: 857-864. [Crossref]
- (2012) KDIGO Clinical practice guidelines for anemia in chronic kidney disease. Kidney Int Suppl 2: 331-335.
- Locatelli F, Covic A, Eckardt KU, Wiecek A, Vanholder R, et al. (2009) Anaemia management in patients with chronic kidney disease: a position statement by the Anaemia Working Group of European Renal Best Practice (ERBP). Nephrol Dial Transplant 24: 348-354. [Crossref]
- Galvão De Lima JJ, Wolff Gowdak LH, de Paula FJ, Franchini Ramires JA, Bortolotto LA. (2012) The role of myocardial scintigraphy in the assessment of cardiovascular risk in patients with end-stage chronic kidney disease on the waiting list for renal transplantation. Nephrol Dial Transplant 27: 2979-2984. [Crossref]
- De Lima JJ, Gowdak LH, de Paula FJ, Muela HC, David-Neto E, et al. (2015) Coronary events in obese hemodialysis patients before and after renal transplantation. Clin Transplant 29: 971-977. [Crossref]
- Smith SC Jr, Allen J, Blair SN, Bonow RO, Brass LM, et al. (2006) AHA/ACC guidelines for secondary prevention for patients with coronary and other atherosclerotic vascular disease: 2006 update endorsed by the National Heart, Lung, and Blood Institute. Circulation 47: 2130-2139. [Crossref]
- Rosner MH, Bolton WK (2008) The mortality risk associated with higher hemoglobin: is the therapy to blame? Kidney Int 74: 695-697. [Crossref]