Abstract
Background
Category fluency is a sensitive measure of cognitive integrity and is known to involve both frontal and temporal cortical areas. Network graph analysis is a technique used to analyze relationships between nodes and edges and calculate metrics such as path lengths between nodes and clustering coefficients.
Objectives
To investigate network growth and preferential attachment in a network model of category fluency.
Method
Category fluency results (“animals” recorded over 60 seconds) from subjects (N=374) contacted via telephone were converted to undirected network graphs of all unique neighbors and network parameters were calculated. Growth was also modeled using an extended cognitive network model. Random subsamples of people or of node pairs were used to model network growth and study preferential attachment.
Results
The final network had 275 nodes and 2035 edges. The network showed scale free and small world properties, which change with network size. Both methods of modeling connectivity showed exponential growth of nodes and edges as increasing fractions of the complete network were sampled. Preferential attachment was demonstrated by using Newman’s method.
Conclusions
Network growth patterns show a sharp transition to scale free and small world properties with early network growth. Networks based on category fluency show preferential attachment and appear to be a valid model for studying network dynamics based on cognitive output.
Key words
category fluency, network growth, preferential attachment, graph theory
Introduction
Complex networks consisting of nodes and edges have received increasing attention as a means of understanding complex relationships in the natural world. In addition to the analysis of static networks, issues of network growth and the concept of “preferential attachment” have been studied in relation to many scale free networks [1-3]. Findings regarding composite networks derived from category fluency testing in normal older individuals and subjects with Alzheimer’s disease have been previously reported [4].
Measures of category fluency, a form of verbal fluency, are a standard part of neuropsychological testing, and verbal fluency may be tested either as lexical fluency (such as words beginning with the letter “F”) or semantic fluency, such as naming of animals, vegetables or tools. Animal and vegetable naming has been incorporated into the standardized neuropsychological battery of the Uniform Data Set (UDS) adopted by the National Institutes of Health [5] and a large body of literature has been devoted to its development in childhood and adult norms [6,7]. In addition, verbal fluency output reflects the accessibility of “semantic space,” representations of which are closely aligned with our understanding of how semantic information is organized at the neuronal level, particularly in left hemisphere structures, and how this is modified in those at risk for dementia, with Mild Cognitive Impairment (MCI), or mild to moderate Alzheimer’s disease [8-13].
The networks derived from animal naming category fluency tests are constructed by combining the results from all group members. Nodes are all named animals, connected by edges when the two nodes are named directly in succession by at least one individual [4]. This is analogous to networks created from controlled word association data, or Roget’s thesaurus [14].
In the present study, we model network growth, defined as the addition of new nodes and edges to existent ones. Since the data is derived from individuals, we model network growth as a function of adding subjects. We compare this to network growth modeled as the addition of nodes through the selection of random pairs of nodes (animals named in succession), chosen from the pool of all available responses. We also examine the emergence of scale free properties with network growth and whether preferential attachment occurs in category fluency networks, in accordance with the Barabasi-Albert (BA) model [1].
Methods
Subjects and sampling
This study is based on data from the Cleveland Area Telephone Survey (CATS), a population-based study of cognitive aging and dementia initiated in 2002. Telephone interviews were used to gather cognitive data on a sample of approximately 500 community-dwelling adults, age 65 and older, living in Cuyahoga County in Northeastern Ohio. The study was mainly designed to examine the feasibility of generating a representative sample for future epidemiologic studies involving assessment of memory and cognition in older adults. Study procedures associated with this project were reviewed and approved by the Institutional Review Board for Human Investigation of University Hospitals of Cleveland (IRB 07-02-02). Subjects were exempted from having to sign a written consent form.
The target population consisted of residents of households in Cuyahoga County with listed telephone numbers who were age 65 and older in 2002. The population was limited to households with listed numbers for two reasons: (1) the households’ addresses could be obtained so that a letter describing the study could be sent before calling them to conduct the telephone interview; (2) knowledge of the telephone number and the name of the householder listed in the telephone directory made it possible to select a sample of households that were known or expected to have at least one resident who was 65 or older. Households expected to have at least one person 65 or older were used to reduce the need for extensive screening for older persons that would be required if a random-digit-dialed survey of all households with telephones had been conducted.
Survey Sampling, Inc. provided a randomly selected list of households that were likely to meet our inclusion criteria. Survey Sampling, Inc. gathers data on age, education, race, gender, and income through contests, warranty cards, phone solicitation, and other means. For households with missing data, regression models are used to estimate whether or not there was someone 65 or older in the household. Each potential subject first received a letter describing the project and soliciting participation. Potential subjects were told that they would soon receive a telephone call from a research assistant (RA) working at the University Memory and Aging Center, affiliated with University Hospitals of Cleveland and Case Western Reserve University. Some time later, RAs, trained in basic interviewing techniques, neuropsychological test administration, data management, and subject confidentiality, telephoned the households. After a brief introduction, the RA asked if there was anyone age 65 or older living in the household. If there was more than one person age 65 or older in the household, the RA asked for the householder who was oldest, next oldest, next youngest, or youngest, depending on the number of persons 65 or older and a pre-specified randomization scheme. After the selection of the subject, oral consent was obtained and the RA proceeded with the survey. Before responding to the questions, participants were asked whether they had hearing impairments. Subjects who reported hearing impairments and who had hearing devices were encouraged to use them. The interviewer asked if there were others in the room or if a television or radio was on. If so, the subject was asked to go to a quiet room with a telephone to be interviewed.
Of the 1,897 households we attempted to contact, 350 were ineligible (e.g., no one 65 or older, undeliverable letter, or potential subject deceased or too impaired). Of the remaining 1,547 households, interviews were conducted in 499 of them, yielding a response rate of 32.3%. This was a conservative estimate because it was assumed that the 249 households where there was no answer after three calls may have contained eligible subjects. Our completion rate - indicating how successful we were in completing an interview when an eligible household was contacted - was 38.7%.
Among subjects who participated in the study, the mean age was 75.7 years (SD = 6.4); 62.2% were female; and 83.0% were Caucasian (most of the minority participants were African Americans). The mean years of education attained by subjects in the study sample was 13.2 (SD = 3.0). Approximately 18% had less than 12 years of education, 36% had a high school diploma, and 45% had more than 12 years of education (values do not sum to 100% due to rounding).
According to data gathered for the 2000 U.S. Census, 15% of persons living in Cuyahoga County were 65 years and older (n = 217,177). Among these, 60.8% were women and 48.0% were Caucasian. In terms of education, approximately 35% of residents of Cuyahoga County, age 65 and older, had less than 12 years of education, 34% had a high school diploma, and 31% had more than 12 years of education. Thus, when comparing the older population in Cuyahoga County to our study sample, we see that our study sample over-represented Caucasians and persons with higher education.
Measures
Verbal fluency: Verbal fluency was assessed through “animal naming,” in which subjects are asked to name as many animals as possible in one minute. The animals named were transcribed at the time of interview, and later entered into computerized databases and checked by two raters for quality assurance. Verbal fluency scores reflect the total number of animals named.
Graph construction: In order to prepare the network graph for each group, data was pooled across all individuals participating in CATS; the network graph represents all of the unique connections made across the individuals of the group, as previously reported [4].
For example, if three individuals gave results of cat, dog, elephant and cat, dog, horse, elephant and dog, cat, elephant, moose the resultant graph would have five nodes and six undirected edges of cat-dog, dog-elephant, dog-horse, horse-elephant, cat-elephant, and elephant-moose (Figure 1). The Cytoscape 2.5.1 visualization program was used to help manage network graph data and to check for data quality [15]. Network parameters were obtained with the Cytoscape plugin Network analyzer a program for graph analysis [16]. Statistical analysis of topological results, i.e. comparisons of group cluster coefficients, mean degree and average path length was performed in SPSS for Mac 16.0 [17].
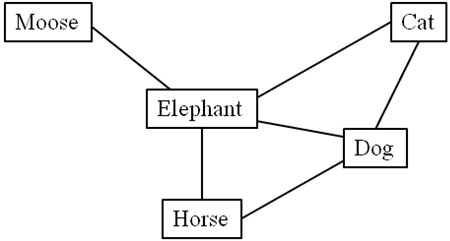
Figure 1. Example of graph construction with the consecutive naming approach. If three individuals gave results of (cat, dog, elephant) and (cat dog, horse, elephant) and (dog, cat, elephant, moose), the resultant graph would have five nodes and six undirected edges of cat-dog, dog-elephant, dog-horse, horse-elephant, cat-elephant, and elephant-moose. The highest node degree is Elephant with 4 edges connecting it to other nodes. The average path length for Elephant is 1.0 since it is one edge to every other node. The characteristic path length for horse would be (1+1+2+2)/4=1.5
Network definitions: Standard network definitions for number of nodes (N), number of edges (K), mean node degree (k), clustering coefficient (cc) and average path length (l) were calculated as detailed in previously published studies [1,4].
Network Growth: To simulate network growth, network topology was examined at 0.5, 0.75, 1, 5, 10, 20, 30, 40, 50, 60, 70, 80, 90, and 100 per cent of final size. Analysis did not show significant differences between choosing random subjects (at the percentages mentioned above) or random pairs of nodes (items mentioned in direct succession by an individual subject) (figure 2); therefore, these results are combined in further analysis.
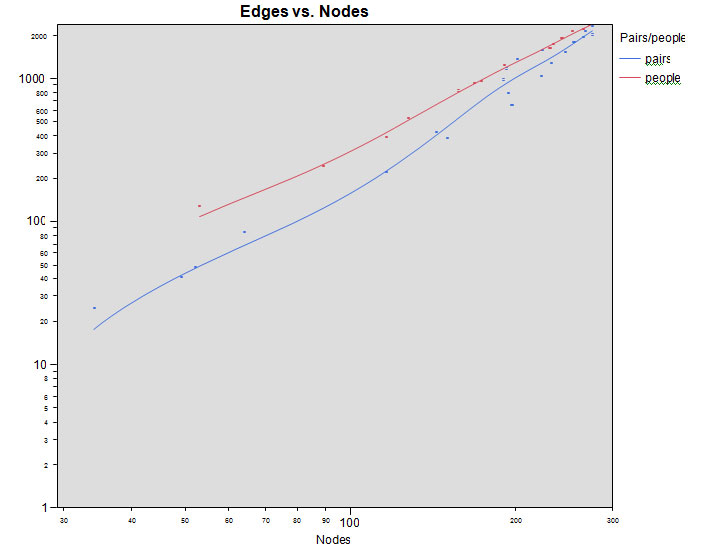
Figure 2. Network growth of nodes and edges. Subsamples are randomly chosen individuals (top) and randomly chosen pairs (bottom) from the full set of category fluency responses.
Preferential attachment: Different models have been used to study the assumption that the likelihood of acquiring new edges increases as the node’s degree increases [1,18,19]. We used a modeling approach based on the calculation of relative probability (Rk) with which a node with degree k acquires a new edge at time t, as described by Newman [20]. In this modeling, if preferential attachment is present, Rk increases linearly with k, whereas in the absence of preferential attachment, Rk is equal to 1 for all k.
Results
Of the eligible participants, category fluency data was available for N = 374. Because of the inter-relationship of network variables, we analyzed network growth to show how these variables change relative to each other, and as a percent of final network size. The complete sample yielded a network of 275 nodes and 2035 edges. The mean node degree was 14.72, mean clustering coefficient 0.44, and characteristic path length 2.526. The slope of the plot of k vs P(k) (the fraction of nodes with degree k) is the scale free exponent -0.79 for the entire population. The small world properties of each graph were evaluated by definitions based on the Watts and Strogatz (1998) model [21]. We used a method based on Bassett and Bullmore (2006) [22] combining path length and clustering coefficients to create a normalized measure for small world properties. Using this method, l = 1.21, g = 8.22 and s = 6.8, where l and g are the ratios of mean path length and clustering coefficient respectively of the network of interest to those of a random network with the same number of nodes, edges and degree distribution; s is defined as the ratio g/l. Based on these definitions, l is expected to be approximately 1, g greater than 1 and s greater than 1 if the network has small world properties.
2021 Copyright OAT. All rights reserv
Evolution of network parameters
In reality, individuals are recruited into a study and results added to a database in what may be considered random order. Therefore, random sampling of subsets of individuals simulates the effects of repeated views of the data as it is collected and as the network “grows”. In figure 3, the changes in network metrics of clustering coefficient, average k and average path length are shown. As the network grows, the clustering coefficient rises above zero and scale free properties emerge. This also corresponds to the development of small world properties (Figure 4) where s >1.
Figure 2 shows the relationship between the number of nodes (N) and edges (K) showing the exponential relationship.
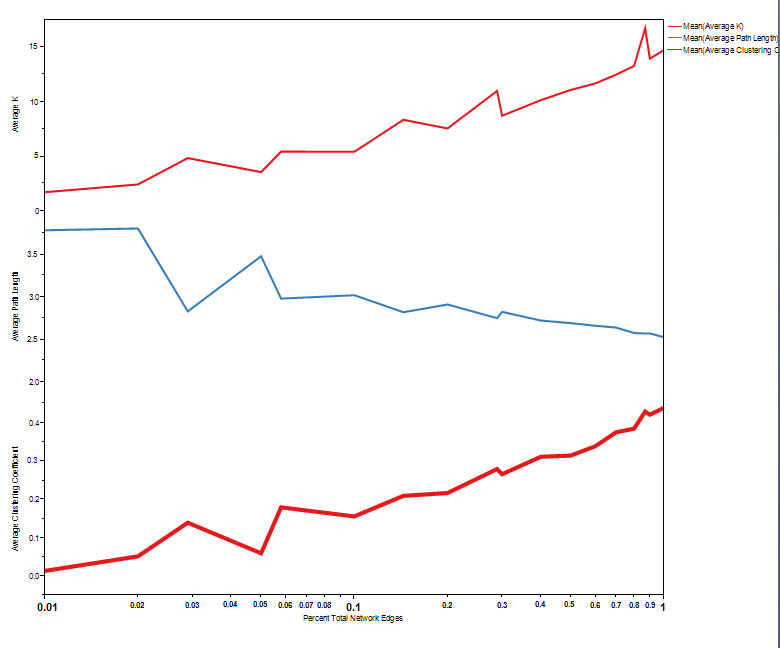
Figure 3. Evolution of network parameters of average k, average path length and average clustering coefficient using the consecutive naming approach
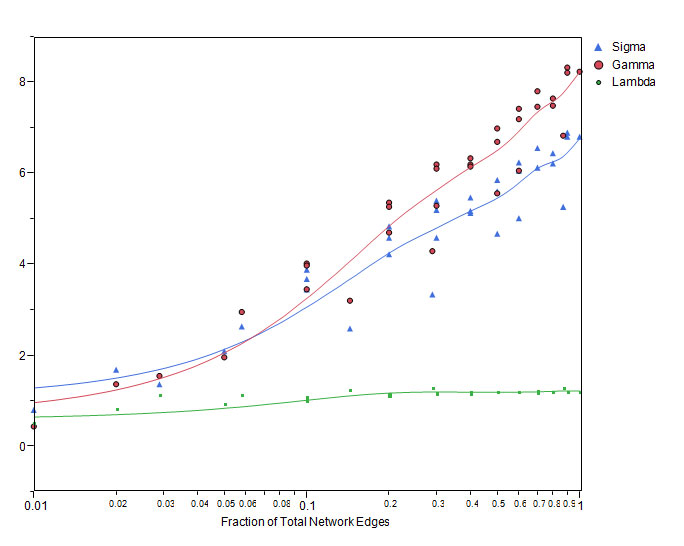
Figure 4. Relation of lambda (ratio of average path length of the graph to that of a random network), gamma (ratio of clustering coefficient of the graph to that of a random network), and sigma (gamma/lambda) to network growth with the consecutive naming approach. For a small world network, lambda is expected to be approximately 1, gamma greater than 1 and sigma greater than 1
Preferential attachment
We studied network growth and preferential attachment by modeling network growth from 20% to 60% of node pairs, and from 60% to 100% of final size. Using the method of Newman [20], the relative probability of new edges shows an increasing linear relationship with k, implying preferential attachment of new edges to nodes with higher k (Figure 5).
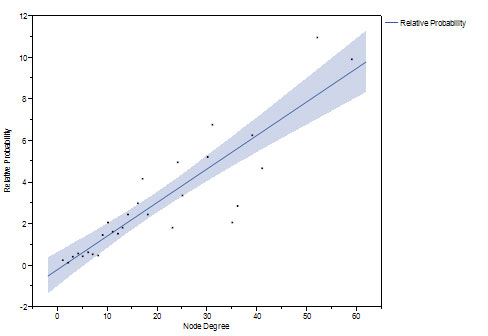
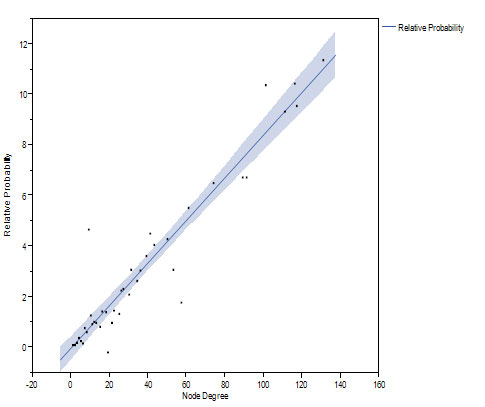
Figure 5. The relative probability of new connection increases linearly as a function of prior number of connections as the network grows from 20 to 60 percent (top) and from 60 to 100 percent (bottom) of the final network.
Discussion
We report on network growth in a large telephone sample of subjects using semantic fluency data from the one minute animal naming test. In our previous study, networks made from category fluency data have been shown to have both scale free and small world properties [4]. Our current study extends these findings by examining the dynamics of network growth based on random subsamples and demonstrates that the category fluency model shows evidence of preferential attachment; small world and scale free properties emerge early and change in a predictable way with network growth.
Category fluency networks are constructed by aggregating data across individuals. This leads to several interesting properties conducive to modeling network growth. The number of individuals included is an important variable in determining network metrics, and allows for subsamples of randomly chosen subjects to model network growth. We also compared use of randomly chosen subjects to randomly chosen node pairs. Use of random nodes yields slightly faster network growth than randomly chosen subjects although they are roughly comparable overall. This may be because of the high redundancy of node pairs such as “cat-dog” or “lion-tiger”, so that each individual yields fewer nodes for network growth than randomly chosen pairs, which reflect the entire underlying distribution.
Goñi et al. [23] developed a modified network construction technique in exploring the semantic organization of the animal category. They utilized a novel statistical framework to account for likelihood of concept-concept associations, and a missing links recovery criterion based on network modularity. Direct comparison of the results from that model with our results is beyond the scope of this paper. In future studies, using a different model such as polymerization model [24,25] to analyze network growth could reveal other properties and provide further insight into underlying mechanisms of recovery of semantic memory.
In the BA model of network growth, preferential attachment to higher degree nodes as nodes and edges are added to the network is central to the emergence of scale free properties. Indirect as well as generalized methods of measuring preferential attachment have been proposed and it has been demonstrated in growth of networks of actors, scientific citations and the Internet [18-20].
One major difference in our model from studies of networks such as the growth of the Internet, actor collaboration and the science citation network [18-20] is our lack of a true time parameter. Our networks ‘grow’ by simulation alone, which may differ in a fundamental way from the growth of networks previously studied. Subjects providing category fluency data are also unaware of the state of the network or even the existence thereof. In networks based on websites connectivity or movie actors’ collaboration, participants are aware that certain sites are highly linked or that a given actor has already collaborated with multiple other individuals. The typical respondent in our study names animals based on individual cognitive processes, but has no knowledge of the responses given by others whose data is also used to create the network model.
Steyvers and Tenebaum [14] and Hills et al. [26] both studied semantic network growth with language acquisition early in life. While these networks show some evidence for preferential attachment in word learning, other mechanisms for semantic language network growth such as “preferential acquisition” may also be operative. Given the likelihood of common items to appear repeatedly by different individuals, the possibility remains that mechanisms other than preferential attachment may be operative in determining network growth and form as individuals are added to the response set.
Conclusion
Abnormalities in category fluency have been reported in many cognitive disorders such as Alzheimer’s disease [4,8-13], primary progressive aphasia form of Frontotemporal dementia [27], Huntington's disease [28], Parkinson's disease [29] and schizophrenia [30] as well as changes with language development and aging [6,7]. Comparisons of network growth in these populations using graph theory measures may disclose important differences in language structure not visible on surface analysis of neuropsychological test scores, and allow for estimation of the degree of semantic access restriction as a function of dementia severity [4,31]. Temporal aspects of the category fluency test [32] such as the inter-item times are also of interest and likely to add additional information about brain processing involved in this task.
Acknowledgments
The authors acknowledge the help of Laura Miodragovic-Senkus, Linda Reichlin, Jason Messer, Taruna Singh and David Meyer in data acquisition, transcription and quality control checking. Dr. Lerner was supported in part by NIA grant P50 AG08012. Dr. Thomas was supported in part by a grant from the Simons Foundation (#259837), by the Council for the International Exchange of Scholars (CIES), and by the National Science Foundation (grant EF-1038677). Dr. Fritsch was supported by supported by a grant from the University Memory and Aging Center Pilot Program (P50 AG08012). The authors have no financial conflict of interest in the preparation, reporting or conclusions drawn from this project.
References
- Albert R, Barabási, AL (2002). Statistical mechanics of complex networks. Reviews of Modern Physics 74: 1-47.
- Jeong H, Tombor B, Albert R, Oltvai ZN, Barabási AL (2000) The large-scale organization of metabolic networks. Nature 407: 651-654. [Crossref]
- Capocci A, Servedio VD, Colaiori F, Buriol LS, Donato D, et al. (2006) Preferential attachment in the growth of social networks: the internet encyclopedia Wikipedia. Phys Rev E Stat Nonlin Soft Matter Phys 74: 036116. [Crossref]
- Lerner AJ, Ogrocki PK, Thomas PJ (2009) Network graph analysis of category fluency testing. Cogn Behav Neurol 22: 45-52. [Crossref]
- Morris JC, Weintraub S, Chui HC, Cummings J, DeCarli C, et al. (2006). The Uniform Data Set (UDS): Clinical and Cognitive Variables and Descriptive Data From Alzheimer Disease Centers. Alzheimer Disease & Associated Disorders 20: 210-216.
- Sauzeon H, Lestage P, Raboutet C, Kaoua BN, Claverie B (2004). Verbal fluency output in children aged 7–16 as a function of the production criterion: Qualitative analysis of clustering, switching processes, and semantic network exploitation. Brain and Language 89: 192–202.
- Tombaugh TN, Kozak J, Rees L (1999) Normative data stratified by age and education for two measures of verbal fluency: FAS and animal naming. Arch Clin Neuropsychol 14: 167-177. [Crossref]
- Caramelli P, Carthery-Goulart MT, Porto CS, Charchat-Fichman H, Nitrini R (2007) Category fluency as a screening test for Alzheimer disease in illiterate and literate patients. Alzheimer Dis Assoc Disord 21: 65-67. [Crossref]
- Gomez RG, White DA (2006) Using verbal fluency to detect very mild dementia of the Alzheimer type. Arch Clin Neuropsychol 21: 771-775. [Crossref]
- Jones S, Laukka EJ, Bäckman L (2006) Differential verbal fluency deficits in the preclinical stages of Alzheimer's disease and vascular dementia. Cortex 42: 347-355. [Crossref]
- Kramer JH, Nelson A, Johnson JK, Yaffe K, Glenn S, et al. (2006) Multiple cognitive deficits in amnestic mild cognitive impairment. Dement Geriatr Cogn Disord 22: 306-311. [Crossref]
- Canning SJ, Leach L, Stuss D, Ngo L, Black SE (2004) Diagnostic utility of abbreviated fluency measures in Alzheimer disease and vascular dementia. Neurology 62: 556-562. [Crossref]
- Rosen VM, Sunderland T, Levy J, Harwell A, McGee L, et al. (2005). Apolipoprotein E and category fluency: evidence for reduced semantic access in healthy normal controls at risk for developing Alzheimer's disease. Neuropsychologia 43: 647-58.
- Steyvers M, Tenenbaum JB (2005) The large-scale structure of semantic networks: statistical analyses and a model of semantic growth. Cogn Sci 29: 41-78. [Crossref]
- Shannon P, Markiel A, Ozier O, Baliga NS, Wang JT, et al. (2003) Cytoscape: a software environment for integrated models of biomolecular interaction networks. Genome Res 13: 2498-2504. [Crossref]
- Assenov Y, Ramírez F, Schelhorn SE, Lengauer T, Albrecht M (2008) Computing topological parameters of biological networks. Bioinformatics 24: 282-284. [Crossref]
- SPSS for Windows 15.0. SPSS, Inc., 2007
- Jeong H, Neda Z, Barabasi AL (2003),. Measuring preferential attachment in evolving networks Europhys. Letters 61: 567-573.
- Barabási AL, Jeong H, Néda Z, Ravasz E, Schubert A, Vissek T (2002). Evolution of the Social Network of Scientific Collaborations. Physica A: 311, 590-614.
- Newman ME (2001) Clustering and preferential attachment in growing networks. Phys Rev E Stat Nonlin Soft Matter Phys 64: 025102. [Crossref]
- Watts DJ, Strogatz SH (1998) Collective dynamics of 'small-world' networks. Nature 393: 440-442. [Crossref]
- Bassett DS, Bullmore E (2006) Small-world brain networks. Neuroscientist 12: 512-523. [Crossref]
- Goñi J, Arrondo G, Sepulcre J, Martincorena I, Vélez de Mendizábal N, et al. (2011) The semantic organization of the animal category: evidence from semantic verbal fluency and network theory. Cogn Process 12: 183-196. [Crossref]
- Pittel B, Woyczynski WA, Mann JA. Random tree-type partitions as a model for acyclic polymerization: Holtsmark (3/2-stable) distribution of the supercritical gel (1990). Ann Probab 18: 319-341.
- Pittel B, Woyczynski WA. A graph-valued Markov process as rings-allowed polymerization model: subcritical behavior (1990). SIAM J Appl Math 50: 1200-1220.
- Hills TT, Maouene M, Maouene J, Sheya A, Smith L (2009) Longitudinal analysis of early semantic networks: preferential attachment or preferential acquisition? Psychol Sci 20: 729-739. [Crossref]
- Marczinski CA, Kertesz A (2006) Category and letter fluency in semantic dementia, primary progressive aphasia, and Alzheimer's disease. Brain Lang 97: 258-265. [Crossref]
- Rosser A, Hodges JR (1994) Initial letter and semantic category fluency in Alzheimer's disease, Huntington's disease, and progressive supranuclear palsy. J Neurol Neurosurg Psychiatry 57: 1389-1394. [Crossref]
- Bayles KA, Trosset MW, Tomoeda CK, Montgomery EB Jr, Wilson J (1993) Generative naming in Parkinson disease patients. J Clin Exp Neuropsychol 15: 547-562. [Crossref]
- Rossell SL (2006) Category fluency performance in patients with schizophrenia and bipolar disorder: The influence of affective categories. Schizophr Res 82: 135-138. [Crossref]
- Rohrer D, Wixted JT, Salmon DP, Butters N (1995) Retrieval from semantic memory and its implications for Alzheimer's disease. J Exp Psychol Learn Mem Cogn 21: 1127-1139. [Crossref]
- Meyer DJ, Messer J, Singh T, Thomas PJ, Woyczynski WA, et al. (2012) Random local temporal structure of category fluency responses. J Comput Neurosci 32: 213-231. [Crossref]