Studies in perfused hearts show that flow-sensitive G-protein coupled receptors are lectinic suggesting that flow exerts its effects by modulating the interaction between endothelial surface layer oligosaccharides and lectinic transmembrane G-protein coupled receptors. To test this hypothesis guinea pig carotid arteries were perfused with Krebs-Henseleit at 11 or 16 ml/min. The effects of flow on the contraction induced by stimulating the bradykinin receptor were determined using the flow-induced changes of bradykinin concentration-vascular response curves. Flow effects on the bradykinin receptor were studied in four independent groups; in Groups 1 and 2 (controls) the endothelial surface layer glyosidic composition was not altered, in Group 3 an oligosaccharide polymer that lectinically and irreversibly binds to endothelial surface layer was infused, and in Group 4 endothelial surface layer heparinic were hydrolyzed. Results show that an increase in flow from 11 to 16 ml/min shifted the vascular response curve of bradykinin upward and to the left. Similar results were obtained with endothelial surface layer oligosaccharide polymer binding and heparinic removal but elevation of flow from 11 to 16 ml/min had no effect. Thus, the flow dependence of the lectinic bradykinin receptor depends on its ability to interact with the oligosaccharide environment and heparinic groups.
endothelium, shear stress, glycocalyx, G-proteins coupled receptors, mechanosensors, lectins, oligosaccharides
The molecular and physical mechanisms by which endothelial cells transduce flow into biochemical responses are ambiguous [1-5], because the transducing molecules directly affected by flow, the “mechanosensors”, are unknown. Flow sensing properties likely reside in the luminal endothelial surface; constituted by the cell membrane and glycocalyx which is acted by flow [6-13]. We have shown that flow-induced responses require endothelial surface layer oligosaccharides and oligosaccharide-recognizing proteins, lectins because a) specific enzymatic hydrolysis of endogenous oligosaccharides or their binding to exogenous lectins exactly alter flow-induced responses and b) infusion of diverse exogenous oligosaccharides that bind to endothelial surface lectins alter the effects of flow [8,11,12].
Our extensive work in the heart has established that coronary flow regulates diverse cardiac and vascular functions, and these flow sensing effects require the presence of various endothelial surface specific oligosaccharides and lectins among which there are several G-protein coupled receptors [12,14]. Interestingly, the roles of individual endothelial surface sugars and lectins in flow-induced responses are function biased; a complexity that makes difficult to identify the exact “mechanosensor(s)” for each response [6,8,10-13,15]. In contrast, in the case of a defined G-protein coupled receptor, the response triggered by its specific agonist identifies it as the structure of origin, the agonist-sensor [1,3,4,14]. If this agonist-sensor induced response is modulated by flow, it would suggest that this G-protein coupled receptor is also a flow-sensor and because of being lectinic, this flow-modulated response will react to specific alterations of the endothelial surface layer oligosaccharide composition, suggesting that the oligosaccharide environment modulates the G-protein coupled receptor flow-sensitivity.
The coronary endothelial-cardiac cell system is an in vivo complex network associated with diverse parenchymal cell populations. Obviously, there is a need for a simpler model, where flow and the cell surface can be directly accessed, such as isolated blood vessels perfused at a controlled flow [7,8]. In this study, in the guinea pig carotid artery, the effects of flow on the bradykinin B2 receptor; which is directly activated by flow [1], were resolved using alterations of the vasoactive bradykinin effects which also altered upon an irreversible binding of an oligosaccharide polymer to the endothelial surface layer or the enzymatic removal of heparinic groups.
In the present work, we show that vasoactive bradykinin effects are enhanced by increasing flow which depend of the endothelial surface layer oligosaccharide composition.
All procedures were in accordance with International Guiding Principles in the care and use of animals and all protocols were approved by the University Committee on the use of animals for experimentation.
Isolated perfused guinea pig carotid artery
An isolated blood vessel preparation was selected because it is a simple anatomical model and frequently used to study functional interactions between endothelial and adjacent smooth muscle cells [16-25]. For our study we chose the isolated guinea pig carotid artery which has an internal diameter of about 0.5 mm, a length of 1.5 ± 0.5 cm and can be perfused at a controlled flow.
Dunkin Hartley guinea pigs were anesthetized. A frontal neck longitudinal surgical incision was made, each common carotid was exposed, cleaned of adherent tissue, dissected to all of its length, excised and placed in a dish containing oxygenated Krebs-Henseleit buffer. Thereafter, a cannula was inserted into each carotid artery, one at the proximal anatomical end and another at the distal end, and the vessel length between the two cannulas (artery length) was determined. The cannula at the distal end was used to create a constant resistance to flow at the exit. Afterwards, the cannula at the proximal anatomical end was connected to a constant flow perfusion system containing Krebs-Henseleit (95 % O2, 5 % CO2, pH 7.4 at 37ºC), the artery was introduced in an enclosed humid atmosphere chamber at 37ºC and the perfusion pressure was continuously monitored. Prior to experimental measurements, flow was maintained at 16 ml/min for an equilibration period of 20 min. Thereafter, the various experimental manipulations were applied.
Synthesis of oligosaccharide polymer containing three different monosaccharides; N-acetylglucosamine, mannose and galactose and its properties as a lectinic probe
Synthesis of the soluble oligosaccharide polymer: Well established procedures in our laboratory were utilized [8,12,14,16,26,27]. Briefly, glucose polymer, 70 kDa dextran, was dissolved in NaCO3 (0.5M, pH 11), mixed with sufficient divinyl sulfone (DVS), so each of the three -OH groups per glucose moiety reacted with one of the two vinyl moieties of each DVS, leaving one free vinyl moiety per each DVS molecule. Subsequently upon stoichiometric addition of equal amounts of mannose or galactose or N-acetylglucosamine, the free vinyl groups reacted covalently with one hydroxyl group of either mannose or galactose or N-acetylglucosamine completing the synthesis of soluble oligosaccharide polymer with a molecular weight of 460 kDa. The polymer could also be labeled with fluorescein isothiocyanate (FITC). As negative control, no sugars were added for binding but replaced by large amounts of ethanolamine. The negative control polymers do not have a physiological effect and do not bind to the endothelial surface layer [8,12,16,26,28].
Synthesis of insoluble oligosaccharide polymer as an affinity resin: Once the soluble oligosaccharide polymer was synthesized, the solution pH was raised to 11 with NaCO3, resulting in insoluble particles which were used to pack affinity chromatography columns. The ability and specificity of the columns to retain lectins was positively established using commercially available plant lectins.
Isolation of luminal endothelial membrane proteins and the lectinic luminal endothelial membrane protein fraction
Isolation of luminal endothelial membrane protein fraction: In four previous papers we have reliably isolated the whole protein fraction from the coronary luminal endothelial surface membrane and glycocalyx thanks to the method developed and refined by different groups [8,12,14,26,29,30]. This procedure consists of coating of luminal endothelial membrane proteins with cationic colloidal silica particles (20- to 50-nm diameters) due to strong electrical binding to glycocalyx anionic proteins and polymerizing luminal endothelial membrane protein-bound silica with an anionic polymer. The anionic polymer cross-links the silica particles and neutralizes all of its free positive charges. Thereafter, tissue is homogenized followed by density gradient centrifugation and protein separation from the silica yielding the luminal endothelial membrane protein fraction.
Isolation of lectinic luminal endothelial membrane protein fraction: Affinity resin oligosaccharide polymer columns equilibrated with PBS were loaded with luminal endothelial membrane protein fraction, washed with PBS and the bound lectins were eluted with a mixture of 200 mM of each of three sugars.
Two- dimensional sodium dodecyl sulfate- polyacrylamide gel electrophoresis (SDS-PAGE) of lectinic membrane proteins: Lectinic luminal endothelial membrane proteins were loaded on strips 11 cm long with a pH gradient of 3–10. Focusing was carried out with an isoelectric focusing system and hold voltage mode. The second-dimension SDS-PAGE was performed in polyacrylamide gels following standard procedures, gels were fixed overnight, silver stained, visualized and a number of proteins were identified through their coordinates, molecular weight and isoelectric point.
Immune dot blots and Western Blot of some proteins in the whole and lectinic luminal endothelial membrane protein fraction: Well defined procedures were followed. For dot blots proteins loaded on nitrocellulose membranes were incubated with the primary antibody and reacted with peroxidase coupling secondary antibody, developed with chemiluminescence reagent, and visualized on Kodak photographic paper. For some proteins, these results were confirmed using Western blot analysis.
Bradykinin concentration-response curves at two different flows during five different experimental conditions
Intravascular hormone administration leads to specific binding to endothelial surface layer receptors, resulting in stoichiometric release of endothelial messengers that act on parenchymal cells [19-25,31-35,]. Intravascular bradykinin acts exclusively and selectively by activation of bradykinin B2 receptors in the endothelial surface layer [36]. Although bradykinin-induced vasodilation is frequently reported, in the guinea pig carotid artery as well other blood vessels, the response is a receptor-mediated constriction [19-25]. This vasoconstriction response was blocked by Hoe 140, a specific bradykinin B2 receptor antagonist (not shown) [37]. In this preparation phenylephrine induces vasoconstriction and acetylcholine produces vasodilation, however, detailed studies were not performed with these agonists.
Bolus injections of bradykinin (50 µl volume, 0.5 second duration) were chosen as a way to activate the bradykinin receptor for brief periods of time to minimize the possibility of a decaying response due to tachyphylaxis. This procedure allowed repeated administration of the agonist in the same preparation so that the dose-response effects in the same carotid could be compared under different experimental conditions. Stock Krebs-Henseleit solutions of high concentrations of bradykinin were infused as a bolus (50 µl volume, 0.5 second duration) and the concentration at the peak of the bolus was estimated from the dilution. The final bradykinin concentrations tested were; 0.05, 0.2, 0.8 and 3.5 µM. In all experiments, the effects of flow on the concentration-vascular response curves to bradykinin were compared at two flows; 11 ml/min and 16 ml/min, and at these two flows concentration-vascular response curves were determined in four different groups of experiments.
Group 1
Concentration-vascular response curves to bradykinin at two flows: The carotid flow was set to 11 ml/min and, after a basal pressure (49.1 ± 1.9 mmHg) was achieved, a given bradykinin concentration was administered. The response was recorded and the pressure was permitted to return to baseline. Flow was increased to 16 ml/min and, after a basal pressure (74.3 ± 2.6 mmHg) was achieved, bradykinin was administered at the same concentration. The responses to bradykinin at both 11 and 16 ml/min were compared with each carotid serving as its own control. Thereafter, flow was reduced to 11 ml/min and a different dose of bradykinin was administered. This cycle was repeated for all bradykinin doses. The response amplitude was defined as the peak pressure value (mmHg) minus the basal pressure at the time of injection divided by the artery length (in cm because the length of the artery varied in each preparation) and the response was expressed in mmHg/cm (Figure 1). Response amplitude values were plotted against either the corresponding concentration (linear plot) or the logarithm of the concentration (semi-logarithmic plot, n=45).
Group 2
L-NAME treatment: In the guinea pig carotid artery, bradykinin induces a biphasic response with a dominant vasoconstriction followed by a weak vasodilation due to the release of nitric oxide. L-NAME (L-N6- nitroarginine methyl ester), an analog of arginine that inhibits nitric oxide production, is expected to potentiate the bradykinin concentration-constrictor response curves because the dilation is prevented [19-25,35]. As described for group 1, control dose-response curves to bradykinin were obtained at 11 and16 ml/min. Thereafter, a continuous infusion of 100 µM L-NAME was maintained during the repetition of the concentration-response curves at a flow of 11 (basal pressure 53.4 ± 2.3 mmHg) and 16 ml/min (basal pressure 77.1 ± 2.3 mmHg) (n=9). Response amplitude values were plotted against either the corresponding concentration (linear plot) or the logarithm of the concentration (semi-logarithmic plot).
Group 3
Oligosaccharide polymer pretreatment: Our previous confocal microscopic and functional studies have shown that oligosaccharide polymers (a combination of mannose, galactose, and N-acetylglucosamine covalently bound to dextran) bind irreversibly with a high affinity to endothelial surface layer structures and, once bound, are not washed away [8,16,12,26]. As described above, control concentration-response curves to bradykinin were obtained at 11 ml/min (basal pressure 51.1 ± 2.9 mmHg) and at 16 ml/min (basal pressure 81.2 ± 4.1 mmHg). Thereafter, soluble oligosaccharide polymer was infused for 5 min at a concentration of 400 µM followed by a wash period of 10 min so that only oligosaccharide polymer remains bound to the endothelial surface layer and there is no free oligosaccharide polymer in the perfusion solution [816,26,38]. The concentration-response curves were repeated at a flow of 11 ml/min (basal pressure 46.0 ± 2.1 mmHg) and at 16 ml/min (basal pressure 78.9 ± 3.1). In each experiment, concentration-response curves at 11 and 16 ml/min before and after oligosaccharide polymer pretreatment were compared with each other and with their corresponding control curves (n=10). Response amplitude values were plotted against either the corresponding concentration (linear plot) or the logarithm of the concentration (semi-logarithmic plot).
Group 4
Heparinase treatment: Endogenous endothelial surface layer heparinate groups participate in diverse flow-induced responses [10,11,13,31], and these numerous groups can be exclusively and selectively hydrolyzed with intravascular heparinase [39-43]. To minimize the possibility of transendothelial diffusion, heparinase was administered repeatedly using a low concentration gradient and very short exposure times [8,11,13,31,44]. As described above, control concentration-response curves to bradykinin were obtained at 11 ml/min (basal pressure 52.4 ± 2.6 mmHg) and at 16 ml/min (basal pressure 81.2 ± 6.8 mmHg). Thereafter, heparinase (1 U/ml) was infused for 0.5 min at a flow of 8 ml/min followed by a wash period of 3 min. This cycle was repeated 6 times. Thereafter, the concentration-response curves were repeated at a flow of 11 ml/min (basal pressure 46.9 ± 2.4 mmHg) and at 16 ml/min (basal pressure 75.0 ± 5.0 mmHg). In each experiment, the concentration-response curves at 11 and 16 ml/min before and after heparinase pretreatment were compared with each other and with their corresponding control curves (n=11). Response amplitude values were plotted against either the corresponding concentration (linear plot) or the logarithm of the concentration (semi-logarithmic plot).
Statistical analyses
In all groups, each blood vessel was its own control. Because the "control" and "experimental" responses were measured in the same carotid, a paired t-test was chosen as the most appropriate statistical analysis and results with p < 0.05 were taken as statistically significant.
Control group I: Flow enhances bradykinin-induced stimulation of the luminal endothelial bradykinin B2 receptor
Bradykinin is an agonist capable of causing vasodilation, vasoconstriction or both, and, although vasodilation is commonly reported, vasoconstriction occurs in various vascular preparations [19-25,45]. To illustrate the vasoconstriction response at different concentrations of bradykinin, original recordings are shown in figure 1. Vasoconstriction following a bolus injection of bradykinin (0.8 µM) results in a change in pressure (ΔP) at 11 ml/min that is enhanced at 16 ml/min. Since ΔP varies with the length of the corresponding artery, ΔP was divided by the artery length (cm) and responses were defined as ΔP/cm; mmHg/cm. Clearly, the response to the same concentration of bradykinin is greater at 16 ml/min than at 11 ml/min.
The concentration-response curves to bradykinin under control conditions at two flows, 11 ml/min (Δ) and 16 ml/min ( ), are shown in Figures 1A and 1B. In Figure 1A, at all concentrations of bradykinin, the responses at 16 ml/min are significantly greater than those at 11 ml/min (each artery was its own control, * Indicates p < 0.001, n= 45). Figure 1B represents the semi-logarithmic plot of the control concentration-response curves at the two flows. These plots are represented by two straight lines (correlation coefficient > 0.98) where A and B correspond to the intercept and slope values, respectively. At 11 and 16 ml/min, the respective intercepts were 34.0 ± 1.3 < 49.7 ± 1.4 and their slopes 15.0 ± 1.2 < 24.0 ± 1.4 (Table 2). The fact that, at the two flows, intercepts and slopes are different implies that the concentration-response curve for each flow is different. In the control groups of the other four different experimental conditions, the values of intercept and slope were similar to the control group 1 (Table 2). The greater slope value at a flow of 16 ml/min compared to 11 ml/min indicates that the same change in bradykinin concentration causes a greater change in the bradykinin-induced response. Flow enhances the endothelial-mediated vascular responses to bradykinin stimulation.
Similar plots were performed under the four different experimental conditions; however, the graphs are not presented to prevent an excess of figures and only the intercept and slope values are given in Table 2.
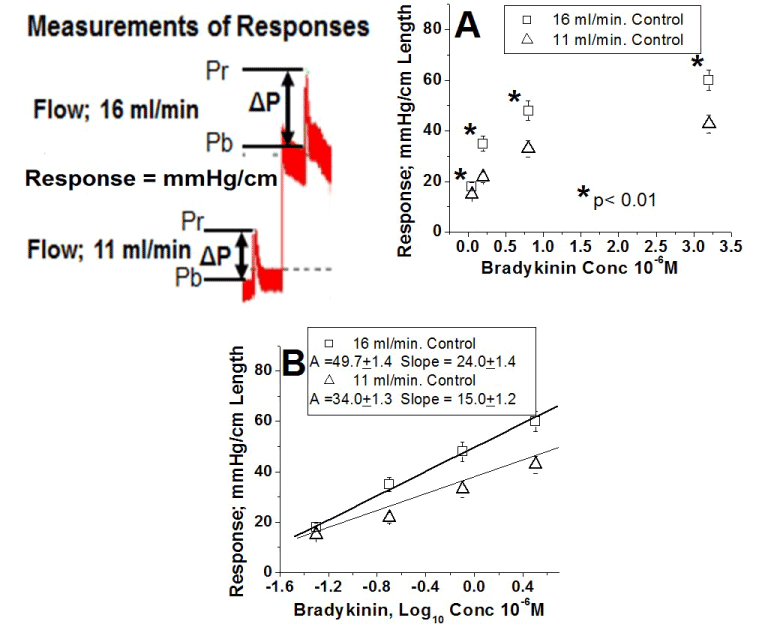
Figure 1. Under control conditions flow enhances the responses to stimulation of the endothelial luminal B2 receptor by bradykinin.
Original recordings of perfusion pressures from a representative experiment to illustrate the criteria adopted for response amplitude measurement. Responses induced by a bolus injection of the same concentration of bradykinin at a flow 11 ml/min followed by the response at a flow of 16 ml/min. Each bolus induced a transient pressure response; Peak pressure (Pr) minus basal pressure (Pb) defined ΔP (mmHg) which was divided by the length of the artery in cm. The magnitude of the response (ΔP/cm) expressed as mmHg/cm. A. Concentration-response curve as a linear plot. Ordinates represent the response amplitude and the abscissae represents the bradykinin concentration (X 10-6 M). (Δ) Responses at a flow of 11 ml/min. () Responses at a flow of 16 ml/min. Responses to bradykinin at a flow of 16 ml/min are significantly greater than those at flow of 11 ml/min. Each artery was its own control, * Indicates a p < 0.001. Results from group 1 (n=45). B. Concentration-response curve as a semi-logarithmic plot. Same data as in figure 1A. Ordinates represent the response amplitude and the abscissae the logarithm of bradykinin concentration. The data are represented by straight lines with a correlation coefficient ≥ 0.98. The parameter A and slope values for the straight line at 16 ml/min 49.7 ± 1.9 and 24.0 ± 1.4, respectively, are greater than those at 11 ml/min (34.0 ± 1.3 and 15.0 ± 1.2).
Group 2: Effects of L-NAME on the concentration-vascular response curves to bradykinin at two flows
The dose-response curves to bradykinin are illustrated in figure 2 (n=9). Figure 2A shows the results at a flow of 11 ml/min under control conditions (Δ) and during the sustained infusion of L-NAME ( ). Figure 2B shows the results at a flow of 16 ml/min under control conditions () and during the sustained infusion of L-NAME (
 ). L-NAME at the two flows significantly upward shifted the concentration-vascular responses to bradykinin (each artery was its own control, * Indicates p < 0.001 and # p < 0.05). In semi-logarithmic plots these four curves are also represented by straight lines with high correlation coefficients (≥ 0.98). During L-NAME infusion, as compared to control, the intercept values increased at 11 ml/min (40.1 ± 2.0 > 31.1 ± 1.1) and 16 ml/min (56.0 ± 2.6 > 42.4 ± 1.5). In contrast, the slope values did not change at 11 ml/min (18.2 ± 2.2 ≈ 15.5 ± 0.9) and at 16 ml/min (27.5 ± 2.3 ≈ 22.8 ± 1.6) (Table 2).
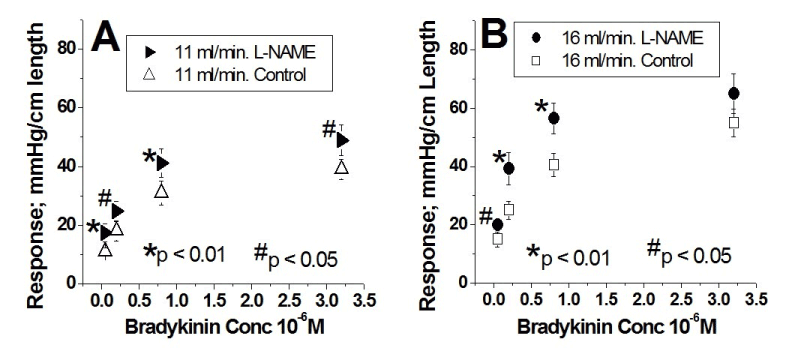
Figure 2. Effect of continuous L-NAME infusion at the two flows; 11 ml/min and 16 ml/min enhances the responses to stimulation of the endothelial luminal B2 receptor by bradykinin. A. Concentration-response curves as a linear plot at a flow of 11 ml/min. Ordinates represent the response amplitude and the abscissae of the bradykinin concentration (X 10-6 M). Responses at a flow of 11 ml/min under control conditions are represented by Δ and those during L-NAME administration are represented by . The responses to bradykinin during L-NAME administration are significantly greater than those during control. Each artery was its own control, * Indicates a p < 0.001 and # p < 0.05. B. Concentration-response curves as a linear plot at a flow of 16 ml/min. Ordinates represent the response amplitude and the abscissae the bradykinin concentration (X 10-6 M). Responses at a flow of 16 ml/min under control conditions are represented by and those during L-NAME administration are represented by . Responses to bradykinin during L-NAME administration are significantly greater than those during control. Each artery was its own control, * Indicates a p < 0.001 and # p < 0.05. Results from group 2 (n= 9).
The presence of G-protein coupled receptors in the luminal endothelial membrane protein and lectinic luminal endothelial membrane protein fractions
Luminal endothelial membrane protein fraction was isolated and passed through an oligosaccharide polymer affinity column to obtain the corresponding lectinic luminal endothelial membrane protein fraction which was subjected to 2D-SDS-PAGE (not shown) and 167 proteins were detected [8,12,14,26]. Protein points with coordinates of bradykinin B2 receptor plus other various G-protein coupled receptors were found in the 2D-SDS-PAGE gel. These receptors are listed in Table 1. Furthermore, the identity of these proteins in the whole and lectinic luminal endothelial membrane protein fractions was determined using immune-dot blots. Thus, a list of G-protein coupled receptors are present in the luminal endothelial membrane protein fraction and are lectinic.
Table 1. 2D-SDS coordinate values for proteins found in coronary luminal membrane Molecule Molecular Weight (x 103) Isoelectric Point
Parameters that describe the straight lines (logarithm concentration-response curves) of the flow data shown in figures 1-5. Parameter A corresponds to the intersection of the line with the X-axis and B corresponds to the slope of the straight line. Values of A and B are shown at the two flows of 11 ml/min and 16 ml/min under five different conditions; Control, L-NAME, oligosaccharide polymer (Sac-Pol), and heparinase treatments. Only in the control and L-NAME groups are the parameters A and B at 16 ml/min greater than those at 11 ml/min. i. e. the straight lines at the two flows are different. Following oligosaccharide polymer and heparinase treatments, flow fails to alter these parameters.
|
Molecule
|
Molecular Weight (x 103)
|
Isoelectric Point (pl)
|
|
B2R
|
41.56
|
8.88
|
|
AT1
|
45-48
|
6.7
|
|
ETAR
|
48.58
|
8.68
|
|
PRL-R
|
66
|
5.66
|
|
TXA2R
|
37.1
|
10
|
|
A1-R
|
36.64
|
8.77
|
|
A2A-R
|
44.88
|
8.68
|
|
B1-AR
|
47.06
|
6.78
|
|
A1A-AR
|
78
|
5.9
|
Group 3: Effects of oligosaccharide polymer on the concentration-vascular response curves to bradykinin at two flows
Extensive work from our laboratory has established that in vivo oligosaccharide polymers bind with a high affinity and lectinically to the luminal endothelial membrane proteins. After a transient infusion, the oligosaccharide polymer remains bound to the luminal endothelial membrane as shown by confocal microscopy, even after extensive washout. Upon binding [31,43,46-49]. Thus, oligosaccharide polymer, after binding to endothelial surface layer lectins such as the bradykinin B2 receptor, likely competes for binding with endogenous oligosaccharides.
The dose-response curves to bradykinin are illustrated in figure 3 (n=10). Figure 3A shows the results at a flow of 11 ml/min under control conditions (Δ) and the subsequent results from oligosaccharide polymer binding to the endothelial surface layer ( ). Figure 3B shows the results at a flow of 16 ml/min under control conditions () and the subsequent results after oligosaccharide polymer binding to the endothelial surface layer (
 ). Bound endothelial surface layer oligosaccharide polymer at the two flows significantly caused an upward shift of the concentration-vascular responses to bradykinin potentiating the bradykinin effects at the two flows equally (each artery was its own control, * Indicates p < 0.001). In semi-logarithmic plots these four curves are also represented by straight lines with high correlation coefficients (≥ 0.98) (Table 2). As a result of oligosaccharide polymer bound to the endothelial surface layer, the intercept values as compared to control increased at 11 ml/min (69.2 ± 2.3 > 37.9 ± 2.2) and at 16 ml/min (76.3 ± 2.1 > 50.0 ± 6.2). In contrast, when oligosaccharide polymer binds to the endothelial surface layer, the slope values increased only at 11 ml/min (25.3 ± 3.0 > 19.3 ± 1.9), while at 16 ml/min slope values were the same (26.1 ± 2.5 ≈ 28.4 ± 6.8) and similar to that at 11 ml/min in the presence of oligosaccharide polymer; 25.3 ± 3.0 (Table 2). Oligosaccharide polymer at a flow of 11 ml/min and 16 ml/min displaces each of the corresponding control concentration-response curves upward to the same level. But in the presence of oligosaccharide polymer, the concentration-response curves at the two flows were identical because the slope and intercept values at the two flows are not different (Table 2).
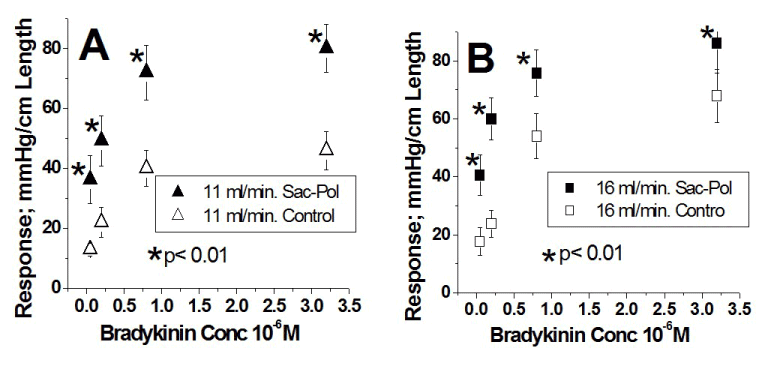
Figure 3.
Effect of bound oligosaccharide polymer (Sac-Pol) to the endothelial surface layer at the two flows; 11 ml/min and 16 ml/min enhances the responses to stimulation of the endothelial luminal B2 receptor by bradykinin. A. Concentration-response curves as a linear plot at a flow of 11 ml/min. Ordinates represent the response amplitude and the abscissae the bradykinin concentration (X 10-6 M). Responses at a flow of 11 ml/min under control conditions are represented by Δ and those after oligosaccharide polymer (Sac-Pol) administration, wash and binding to endothelial surface layer are represented by . The responses to bradykinin once oligosaccharide polymer (Sac-Pol) is bound to endothelial surface layer are significantly greater than those during control. Each artery was its own control, * Indicates a p < 0.001. B. Concentration-response curves as a linear plot at a flow of 16 ml/min. Responses at a flow of 16 ml/min under control conditions are represented by and those after oligosaccharide polymer administration and binding to endothelial surface layer are represented by . The responses to bradykinin once oligosaccharide polymer is bound to endothelial surface layer are significantly greater than those during control. Each artery was its own control, * Indicates a p < 0.001. Results from group 3 (n= 10).
Group 4: Effects of heparinase on the concentration-vascular response curves to bradykinin at two flows
Work from our laboratory and many others have shown that the perfusion of heparinase into blood vessels removes endothelial surface layer heparinic functional groups [10,11,31,13,39,40,42]. Heparinate, a branched oligosaccharide, is known to be lectinically bound to endothelial surface layer functional [40].
The dose-response curves to bradykinin are illustrated in figure 4 (n=11). Figure 4A shows the results at a flow of 11 ml/min under control conditions (Δ) and after removal endothelial surface layer heparinic groups ( ). Figure 4B shows the results at a flow of 16 ml/min under control conditions () and after removal endothelial surface layer heparinic groups (
 ). Removal of endothelial surface layer heparinic groups at a flow of 11 ml/min significantly shifted upward the concentration-vascular responses to bradykinin. Similar upward displacement occurs at a flow of 16 ml/min, although to a lesser extent compared to the oligosaccharide polymer (each artery was its own control, * Indicates a p < 0.001 and # p < 0.05). In semi-logarithmic plots these four curves are also represented by straight lines with high correlation coefficients (≥ 0.98) (Table 2). Following the infusion of heparinase, the intercept values as compared to control increased at both 11 ml/min (47.9 ± 2.3 > 32.3 ± 2.1) and at 16 ml/min (53.2 ± 1.8 > 45.4 ± 1.3). In contrast, following endothelial surface layer heparinate removal, the slope values as compared to control increased only at 11 ml/min (22.4 ± 3.0 > 16.3 ± 2.0), while at 16 ml/min, slope values were the same (22.2 ± 2.1 ≈ 23.2 ± 1.3) and similar to that at 11 ml/min following heparinate removal; 22.4 ± 1.9 (Table 2). Heparinase pretreatment at a flow of 11 ml/min and 16 ml/min displaces each of the corresponding control concentration-response curves upward to the same level. But after treatment with heparinase, the concentration-response curves at the two flows were identical because the slope and intercept values at the two flows are not different (Table 2). Clearly binding of oligosaccharide polymer to luminal endothelial membrane protein and removal of its heparinate groups exerts similar qualitative effects, although there are quantitative differences.
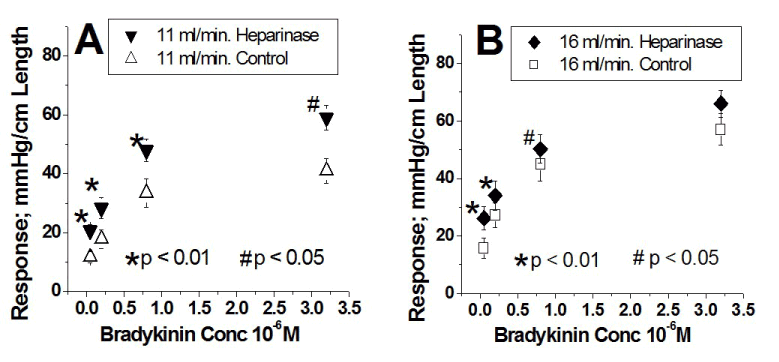
Figure 4. Effect of removal of heparinic group from the endothelial surface layer at the two flows; 11 ml/min and 16 ml/min enhances the responses to stimulation of the endothelial luminal B2 receptor by bradykinin. A. Concentration-response curves as a linear plot at a flow of 11 ml/min. Ordinates represent the response amplitude and the abscissae the bradykinin concentration (X 10-6 M). Responses at a flow of 11 ml/min under control conditions are represented by Δ and those after heparinase infusion, washing and endothelial surface layer heparinic group removal are represented by . The responses to bradykinin once endothelial surface layer heparinic groups are removed are significantly greater than those during control. Each artery was its own control, * Indicates a p < 0.001 and # p < 0.05. B. Concentration-response curves as a linear plot at a flow of 16 ml/min. Responses at a flow of 16 ml/min under control conditions are represented by and those after heparinase infusion, washing and endothelial surface layer heparinic group removal are represented by . The responses to bradykinin once endothelial surface layer heparinic groups are removed are significantly greater than those during control. Each artery was its own control, * Indicates a p < 0.001 and # p < 0.05. Results from group 4 (n= 11).
Comparison of the effects of flow on the concentration-vascular response curve for bradykinin under four different experimental conditions
The results of the direct effects of flow under the four different conditions described in figures 1-4 are compared in Figure 5. Figures 5A, 5B, 5C and 5D compare the effects of the two flows under control, sustained infusion of L-NAME, oligosaccharide polymer bound to luminal endothelial membrane protein and removal of luminal endothelial membrane protein heparinate, respectively. During control and sustained infusion of L-NAME, the curves at a flow of 11 ml/min (Figures 5A Δ and 5B ) are significantly below the corresponding curve at 16 ml/min ( and ). Clearly, under these two conditions, flow enhances the effects of bradykinin (each artery was its own control, * Indicates a p < 0.001). However, the curves obtained at a flow of 11 ml/min and at 16 ml/min after oligosaccharide polymer is bound to the luminal endothelial membrane protein (Figures 5C , ) and luminal endothelial membrane protein heparinic groups removed (Figure 5D , ) are not different from each other. Clearly, under these two conditions, flow fails to enhance the effects of bradykinin. In semi-logarithmic plots, all of these eight curves are represented by straight lines with high correlation coefficients ≥ 0.98 and their intercept (A) and slope values (B) are given in Table 2.
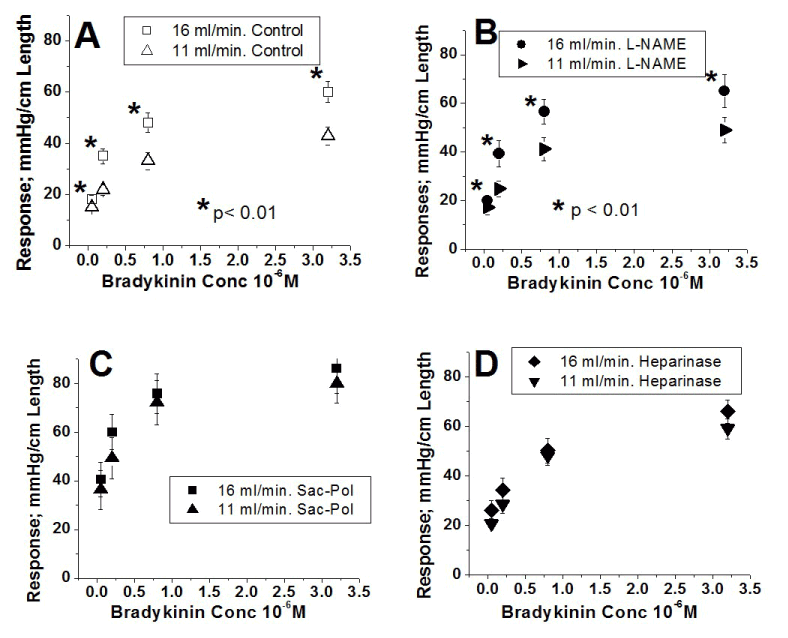
Figure 5. Flow effects on the responses to bradykinin stimulation of the endothelial surface layer bradykinin B2 receptor (concentration-response curve) under four different experimental conditions. A. under control conditions. Ordinates represent the response amplitude and the abscissae the bradykinin concentration (X 10-6 M). Δ= Responses at a flow of 11 ml/min. = Responses at a flow of 16 ml/min. Responses to bradykinin at a flow of 16 ml/min are significantly greater than those at 11 ml/min. Under this condition, flow enhances the response to bradykinin. Each artery was its own control, * Indicates a p < 0.001. Results from group 1 (n= 4). B. during the sustained infusion of L-NAME. Concentration-response curve as a linear plot. Ordinates represent the response amplitude and the abscissae the bradykinin concentration (X 10-6 M). = Responses at a flow of 11 ml/min. = Responses at a flow of 16 ml/min. Responses to bradykinin at a flow of 16 ml/min are significantly greater than those at f 11 ml/min. Under this condition, flow enhances the response to bradykinin. Each artery was its own control, * Indicates a p < 0.001. Results from group 2 (n= 9). C. After oligosaccharide polymer (Sac-Pol) binding to endothelial surface layer. Ordinates represent the response amplitude and the abscissae the bradykinin concentration (X 10-6 M). = Responses at a flow of 11 ml/min. = Responses at a flow of 16 ml/min. Responses to bradykinin at the two flows are the same. Under this condition, flow fails to enhance the response to bradykinin. Each artery was its own control. Results from group 3 (n= 10). D. After endothelial surface layer heparinic group removal. Ordinates represent the response amplitude and the abscissae the bradykinin concentration (X 10-6 M). = Responses at a flow of 11 ml/min. = Responses at a flow of 16 ml/min. Responses to bradykinin at the two flows are the same. Under this condition, flow fails to enhance the response to bradykinin. Each artery was its own control. Results from group 4 (n= 11). All these concentration-response curves in a semi-logarithmic plot yielded straight lines with correlation coefficients ≥ 0.98 and the parameters that describe these straight lines A and slope (B) are shown in table II.
For our present study, we chose the isolated guinea pig carotid artery perfused at controlled flow because its features include: a small uniform vascular cylinder; the ability to set the flow rate, its endothelial surface layer can be directly accessed, and intact glycocalyx [48,49]. In addition, the amplitude of the contractile responses of the vascular smooth muscle is a direct indicator of endothelial paracrine signaling [20-25]. This preparation constitutes a system more similar to an in vivo model, making it a suitable agile system for quantitative studies on the mechanisms of flow-activation of endothelial surface layer endothelial processes with changes in vascular smooth muscle contraction serving as an [20-25].
In this manuscript we show that:
1) Under control conditions bradykinin-activation of the endothelial surface layer bradykinin receptor is enhanced by flow.
2) Oligosaccharide polymer bound to lectins of the luminal endothelial membrane at the two flows significantly upward shifted the concentration-vascular responses to bradykinin. These potentiating effects of oligosaccharide polymer on the effect of bradykinin at the two flows were well above the potentiating effects of flow, rendering the flow effects nil (Figure 4, Table 2). The oligosaccharide polymer has been used as an affinity resin to isolate lectinic endothelial surface layer bradykinin B2 receptors, and upon infusion, binds solely to lectinic luminal endothelial membrane proteins, including the bradykinin B2 receptor in situ [8,12,26].
3) Removal of luminal endothelial membrane protein heparinate using heparinase, at the two flows, resulted in a significant upward shift of the concentration-vascular responses to bradykinin as compared to control. Heparinate groups are the most abundant oligosaccharide component of the endothelial surface layer and likely interact with neighboring lectinic proteins [10,40,42,50]. These potentiating effects of heparinate removal on the effect of bradykinin at the two flows were almost similar to the potentiating effects of flow, rendering the flow effects nil (Figure. 5, Table 2). Both oligosaccharide polymer and heparinase, due to their size and transient administration, their respective targeting to endothelial surface layer lectins and heparinate, are agents that restrict their actions to the endothelial surface layer to alter its oligosaccharide composition.
4) In the presence of L-NAME, at the two flows, as compared to its control, significantly upward shifted the concentration-vascular responses to bradykinin. But these potentiating effects of L-NAME on flow remain equally effective as in the controls, which contrasts with the effects of the oligosaccharide polymer and heparinase (Figure. 2, Table 2). This effect of L-NAME could be attributed to sole inhibition of basal nitric synthase activity independent of B2 bradykinin-induced signaling. However, inhibition of basal nitric oxide synthesis would be manifested by a basal constriction expressed as an increase in basal perfusion pressures which, during control at 11 ml/min and 16 ml/min, were 49 ± 1.9 mmHg and 74.2 ± 2.6 mmHg, respectively, and equal at 53.4 ± 2.3 mmHg and 77.1 ± 2.3 mmHg during L-NAME. Thus, the effects of L-NAME are likely the result of an interaction with bradykinin signaling.
TABLE 2: Comparison between parameters of the log-Concentration- Response plots obtained at two flows after various treatments. Y = A + Bx; x = Log-,Conc.
In a 2-dimensional SDS-PAGE (2D-SDS-PAGE) pattern were identified protein dots with the coordinates values of the listed G-protein coupled receptors found in a luminal lectinic endothelial protein fraction. The receptor-lectins were: B2R; Bradykinin B2, AT1R; Angiotensin II, ETAR; Endothelin. PRL-R; Prolactin, TXA2R; Thromboxane, A2, A1-R; Adenosine 1, A2A-R; Adenosine 2, β1-AR; Adrenergic β1, α1-AR; Adrenergic α1. In addition, identification of bradykinin B2R and the others listed proteins was performed by inmuno-Dot and found to be present in both the whole endothelial luminal membrane fraction and in the luminal lectinic endothelial fraction. Modified from Perez-et al Am. J. Physiol Heart Circ Physiol 306:H699-H708, 2014.
|
FLOW
|
11 ml/min
|
16 ml/min
|
|
Group #
|
A
|
B
|
A
|
B
|
|
CONTROL
|
34.0±1.3
|
15.0±1.2
|
*49.7±1.4
|
'24.0±1.4
|
|
CONTROL
|
31.1±1.1
|
15.5±0.9
|
"42.4±1.5
|
"22.8±1.6
|
|
L-NAME
|
"40.1±2.0
|
18.2±2.2
|
#"56.0±2.6
|
27.5±2.3
|
|
CONTROL
|
37.9±2.2
|
19.3±1.9
|
*50.0±6.2
|
*28.4±6.8
|
|
ZSac-Pol
|
*69.2±2.3
|
*25.3±3.0
|
"76.3±2.1
|
26.1±2.5
|
|
CONTROL
|
32.3±2.1
|
16.3±2.0
|
"45.4±1.3
|
*23.2±1.3
|
|
Heparinase
|
*47.9±2.3
|
"22.4±1.9
|
53.2±1.8
|
22.2±2.1
|
|
* Greater than its corresponding control parameter
# Greater than its corresponding parameter at flow of 11 ml/min
|
The importance of endothelial surface layer oligosaccharide and flow on agonist activation of endothelial surface layer receptors is emphasized by a recent study from our laboratory [14]. Intracoronary infusion of Candida glabrata, a pathogen, binding via mannose-links to the endothelial surface layer, alters flow-modulated functional responses and agonist-induced responses of three different G-protein coupled receptors; bradykinin, angiotensin II type 1 and α1-adrenergic receptors. Furthermore, if Candida glabrata is used as an affinity-mannose resin, lectinic endothelial surface layer G-protein coupled receptors; bradykinin, angiotensin II type 1, α1-adrenergic and endothelin 2 receptors are isolated. Oligosaccharide polymer and Candida glabrata behave similarly in both their physiological effects and ability to bind lectinic luminal endothelial membrane G-protein coupled receptors and their effects are prevented if the corresponding free monosaccharide is infused simultaneously (Torres-Tirado, et al. 2016) [14]. It is evident that numerous and diverse endothelial surface layer lectinic binding sites are common rather than unique for the endothelial surface layer [8,12,16,26].
Our hypothesis is that the flow response requires that the sensor, composed of a lectinic transducing protein in a specific oligosaccharide environment, detects flow/mechanical stress through lectin-oligosaccharide interactions [1,2,8,12,14,26,51]. This concept would apply to other flow-sensitive luminal endothelial membrane protein structures listed in Table 3. These structures possess most of listed properties required by the hypothesis; presence in the luminal endothelial membrane protein fraction (whole membrane fraction, WMF), are lectins, respond to flow independently of an agonist, respond to its agonist, and flow induces conformational changes.
Table 3. Luminal endothelial membrane lectinic proteins that respond to flow and luminal agnostic activation
List of endothelial proteins that are in the luminal membrane, are lectinic, are activated by its luminal agonist, and respond to flow by altering their molecular conformation.
|
PROTEIN
|
Present
*WMF
|
*Isolated
as lectin
|
Responds to
|
&Mol Conf C
by flow
|
| |
|
|
Flow
|
Agonists
|
|
|
GROUP 1: GPCR
|
|
|
|
|
|
|
Bradykinin B2
|
+
|
+
|
+
|
+
|
+
|
|
Angiotensin AT
|
+
|
+
|
+
|
+
|
+
|
|
Adrenergic α1
|
+
|
+
|
+
|
+
|
+
|
|
Adenosine Al
|
+
|
+
|
+
|
+
|
+
|
|
Endothelin ETA
|
+
|
+
|
+
|
?
|
?
|
|
Prolactin PRL
|
+
|
+
|
+
|
?
|
?
|
|
Vasopressin V1
|
+
|
?
|
+
|
+
|
?
|
|
Muscarinic M5
|
+
|
?
|
+
|
+
|
?
|
|
Histamine H1
|
+
|
?
|
+
|
?
|
?
|
|
Adenosine A2
|
+
|
+
|
?
|
+
|
?
|
|
Thomboxane TXA2
|
+
|
+
|
?
|
+
|
?
|
|
Adrenergic β1
|
+
|
+
|
?
|
?
|
+
|
|
Adrenergic β3
|
+
|
+
|
?
|
?
|
?
|
|
GROUP 2: SELECTIONS
|
|
PECAM-1
|
+
|
+
|
+
|
|
+
|
|
VCAM-1
|
+
|
+
|
+
|
|
?
|
|
ICAM-1
|
+
|
+
|
+
|
|
?
|
|
*WMF: Whole Membrane Fraction; #; isolated by affinity chromatography; & Mol Conf C: Conformational molecular changes by flow
|
2021 Copyright OAT. All rights reserv
Our present results provide further support of the concept that the blood vessel’s luminal glycocalyx components, oligosaccharides (O) and signaling lectinic transmembrane proteins (L), due to their affinity and proximity, form reversible complexes (O●L) via the following dynamic equilibrium: O + L  O●L. Addition of exogenous oligosaccharides, such as the oligosaccharide polymer, by competition with the endogenous oligosaccharides or removal of endogenous oligosaccharides with enzymes, such as heparinase, would certainly alter the equilibrium of this system. If L is a G-protein coupled receptor known to be flow activated as is bradykinin, it implies that flow and the corresponding agonist should act synergistically and flow simply potentiates the concentration-dependent actions of the agonist. This equilibrium determines the level of activation to be achieved by the responding endothelial biochemical pathway that is modulated by flow and its disturbance defines the “magnitude of the response” of the true flow sensors; O and L. It is likely that O, being the most highly hydrated, is the structure that directly absorbs more of the energy of flow (water and ions in motion), when either O●L or O + L are initiated. If this interpretation is correct, it indicates that the transmembrane transducing Ls, such as the G-protein coupled receptor bradykinin, are not insular, are exclusively chemically-sensitive molecules, but are part of molecular complexes whose functions are determined and graded by interactions with their specific oligosaccharide environment. This intuitive concept is illustrated in figure 6 which represents an endothelial cell and transmembrane signaling proteins which have several lectinic sites, are embedded in an oligosaccharide environment and exposed to the flow of water and ions. Oligosaccharide-lectinic sites bind reversibly and some or all are, by an unexplained physical mechanism, flow-modulated, resulting in cell signaling. This complex of molecules is the "RECEPTOR" and each part determines the signaling output, making the “receptor” multifunctional [52,53]. In our opinion, our proposal is the only one that offers a mechanism for the mechanotransduction of the flow signal.
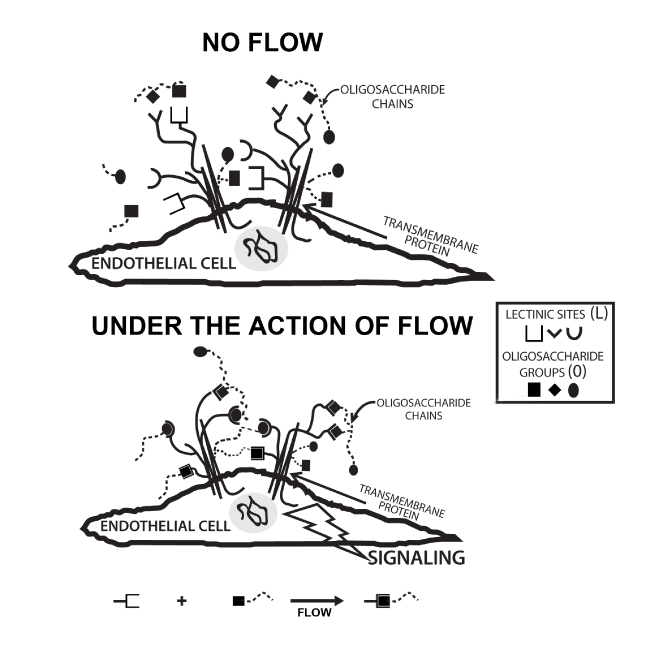
Figure 6. Drawing illustrating an endothelial cell and two transmembrane signaling proteins. These proteins have some lectinic sites, are glycosylated and are surrounded by a dense network of different oligosaccharides. Lectinic (L) sites form complexes with neighboring oligosaccharides (O) and form complexes (L●O) whose equilibrium is modulated by flow of water and ions.
However, our assumption is that upon binding of the oligosaccharide polymer to the bradykinin receptor of the luminal endothelial membrane, it alters its flow-induced responses to bradykinin i. e. a direct cause and effect. However, the oligosaccharide polymer binds to other signaling proteins that are also flow sensitive and may indirectly modulate vascular smooth muscle tone that alters the response to bradykinin. Thus, alternative mechanisms other than a direct cause and effect could explain our results on flow. Possible alternative explanations include; 1) Angiotensin II and adrenergic α1 receptors are flow sensitive and indirectly could alter muscle tone, thus, the bradykinin response. 2) Flow has been shown to stimulate release of ATP via activation of a luminal endothelial membrane ATP synthase. ATP in turn stimulates purinergic P2X4 channels, causing the release of nitric oxyde. If oligosaccharide polymer inhibited either ATP production or its effect on the P2X4 channel, this would inhibit the flow-induced dilation by this mechanism which would tend to increase the constrictor effect by bradykinin. These alternatives must be explored in the future.
Lastly, it is inaccurate to assume that hormone and electrical stimuli act on transmembrane effector proteins in a cell membrane (a lipid bilayer) which is denuded of extracellular specific anchor structures i. e. a “baldheaded” membrane [1,2,46]. These pervasive models are a conceptual oversimplification since electron microscopic, biochemical, and now functional studies show that many of these transmembrane proteins are lectins and are surrounded and bound to a dense mesh of specific oligosaccharides complexes.
In summary, we propose that the role of flow is to modulate the level of interaction between oligosaccharide-lectinic receptor sites and that this represents one of the mechanisms responsible for receptor mechanosensing. However, it is likely that a different principle may apply to other mechanosensing structures.
Funded by Grant CONACYT-SEP 00223350. A. E. Jiménez-Corona is a recipient of Postdoctoral Fellowship CONACYT 290917.
- Chachisvilis M, Zhang YL, Frangos JA (2006) G protein-coupled receptors sense fluid shear stress in endothelial cells. Proc Natl Acad Sci U S A 103: 15463-15468. [Crossref]
- Mederos y Schnitzler M, Storch U, Meibers S, Nurwakagari P, Breit A, et al. (2008). Gq-coupled receptors as mechanosensors mediating myogenic vasoconstriction. EMBO J 27: 3092–3103. [Crossref]
- Yamamoto K, Shimizu N, Obi S, Kumagaya S, Taketani Y, et al. (2007) Involvement of cell surface ATP synthase in flow-induced ATP release by vascular endothelial cells. Am J Physiol Heart Circ Physiol 293: H1646-1653. [Crossref]
- Dull RO, Tarbell JM, Davies PF (1992) Mechanisms of flow-mediated signaltransduction inendothelial cells: Kinetics of ATP surface concentrations. J Vasc Res 29: 410-419. [Crossref]
- Bodin P, Bailey D, Burnstock G (1991) Increased flow-induced ATP release from isolated vascular endothelial cells but not smooth muscle cells. Br J Pharmacol 103: 1203-1205. [Crossref]
- Pahakis MY, Kosky JR, Dull RO, Tarbell JM (2007) The role of endothelial glycocalyx components in mechanotransduction of fluid shear stress. Biochem Biophys Res Commun 355: 228-233. [Crossref]
- Pohl U, Herlan K, Huang A, Bassenge E (1991). EDRF-mediated shear-induced dilation opposes myogenic vasoconstriction in small rabbit arteries. Am J Physiol Heart Circ Physiol 261: H2016-H2023. [Crossref]
- Ramiro-Diaz J, Barajas-Espinosa A, Chi-Ahumada E, Perez-Aguilar S, Torres-Tirado D, et al. (2010). Luminal endothelial lectins with affinity for N-acetylglucosamine determine flow-induced cardiac and vascular paracrine-dependent responses. Am J Physiol Heart Circ Physiol 299: 743-751. [Crossref]
- Ausprunk DH, Boudreau CL, Nelson DA (1981) Proteoglycans in the microvasculature. I. Histochemical localization in microvessels of the rabbit eye. Am J Pathol 103: 353-366. [Crossref]
- Florian JA, Kosky JR, Ainslie K, Pang Z, Dull RO, et al. (2003) Heparan sulfate proteoglycan is a mechanosensor on endothelial cells. Circ Res 93: e136-142. [Crossref]
- Rubio-Gayosso I, Barajas-Espinosa A, Castillo-Hernandez J, Ramiro-Diaz J, Ceballos G, et al. (2005) Enzymatic hydrolysis of luminal coronary glycosidic structures uncovers their role in sensing coronary flow. Front Biosci 10: 1050–1059. [Crossref]
- Perez-Aguilar S, Torres-Tirado D, Martell-Gallegos G, Velarde-Salcedo J, Barba-de la Rosa AP, et al. (2014) G protein-coupled receptors mediate coronary flow- and agonist-induced responses via lectin-oligosaccharide interactions. Am J Physiol Heart Circ Physiol 306, H699–H708. [Crossref]
- Suárez J, Rubio R (1991) Regulation of glycolytic flux by coronary flow in guinea pig heart. Role of vascular endothelial cell glycocalyx. Am J Physiol 261: H1994-2000. [Crossref]
- Torres-Tirado D, Knabb M, Castaño I, Patrón-Soberano A, De Las Peñas A, et al. (2016) Candida glabrata inhibits flow and agonist-activated cardiac functions by binding to glycosylated and lectinic receptors on luminal coronary membranes. Am J Physiol-Reg Integr and Compar Physiol 310: R24-32. [Crossref]
- Brian J (2012) The Role of Glycosylation in Receptor Signaling. In: Biochemistry, Genetics and Molecular Biology » "Glycosylation". Chapter 12. ISBN 978-953-51-0771-2
- Guevara-Balcazar G, Rubio-Gayosso I, Miliar-Garcia A, Castillo C, Ramirez-Sanchez I, et al. (2008) Mannose polymer induces vasodilation through a luminal mannose receptor in rat mesenteric arteries. Front Biosci 13: 5294-5303. [Crossref]
- Bevan JA and Joyce EH (1993) Calcium dependence of flow-induced dilation: evidence of cooperative interaction with sodium. Hypertension 21: 16-21.
- Koller A, Sun D, Huang A, Kaley G (1994) Co-release of nitric oxide and prostaglandins mediates flow-dependent dilation of rat gracilis muscle arterioles. Am J Physiol 267: H326-H332. [Crossref]
- Davignon J, Lorenz RR, Shepherd JT (I965) Response of human umbilical artery to changes in trunsmural pressure. Am J Physiol 209: 51-59.
- Campos AH, Calixto JB (1994) Mechanisms involved in the contractile responses of kinins in rat portal vein rings: mediation by B1 and B2 receptors. J Pharmacol Exp Ther 268: 902-909. [Crossref]
- Marsault R, Illiano S, Vanhoutte PM (1997) Bradykinin-induced contractions of canine saphenous veins: mediation by B2 receptors and involvement of eicosanoids. Br J Pharmacol 120: 215–220. [Crossref]
- Fischer LG, Hollmann MW, Horstman DJ, Rich GF (2000) Cyclooxygenase inhibitors attenuate bradykinin-induced vasoconstriction in septic isolated rat lungs. Anesth Analg 90: 625-631. [Crossref]
- Ihara E, Derkach DN, Hirano K, Nishimura J, Nawata H, et al. (2001) Ca2+ influx in the endothelial cells is required for the bradykinin-induced endothelium-dependent contraction in the porcine interlobar renal artery. J Physiol 534: 701–711. [Crossref]
- Radenković M, Stojanović M, Skorupan N, Prostran M (2013) Pharmacological analysis of the rat femoral artery response to bradykinin. Sci Pharm 81: 749-761. [Crossref]
- Nawa H, Kurosaki Y, Kawasaki H (2004) Different Prostanoids Are Involved in Bradykinin-Induced Endothelium-Dependent and -Independent Vasoconstriction in Rat Mesenteric Resistance Arteries. J Pharmacol Sci 94: 115–121.
- Barajas-Espinosa A, Ramiro-Diaz J, Briones-Cerecero E, Chi-Ahumada E, De la Rosa AB, et al. (2008) Involvement of endothelial Man and Gal-binding lectins in sensing the flow in coronary arteries. Front Biosci 13: 5421-5431. [Crossref]
- Hermanson GT, Mallia AK, Smith PK (1992) Immobilized affinity ligand techniques. Academic Press. San Diego California. Pp 163-165.
- Taylor ME, Drickamer K (2003) Introduction to glycobiology. Oxford University Press. New York.
- Stolz DB, Ross MA, Salem HM, Mars WM, Michalopoulos GK, et al. (1999) Cationic colloidal silica membrane perturbation as a means of examining changes at the sinusoidal surface during liver regeneration. Am J Pathol 155: 1487–1498. [Crossref]
- Chaney LK, Jacobson BS (1983) Coating cells with colloidal silica for high yield isolation of plasma membrane sheets and identification of transmembrane proteins. J Biol Chem 258: 10062-10072. [Crossref]
- Rubio R, Ceballos G (2000) Role of the endothelial glycocalyx in dromotropic, inotropic, and arrythmogenic effects of coronary flow. Am J Physiol Heart Circ Physiol 278: H106-116. [Crossref]
- Rubio R, Torres-Tirado D, Castillo-Hernandez J, Chi-Ahumada E, Ramiro-Diaz J, et al. (2013). The coronary endothelium behaves as a functional diffusion barrier for intravascular angiotensin II. Vasc Pharmacol 5: 854-863. [Crossref]
- Kolka CM, Bergman RN (2012) The barrier within: endothelial transport of hormones. Physiology (Bethesda) 27: 237-247. [Crossref]
- Bevan JA, Duckles SP (1975) Evidence for alpha-adrenergic receptors on intimal endothelium. Blood Vessels 12: 307-310. [Crossref]
- Larsen BT, Zhang DX, Gutterman DD (2007). Epoxyeicosatrienoic Acids, TRP Channels, and Intracellular Ca2+ in the Vasculature: An Endothelium-Derived Endothelium-Hyperpolarizing Factor? Arterioscler Thromb Vasc Biol 27: 2496-2498. [Crossref]
- Rubio R, Ceballos G (2000) Functional implications of sole and selective activation of intravascular coronary endothelial hormonal receptors. Acta Pharmacol Sin 21: 577-586. [Crossref]
- Wirth K, Hock FJ, Albus U, Linz W, Alpermann HG, et al. (1991) Hoe 140 a new potent and long acting bradykinin-antagonist: in vivo studies. Br J Pharmacol 102: 774-777. [Crossref]
- Gonzalez-Castillo C, Rubio R, Zenteno-Savin T (2003) Coronary flow-induced inotropism is modulated by binding of dextrans to the endothelial luminal surface. Am J Physiol Heart Circ Physiol 284: H1348-357. [Crossref]
- Buonassisi V, Root M (1975) Enzymatic degradation of heparin related mucopolysaccharides from the surface of endothelial cell cultures. Biochim Biophys Acta 385: 1–10. [Crossref]
- Desjardins C, Duling BR (1990) Heparinase treatment suggests a role for endothelial cell glycocalyx in the regulation of capillary hematocrit. Am J Physiol Heart Circ Physiol 258: H647–H654. [Crossref]
- Henry CB, Duling BR (1999) Permeation of the luminal capillary glycocalyx is determined by hyaluronan. Am J Physiol 277: H508-514. [Crossref]
- Pino RM (1987) Perturbation of the blood-retinal barrier after enzyme perfusion. A cytochemical study. Lab Invest 56: 475-480. [Crossref]
- Marcum JA, McKenney JB, Galli SJ, Jackman RW, Rosenberg RD (1986) Anticoagulantly active heparin-like molecules from mast cell-deficient mice. Am J Physiol 250: H879-888. [Crossref]
- Vink H, Duling BR (2000) Capillary endothelial surface layer selectively reduces plasma solute distribution volume. Am J Physiol Heart Circ Physiol 278: H285–H289. [Crossref]
- Hsiai TK (2008) Mechanosignal transduction coupling between endothelial and smooth muscle cells: role of hemodynamic forces. Am J Physiol Cell Physiol 294: C659-C661. [Crossref]
- Tzima E, Irani-Tehrani M, Kiosses WB, Dejana E, Schultz DA, et al. (2005) A mechanosensory complex that mediates the endothelial cell response to fluid shear stress. Nature 437: 426-431.
- AbouAlaiwi WA, Takahashi M, Mell BR, Jones TJ, Ratnam S, et al. (2009) Ciliary Polycystin-2 is a mechanosensitive Calcium channel involved in nitric oxide signaling cascades. Circ Res 104: 860-869.
- Potter DR, Damiano ER (2008) The hydrodynamically relevant endothelial cell glycocalyx observed in vivo is absent in vitro. Circ Res 102: 770-776. [Crossref]
- Ebong EE, Macaluso FP, Spray DC, Tarbell JM (2011) Imaging the Endothelial Glycocalyx In Vitro by Rapid Freezing/Freeze Substitution Transmission Electron Microscopy. Arterioscler Thromb Vasc Biol 31: 1908-1915. [Crossref]
- Hall RA, Vodyanoy V, Quan A, Sinnarajah S, Suppiramaniam V, et al. (1996) Effects of heparin on the properties of solubilized and reconstituted rat brain AMPA receptors. Neurosci Lett 217: 179-183. [Crossref]
- Ando J, Yamamoto K (2009) Vascular mechanobiology: endothelial cell responses to fluid shear stress. Circ J 73: 1983-1992. [Crossref]
- Perez DM, Karnik SS (2005) Multiple signaling states of G-protein-coupled receptors. Pharmacol Rev 57: 147-161. [Crossref]
- Zocher M, Fung JJ, Kobilka BK, Müller DJ (2012) Ligand-Specific Interactions Modulate Kinetic, Energetic, and Mechanical Properties of the Human ß2 Adrenergic Receptor. Structure 20: 1391–1402. [Crossref]