Abstract
In this study, we report the synthesis of spherical MnO2 nanoparticles using spray pyrolysis method. The synthesized particles were characterized by powder X-ray diffraction, Brunauer–Emmett–Teller (BET), scanning electron microscopy (SEM), and transmission electron microscopy (TEM). The SEM image showed spherical nanoparticles with average size of 65 nm, which was in agreement with the TEM measurement. The results of the N2 adsorption–desorption analysis indicated that the BET surface area of the spherical nanoparticles was 102 m2 g-1 with the pore size diameter of 15.18 nm. The electrochemical measurements such as cyclic voltammetry and electrochemical impedance spectroscopy were made in the solution of 0.1 M Li2SO4 and Na2SO4 electrolytes. At lower scan rates the Na2SO4 electrolyte showed a maximum specific capacitance of 68 F g-1 whereas in the Li2SO4 electrolyte it was found to be 63 F g-1. Moreover, Nyquist plot revealed that Na2SO4 electrolyte had a lower charge transfer resistance (Rct) value when compared to Li2SO4 electrolyte.
Key words
nanostructures, chemical synthesis, electrochemical measurements, electrochemical properties
Introduction
In recent years, the interest in the development of alternative energy storage/conversion devices with high power and energy densities has grown up rapidly in view of the change in climate and depletion of fossil fuels [1,2]. Supercapacitors or electrochemical capacitors (ECs), as a kind of attractive charge storage device, have gained enormous attention because of their higher power density and excellent cyclic stability than batteries and greater energy density than conventional dielectric capacitors [3–6]. The advantage of higher power delivery or uptake (10 kW kg-1) during a shorter period, supercapacitors are playing a vital role in complementing or even replacing batteries in diverse energy storage fields such as hybrid electric vehicles, modern electronic devices, and uninterruptible power supplies for computers [5–7]. There are two types of mechanisms to store the energy namely electrical double-layer capacitors (EDLCs) and pseudocapacitors (PSCs) [3]. The PSCs are more attractive than EDLCs because of their higher specific capacitance and energy density through fast faradic redox reactions [8,9].
Generally, transition metal oxides and conducting polymers are used as PSC electrode. Among all the metal oxides, hydrated ruthenium oxide (RuO2) showed most excellent performance with an ultimate storage of 720 F g-1 [10]. However, the high cost of ruthenium and the non-ecofriendly nature associated with the use of strong acidic electrolyte such as sulfuric acid have limited from its commercial uses [10–13]. Accordingly, the transition metal oxides as alternate electrode materials are being extensively tested by retaining their capacitive characteristics [14]. During this progress, manganese dioxide (MnO2) is being identified as most the promising electrode material candidate due to its abundance, low cost, and environmental compatibility [15]. The theoretical, specific capacitance of MnO2 takes the value up to 1110 F g-1 as the oxidation state of manganese ion transition lies in between Mn4+ and Mn3+ over the potential window of 1.0 V [16]. The high specific capacitance of MnO2 electrode makes it an ideal candidate to be used as electrode in supercapacitors with the limitation of its 30% of theoretical capacitance [17,18].
It has been emphasized that the specific capacitance and power density of MnO2 performance are not only related to its crystal structure but also greatly depend on its textural properties such as morphology, surface area, pore size, and pore volume [19,20]. It is well known that nanotechnology has a significant role in synthesizing electrode active materials with controlled size, shape, and structure with distinct properties than their bulk counterparts [15,21,22]. The surface redox reaction is one of the best ways to obtain a very thin layer of the active materials for PSCs by producing manganese dioxide with high specific surface area. One method is preparing MnO2 with porous structure, which enhances ion diffusion between MnO2 and the electrolyte so as to facilitate redox reaction [23,24].
Different chemical synthesis methods such as sol–gel [25], precipitation [26], and solvothermal[27], and physical methods including electrodeposition [28] and thermal decomposition [29] are developed for the preparation of MnO2 nanostructures. However, physical methods are often advantageous compared to chemical methods due to their limitations such as washing, drying, and calcinations. The output powders obtained from the above are more crystalline and less agglomerated particles with higher specific surface area [30].
Therefore, in this study, we report spray pyrolysis method as a synthesis route for the preparation of MnO2 nanoparticles. In this study, manganese nitrate solution was used as a metal precursor that contains manganese component which is able to produce spherical morphology with higher surface area. To confirm the crystal structure and surface morphology, the prepared MnO2 nanoparticles were comprehensively characterized. The electrochemical properties of the nanoparticles were investigated in neutral aqueous electrolytes such as Li2SO4 and Na2SO4. The results showed that they can be substantially used as an electrode material for supercapacitors.
Experimental
Preparation of manganese nitrate precursor
The pure manganese nitrate (500 ml; 45%–50% sol, diluted in nitric acid) was purchased from LobaChemie (Mumbai, India). The precursor solution was prepared by direct mixing of manganese nitrate in 500 ml double-distilled water and then stirred rigorously until a homogeneous mixture was obtained. To stabilize the prepared solution, a few drops of H2O2 were added. Hot air was used as a carrier to transport the precursor solution into the reaction chamber and also to supply the required pressure for atomizing the solutions. The temperature used for the decomposition of precursor solution in the reaction chamber was 673 K.
Production of MnO2 nanoparticles
The MnO2 nanoparticles were prepared using spray pyrolysis technique [31]. In this process, the manganese nitrate precursor solution is first pumped into a two-way fluid nozzle atomizer that converts the solution to spray of fine droplets by adjusting the feed pump flow rate to 2–3 rpm. The compressed hot air is brought into contact with the fine droplets in the reaction chamber through which the moisture is rapidly evaporated, decomposed from the droplet surface, and then leaves dried solid particles on the bottom of the drying chamber. The resulting particles are recovered from the air stream through a cyclone and then collected using a glass container.
Characterization
Powder X-ray diffraction: The phase structure and crystallinity of the MnO2 particles were determined through an X-ray diffractometer (X’Pert PRO; PANalytical, Almelo, the Netherlands) using Cu Kα as a radiation source (λ = 0.15406 Å). An operational voltage and current of 40 kV and 30 mA, respectively, were used and the sample was scanned in the 2θ range from 10° to 80° at a scanning rate of 10° s-1. The mean crystallite size of MnO2 nanoparticles was calculated using Scherrer formula.
Brunauer–Emmett–Teller (BET) surface area analyzer: The specific surface area was calculated by the BET method using a BET surface area analyzer (Autosorb AS-1MP, Quantachrome, Boynton Beach, FL). The sample was degassed under vacuum at 363 K for 3 h to remove the physisorbed moisture. The physisorption analysis was carried out with N2 adsorption–desorption measurements under liquid N2 temperature. The mean pore size distributions and total pore volume were calculated using the Barret–Joyner–Halenda (BJH) method.
Microscopic analysis: The microscopic feature and surface morphology were examined through scanning electron microscopy (SEM; JSM-6390LV, JEOL, Tokyo, Japan) equipped with energy-dispersive X-ray spectroscopy (EDX; JED-2300; JEOL). Transmission electron micrograph (TEM) was observed through an electron microscope (CM200; Philips), operated at a voltage of 200 kV. The sample used in the TEM analysis was prepared by placing a drop of MnO2 particle aqueous suspension onto a copper grid covered with a carbon film and evaporating the drop in air.
Electrode fabrication and electrochemical measurements
The working electrodes were fabricated by mixing the prepared MnO2 nanoparticles with acetylene black and polyvinylidene fluoride at a ratio of 85:10:5 wt%. A small amount of n-methyl-2-pyrrolidinone solvent was added into the mixture to a form a homogeneous paste. The paste was then incorporated into a stainless steel (SS) current collector (1 cm2) and then dried in a vacuum oven at ambient temperature. The electrochemical behaviors of the MnO2 electrode were studied on a potentiostat electrochemical workstation (VersaSTAT 3; Princeton Applied Research) using the traditional three-electrode system, containing 0.1 M Li2SO4 and Na2SO4 aqueous solution as electrolytes. Platinum foil and a saturated KCl electrode (Ag/AgCl) were used as the counter and reference electrode, respectively. The CV measurements were performed between 0 and 0.9 V (versus Ag/AgCl) at scanning rates ranging from 1 to 100 mV s-1. The specific capacitance was calculated by integrating the area of CV curves as,
 ------(1)
Where I is the average current (mA), dv/dt the voltage scan rate (mV s-1), and q the mass of the active material (g). The electrochemical impedance spectroscopy measurements in the form of Nyquist plot were carried out in frequency range of 0.1–105 Hz. The mass of the active material loaded in the current collector was 1 mg.
Results and discussion
Characterization of materials
The powder X-ray diffraction pattern of the prepared MnO2 nanoparticles is shown in Figure . 1. It indicates that the obtained nanoparticles are completely in agreement with the standard pattern of body-centered tetragonal α-MnO2 (JCPDS file no. 44-0141), where the two diffraction peaks at 2θ values (37° and 57°) can be ascribed due to the <211> and <431> reflection planes of MnO2. The average crystallite size was calculated using Debye–Scherrer formula and it was found to be approximately 15 nm. The N2 adsorption–desorption isotherm plot and corresponding BJH pore size distribution (inset in Figure 2) are shown in Figure 2. The Figure shows that the isotherm of the sample is typically of type-IV behavior and exhibits obvious H1 hysteresis loops, which is a characteristic feature of mesoporous particles [32]. The multipoint measurements show that the BET surface area of the spherical MnO2 nanoparticles is 102 m2 g-1, with an average pore diameter of 15.18 nm, according to the BJH method.
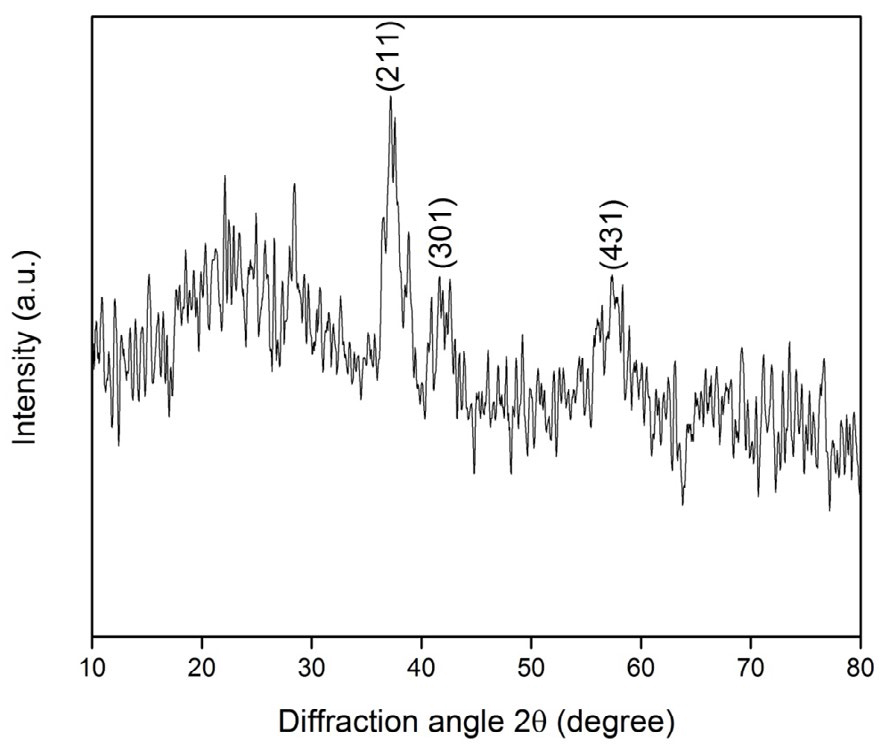
Figure 1. X-ray diffraction pattern of MnO2nanoparticles
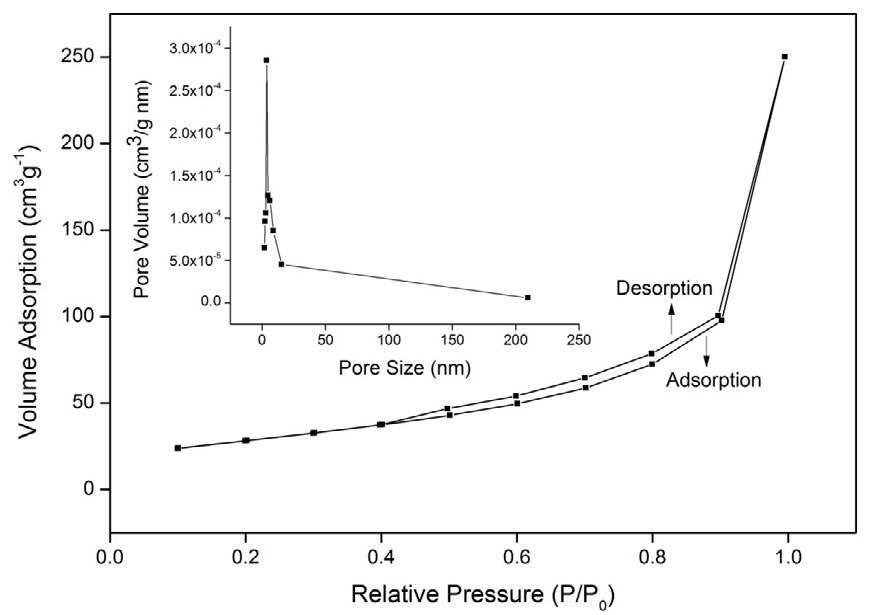
Figure 2. .N2 adsorption–desorption isotherm and BJH pore size distribution (insert) of
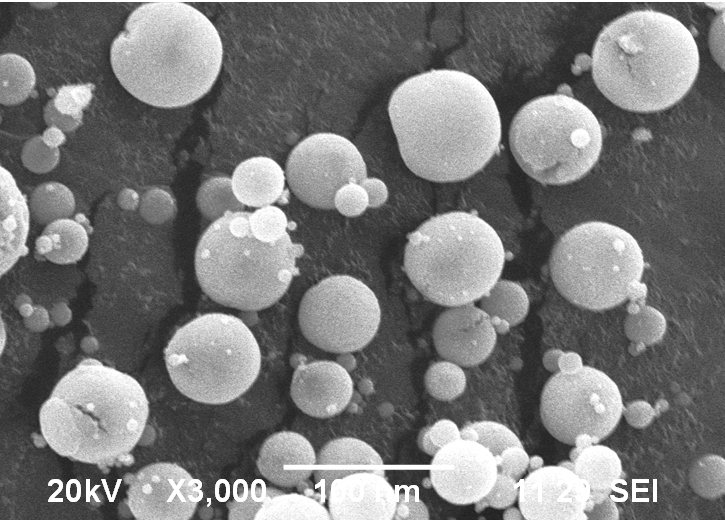
The microstructure and surface morphology of the prepared nanoparticles were examined by SEM and TEM, which are shown in Figures 3 and 4, respectively. As seen in SEM image (Figure 3), the nanoparticles have a well-defined spherical morphology with particle size ranging from 20 to 85 nm. The average particle size was calculated by considering the maximum and minimum size of the particles. It is obvious that the obtained average particle size (65 nm) is in close agreement with that obtained from the TEM measurement. However, a similar morphology of spherical nanoparticles with an average size of 85 nm is observed in the TEM micrograph, which is shown in Figure 4. This well-defined spherical structure is expected to create a definite pore, which plays an important role in contacting the electrode/electrolyte interfacial area in order to provide a better electrochemical performance when used as an active material in the Ecs [33]. The EDX profiles show that the prepared nanoparticles have high-purity content with the composition of Mn and O. The elemental composition is shown in the form of a table (Figure 5 inset).
MnO2nanoparticles
Figure 3. SEM photomicrograph of spherical MnO2nanoparticles
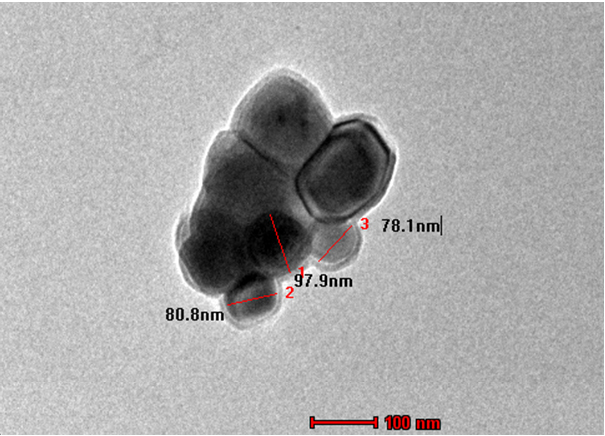
Figure 4. TEM photomicrograph of spherical MnO2nanoparticles
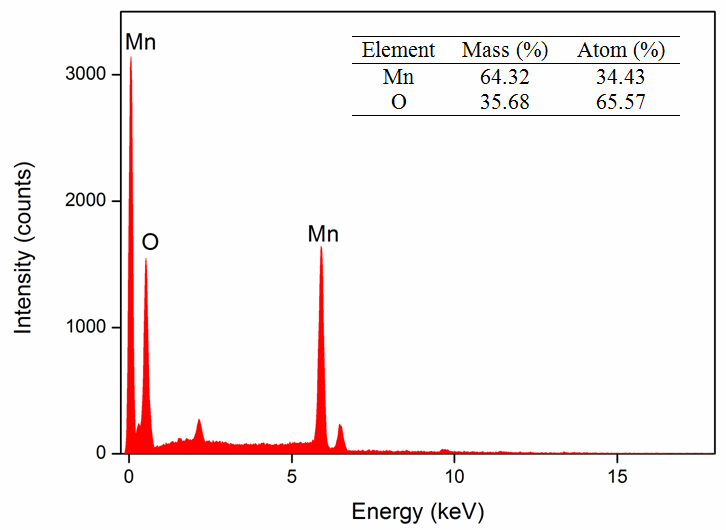
Figure 5. EDX profile of spherical MnO2nanoparticles
Electrochemical characterization
Figure 6 shows CV curves of the prepared MnO2 electrode at different scan rates (1, 2, 5, 10, 20, 50, and 100 mV s-1) in 0.1 M aqueous Li2SO4 and Na2SO4 electrolytes. None of the redox peaks exists in the CV curves, and the cathodic and anodic current lines are mirror symmetry, which indicates that the electrodes are charged and discharged at a constant rate over the complete cycle. At slow scan rates, the CV curves are substantially rectangular in both the electrolytes, indicating good capacitive characteristics. As the scan rates increase to 20, 50, and 100 mV s−1, all CV curves show a shape transformation to an inclined oval. The oval CV curve results in a poor capacitance due to the limited diffusion of ions in the electrode material [34,35]. This can be explained on the basis of charge storage mechanism. One is adsorption/desorption of protons (H+) or alkaline cations (C+) on the MnO2 surface, which is likely to be predominant in amorphous structure.
 ---------(2)
where C+ = Li+ and Na+.
The other is based on the intercalation/de-intercalation of H+ or C+. For this, the pure crystalline form of MnO2 is expected.
 ---------------(3)
It can be seen from Eqns (2) and (3) that both the protons and cations are involved in the redox reactions of MnO2 nanoparticles. In our study, the prepared nanoparticles show a spherical morphology with a large surface area, which generates the solvated Li+or Na+ to reach the MnO2 surface easily and accesses the voids/pores of the inner surface, which results in a high psuedocapacitance value. As the hydrated ionic radius of Na+ (3.58 Å) is the smallest and its ionic conductivity is the highest, access to the inner surface of the spherical MnO2 electrode is much easier and faster when compared to that of Li+ (3.82 Å). Therefore, it can be concluded that the degree of diffusion of the cations on the surface affects the specific capacitance.
The relationships between the calculated specific capacitance and potential scan rate for the two electrolytes are shown in Figure 7. It can be seen that the specific capacitance shows a declining tendency with increased scan rates for both electrolytes. For Na2SO4 electrolyte, the maximum specific capacitance is 68 F g-1 at a low scan rate of 1 mV s-1 whereas for Li2SO4 electrolyte it is 63 F g-1, which is evidently low when compared to that of Na2SO4 electrolyte.
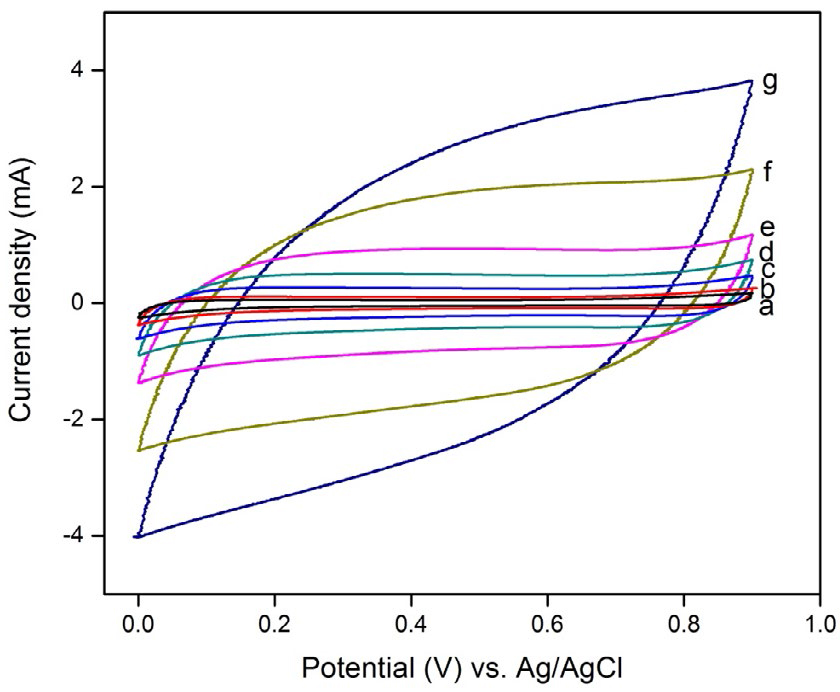
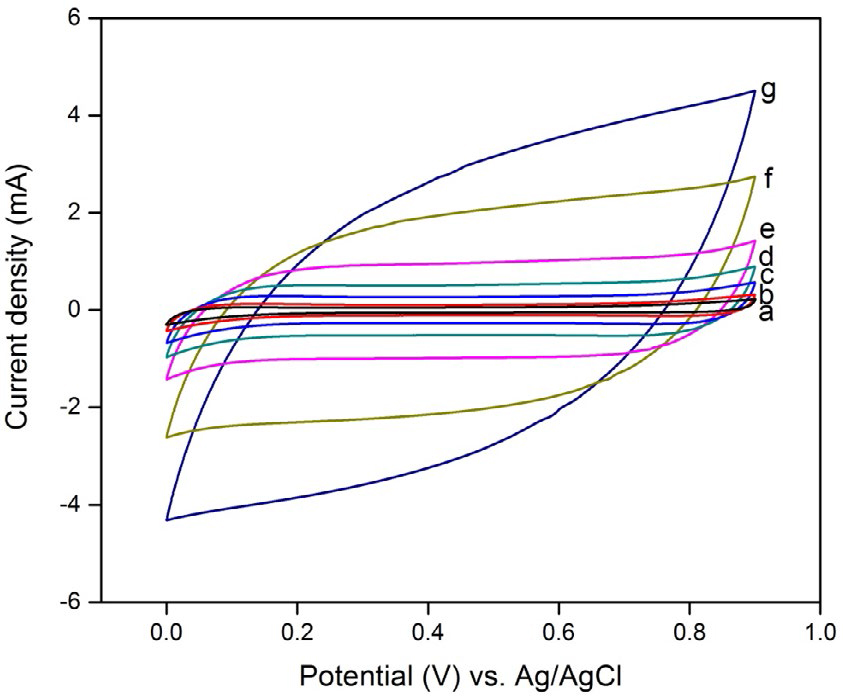
Figure 6. CV curves of spherical MnO2 electrode at different scan rates in 0.1 M aqueous
Li2SO4 and Na2SO4 electrolytes
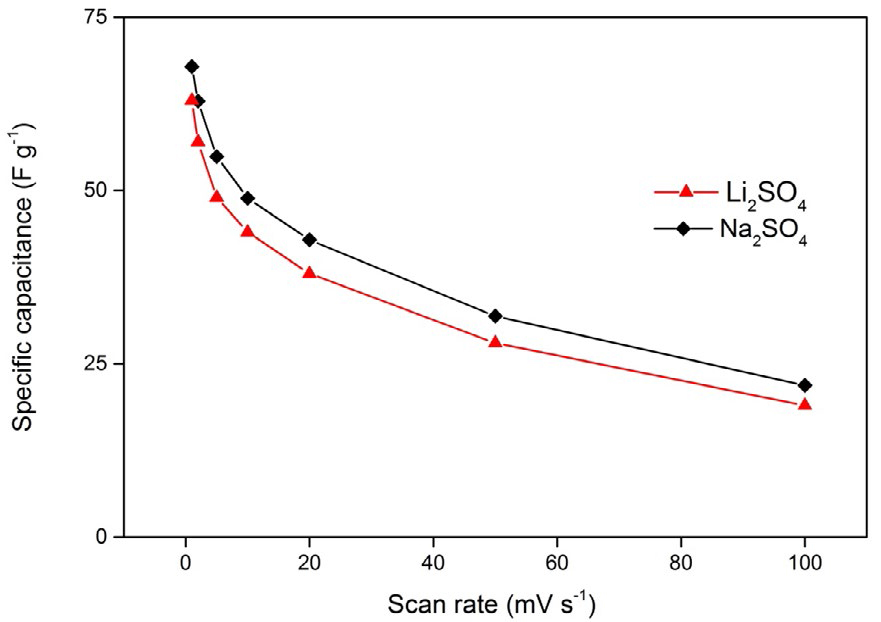
Figure 7. Specific capacitance variations of the spherical MnO2 electrode at different scan rates
in 0.1 M aqueous Li2SO4 and Na2SO4 electrolytes
The Nyquist plots obtained for the MnO2 electrode in 0.1 M aqueous Li2SO4 and Na2SO4 electrolytes are presented along with the standard equivalent circuit in Figure 8. As seen in Figure 8a, the Nyquist plots in the two electrolytes are similar, consisting of a semicircle at high frequency and a linear region at the low frequency. A high-frequency intercept at real axis (Z¢) corresponds to the total ohmic resistance (Rs), which consists of electrolyte, intrinsic, and electrical resistances that are, respectively, 70.8 and 15.5 Ω for Li2SO4 and Na2SO4 electrolytes, indicating less internal resistance in Na2SO4 electrolyte. As expected, Na2SO4 shows the smallest Rs. However, the semicircle region of the high frequency reflects the charge transfer (Rct) process at the interface of active material and electrolyte. The smaller the diameter of the semicircle, the lower the Rct resistance value obtained [34,36].
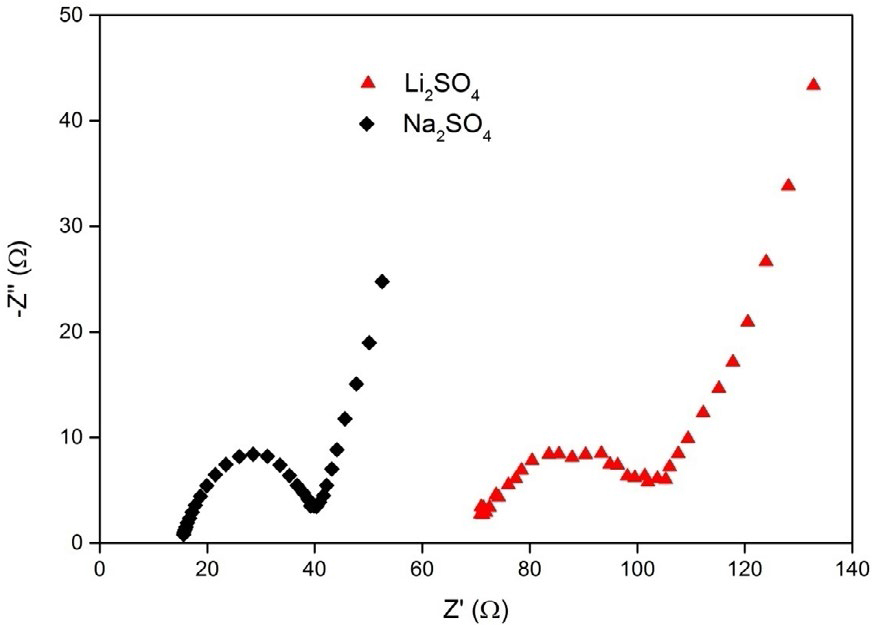
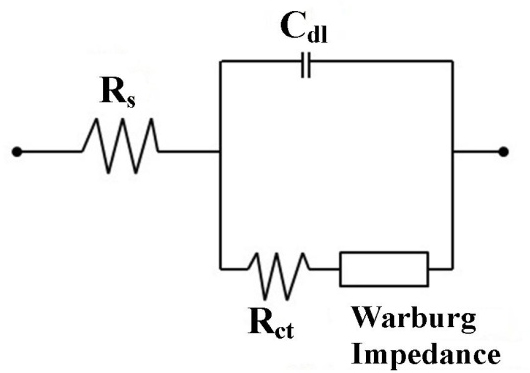
Figure 8. Nyquist plot and the standard equivalent circuit of the spherical MnO2 electrode in 0.1
M aqueous Li2SO4 and Na2SO4 electrolytes
In our study, it can be seen that Na2SO4 electrolyte shows a semicircle in smaller diameter region, which indicates that it has a lower Rct value than Li2SO4 electrolyte due to the lower ionic radius of Na+ and higher ionic conductivity. The results obtained in the Nyquist plot match well with the CV data in Figure 6. Therefore, in this study, it is observed that the prepared spherical MnO2 nanoparticles showed better electrochemical performance merely in Na2SO4 electrolyte and not in the other electrolytes, i.e., Li2SO4.
Conclusion
In summary, spray pyrolysis method was successfully used for the synthesis of spherical MnO2 nanoparticles. The electrochemical properties were investigated in neutral aqueous electrolytes such as Li2SO4 and Na2SO4. The observed results show that MnO2 nanoparticles exhibited a superior ideal capacitive behavior in Na2SO4 electrolyte when compared with Li2SO4 electrolyte. This is mainly due to the smallest hydrated radius of Na+, highest ionic conductivity, and smallest charge transfer resistance (Rct). The obtained maximum specific capacitance was found to be 68 and 63 F g-1, respectively, for the electrolytes Na2SO4 and Li2SO4.
References
- Yin B, Zhang S, Jiang H, Qu F, Wu X (2015) Phase-controlled synthesis of polymorphic MnO2 structures for electrochemical energy storage. J Mater Chem A 3: 5722–5729.
- Yang P, Li Y, Lin Z, Ding Y, Yue S (2014) Worm-like amorphous MnO2 nanowires grown on textiles for high-performance flexible supercapacitors. J Mater. Chem A 2: 595–599.
- Conway, BE (1999) Electrochemical Supercapacitors: Scientific Fundamentals and Technological Applications. Kluwer Acedamic/Plenum Publishers, New York.
- Simon P, Gogotsi Y (2008) Materials for electrochemical capacitors. Nat Mater 7: 845-854. [Crossref]
- Zhu Y, Murali S, Stoller MD, Ganesh KJ, Cai W, et al. (2011) Carbon-based supercapacitors produced by activation of graphene. Science 332: 1537-1541. [Crossref]
- Miller JR, Simon P (2008) Materials science. Electrochemical capacitors for energy management. Science 321: 651-652. [Crossref].
- Yun YS, Cho SY, Shim J, Kim BH, Chang SJ, et al. (2013) Microporous carbon nanoplates from regenerated silk proteins for supercapacitors. Adv Mater 25: 1993-1998. [Crossref]
- Wei W, Cui X, Chen W, Ivey DG (2011) Manganese oxide-based materials as electrochemical supercapacitor electrodes. Chem Soc Rev 40: 1697-1721. [Crossref]
- Toupin, M, Brousse, T, Belanger, D (2004) : Charge storage mechanism of MnO2 electrode used in aqueous electrochemical capacitor. Chem Mater16, 3184–3190.
- Yuqiu, H, Hongcheng, Z (2011): Cathodic Potentiostatic Electrodeposition and Capacitance Characterization of Manganese Dioxide Film. IPCBEE. 2: 130–133
- Zheng, JP, Cygan, PJ, Jow, TR (1995): Hydrous Ruthenium Oxide as an Electrode Material for Electrochemical Capacitors. . Electrochem Soc 142: 2699–2703.
- Prasad KR, Miura N (2004)Potentiodynamically deposited nanostructured manganese dioxide as electrode material for electrochemical redox supercapacitor. J. power sources 135: 354–360.
- Wang P, Yu-Jing, Zhao, Wen L, Jian-Feng Chen, Lei Z (2014): Ultrasound-microwave Assisted Synthesis of MnO2 Supercapacitor Electrode Materials. Ind. Eng Chem Res 53: 20116–20123.
- KhomenkoV,Raymundo-Pinero E, Beguin, F (2006): Optimisation of an asymmetric manganese oxide/activated carbon capacitor working at 2 V in aqueous medium. J Power Sources 153: 183–190.
- Li X, Wang G, Wang X, Li XJi J (2013) Flexible supercapacitor based on MnO2 nanoparticles via electrospinning. J Mater Chem A: 10103–10106.
- NayakPK, Munichandraiah N (2012) Rapid sonochemical synthesis of mesoporous MnO2 for supercapacitor applications. Mater Sci Eng B 177: 849–854.
- Liu R, Lee SB (2008) MnO2/poly(3,4-ethylenedioxythiophene) coaxial nanowires by one-step coelectrodeposition for electrochemical energy storage. J Am Chem Soc130: 2942-2943.[Crossref]
- Fischer AE, Pettigrew KA, Rolison DR, StroudRM, Long JW (2007): Incorporation of Homogeneous, Nanoscale MnO2 within Ultraporous Carbon Structures via Self-Limiting ElectrolessDeposition:Implications for Electrochemical Capacitors. Nano Lett 7: 281–286.
- Li GR,Feng ZP, Ou YN, Wu D, Fu R, et al. (2010) Mesoporous MnO2/carbon aerogel composites as promising electrode materials for high-performance supercapacitors. Langmuir 26: 2209-2213. [Crossref]
- Wan C, Yuan L, Shen H (2014) Effects of Electrode Mass-loading on the Electrochemical Properties of Porous MnO2 for Electrochemical Supercapacitor. Int J Electrochem Sci 9: 4024–4038.
- SritherSR, Karthik A, Selvam M, Saminathan K, Rajendran V (2014) Nano-sized MnO2 particles produced by spray pyrolysis for a Zn/MnO2 primary cell: comparative discharge performance studies with their bulk counterparts. RSC Adv 4, 42129–42136.
- Yousefi T, DavarkhahR, Golikand AN, Mashhadizadeh MH (2013): Synthesis, characterization, and supercapacitor studies of manganese (IV) oxide nanowires Mater Sci Semicond Process 16: 868–876.
- DevarajS, Munichandraiah N (2008): Effect of Crystallographic Structure of MnO2 on Its Electrochemical Capacitance Properties. J Phys Chem C 112: 4406–4417.
- GhodbaneO, Jean-Louis Pascal, Favier F (2009) Microstructural Effects on Charge-Storage Properties in MnO2-Based Electrochemical Supercapacitors. Appl Mater Interfaces 5: 1130–1139.
- Wang X, Wang X, Huang W, Sebastian PJ, Gamboa S (2005) Sol–gel template synthesis of highly ordered MnO2 nanowire arrays. J Power Sources 140: 211–215.
- Kumar H, Manisha, SangwanP (2013) Synthesis and Characterization of MnO2 Nanoparticles using Co-precipitation Technique. Int J Chem. Chem. Eng. 3, 155–160.
- Wen-Yin, Ko, Lung-Jing, Chen, Yu-Hung, Chen (2014)Solvothermal synthesis of shape-controlled manganese oxide materials and their electrochemical capacitive performances. J Mater Res 107–114.
- Nayak PK, Munichandraiah N (2009) Simultaneous Electrodeposition of MnO2 and Mn(OH)2 for Supercapacitor Studies. Electrochem Solid-State Lett. 12: A115–A119.
- Lee HY, Manivannan V, Goodenough JB (1999) Electrochemical capacitors with KCl electrolyte. C.R AcadSci Se. IIc: Chim. 2: 565–577.
- Kodas TT, Hampden-Smith MJ (1999) Aerosol Processing of Materials. Wiley-VCH, New York.
- Manivasakan P, Karthik A, RajendranV (2013) Mass production of Al2O3 and ZrO2 nanoparticles by hot-air spray pyrolysis. Powder Technol 234: 84–90.
- BrunauerS, Deming LS, Deming WE, Teller E (1940) On a Theory of the van der Waals Adsorption of Gases. J Am Chem.Soc 62: 1723–1732.
- Ma Z, Li T, Huang YL, Liu J, Zhou Y (2013) Critical silicon-anode size for averting lithiation-induced mechanical failure of lithium-ion batteries. RSC Adv 3, 7398–7402.
- Zhang H, Zhang M (2008) Synthesis of CuOnanocrystalline and their application as electrode materials for capacitors. Mater Chem Phys 108: 184–187.
- Mao L, Zhang K, Chan H, Wu J (2012) Nanostructured MnO2/graphene composites for supercapacitor electrodes: the effect of morphology, crystallinity and composition. J Mater Chem 22: 1845–1851.
- Girija TC, Sangaranarayanan MV (2006) Analysis of polyaniline-based nickel electrodes for electrochemical supercapacitors. J Power Sources. 156: 705–711.