Abstract
This work shows the effect of 2 and 5 wt% TiO2 nanoparticles (modified by fluorocarbons and not) and of 1, 3 and 5 wt% ZnO particles on PLA degradation evaluated under UV irradiation, hydrolytical 1N NaOH solution, enzymatical proteinase K solution, and isothermal condition. The presence of TiO2 nanoparticles and ZnO particles decreases the degradation processes of PLA under UV light exposure and increases the PLA hydrolytic degradation. The enzymatic degradation is faster with TiO2 nanoparticles than with ZnO particles, respect neat PLA; whereas the opposite effect is identified in the PLA enzymatic degradation.
Key words
Polylactic acid, titanium dioxide, zinc oxide, biodegradable polymer, degradation
Introduction
Degradation study of polymer nanocomposites is an extremely important area from the scientific and industrial point of view. Chemical degradation of polymers is an irreversible change and it is a very important phenomenon, which affects the performance of all plastic materials in daily life and leads finally to the loss of functionality [1]. The usefulness of a polymer material depends on its durability in a particular environment in which it is used; therefore the investigation of its interaction with environmental factors results of extreme importance [2]. The study of durability and degradability of polymers-nanoparticulate systems under environmental conditions will give an insight to their applications as well as limitations. Photo-oxidative degradation is the process of decomposition of the material by the action of light, which is considered as one of the primary sources of damage of polymeric substrates in ambient conditions [3]. Although a significant scientific activity has been carried out on the photo-oxidation of nanocomposites with classical polymer matrices, such as polypropylene, polyethylene, and polycarbonate [4], however the literature is rather scarce with regard to nanobiocomposites. So far, the major part of the research work dealing with nanobiocomposite materials have been focused mainly on the preparation methods as well as the structure/properties relationships, especially the nanodispersion effect of the nanofiller on the functional properties. Other studies regarding the susceptibility of PLA nanocomposites for both hydrolytic and thermal degradation are reported in literature [5,6]. It is important to note that depending on the field of application, there are cases where the acceleration of degradation is desirable, while in other cases, it is required to extend the service
life of PLA. As reported in the literature, the effective use of degradable polymers relies on the ability to control the onset and time needed for degradation [7,8]. Thus, not only, the challenge is that PLA properties should be kept at the required level during the specific period of utilization but the material should degrade in a rapid and controlled manner afterward. On the other hand, it is generally assumed that PLA hydrolysis in presence of nanofillers is a complex phenomenon depending on their specific morphology, dispersion, relative hydrophilicity, or in some cases, hydrophobicity, catalytic activity, etc. [9]. However, by considering the complex effect of nanofillers, it was reported that they can favour or delay the hydrolytic degradation of PLA [10]. The hydrolytic stability of PLA based materials can be tailored to obtain predetermined degradation profiles. As aforementioned, PLA is known to mostly degrade through hydrolytic chain cleavage occurring at the level of the aliphatic ester functions and yielding to low molecular weight residues, i.e. lactic acid and related oligomers, able to biodegrade and ultimately be bioassimilated [8]. Microbial and enzymatic degradation of PLA have recently been studied by many researchers because these types of degradations usually do not need the high temperatures to be accomplished. Williams [9] was the first to report the degradation for PLLA by proteinase K from Tritirachium.album.; then many studies were done for finding different enzymes corresponding PLA degradation. Reported enzymes that enable to degrade PLA in different scale include, alkaline protease, serine proteases such as subtilisin, trypsin, elastase, and α-chymotrypsin [11], Cutinase-like enzyme [12]. Lipase could hydrolyze low molecular weight PLLA and some copolymers such as PDLLA (poly D,L-Lactic Acid) and, poly(D-lactid-co-glycolide) but not PDLA (Poly D-lactic acid) and high molecular weight PLLA [13]. Pranamuda and others [14] found an enzyme from Amycolatopsis sp. cultures and named it PLLA depolymerase. The optimum pH for this enzyme was 6.0 and the temperature was a range from 37 to 45°C. PLLA depolymerase can also hydrolyze casein, silk fibroin, succinyl-p-nitroanilide, but not polyhydroxybutyrate (PHB) and polycaprolactone (PCL). The enzymatic degradation of aliphatic polyesters by hydrolysis is a 2-step process. The 1st step is adsorption of the enzyme on the surface of the substrate through surface-binding and the 2nd step is hydrolysis of the ester bond [15]. Pranamuda and others [14] were the first to isolate a PLA-degrading microorganism of Amycolatopsis strain from soil environment, which was capable of degrading 60% of the PLA film after 14 days. Suyama and others [16] reported that PLA-degrading microorganisms are not widely distributed in the natural environment and PLA is less susceptible to microbial attack in the natural environment than other synthetic aliphatic polyesters like PHB, PCL, and poly(butylenes succinate) (PBS). Upon disposal in the environment, PLA is hydrolyzed into low molecular weight oligomers and then mineralized into CO2 and H2O by the microorganisms present in the environment. Microbial degradation of PLA should be studied for packaging of foods containing microorganisms including lactic acid bacteria, and fungi for their probable abilities of PLA degradation. Torres and others [17] reported the ability of assimilation of lactic acid and racemic oligomer products of PLA for 2 strains of Fusarium moniliforme (widely distributed in soil) and on strain of Penicillium roqueforti (the main fungus in blue cheese, and can be isolated from soil) [18]. As itis shown, literature proposes many works on PLA enzymatic degradation, but PLA composite enzymatic degradation is not yet deeply studied. In a previous paper [19] the effect of plain TiO2 and of a modified TiO2 (mTiO2) on thermal, mechanical and UV properties was investigated; whereas in reference 21 the effect of ZnO particles on the mechanical (tensile), permeability and antimicrobial properties of PLA based films was reported.
Regarding the investigation of the PLA/TiO2 system, the study was performed on 2 film compositions, with 2 and 5 wt% of TiO2 (both the plain TiO2 and mTiO2), and it was found that increasing the amount of particles there was an increase of thermostability of PLA and at the same time the addition of mTiO2 to PLA resulted in a slight increase in yield stress and break parameters and also extended the UV absorption area. Regarding the investigation of the PLA/ZnO system [20], the study on 3 film compositions, with 1, 3 and 5 wt% of ZnO, showed some positive effect on the mechanical properties of the composite film compared to the plain PLA film, such as: increase of Young’s modulus and stress at yielding and decrease of permeability to O2 and CO2. For the water vapour permeability it was instead found a slight increase of permeability. Of particular interest it was the antibacterial study: in particular the film with 5 wt% of ZnO showed 99.99% reduction for E. coli after 24 hours demonstrating a very efficient antibacterial activity of ZnO against E. coli. In this work it is shown that the incorporation of particles is an effective tool to control the degradation process in various media [21], so it was evaluated the UV, hydrolytic, enzymatic and thermal degradation of the PLA with the addition of two different fillers, TiO2 (both plain and modified) and ZnO.
Experimental
Materials
Polylactic acid (PLA) in pellets, code PLA 4032D, with d=1.24 g/cm3, was acquired from Nature Works LLC. Molecular weights were determined by GPC-150C Waters Chromatography instrument (Milford, Massachusetts-USA) GPC at IPCB-CNR; they are: Mw=2.1 × 10⁵ (g/mol), Mn=1.3 × 10⁵ (g/mol), polydispersity=1.6 Mw/Mn. Glass transition temperature and melting temperature were also determined at IPCB-CNR by Mettler DSC 822e (Schwerzenbach, Switzerland) with a HR of 20°C/min. The values obtained by DSC were: Tg=58°C and Tm=160°C.
ZnO powder, with particles size of 100-500 nm, was supplied by Pylote SAS in Dremil-Lafage, France [22,23].
Hydrophilic TiO2 nanoparticles (P-25 standard, 99.5% purity, with average particle size 25 nm, 80% anatase and 20% rutile) were obtained from Degussa (Germany), whereas the modified TiO2, that is fluorocarbon modified TiO2 nanoparticles, were supplied by University of Texas, Arlington, USA [19].
Composites preparation
a) PLA/TiO2 films by compression molding
PLA was mixed with the powder of TiO2 using a Barbender Plastograph EC mixer (Kulturstr, Duisburg, Germany) at a screw speed of 50 rpm and mixing temperature of 180°C for 15 minutes. Two formulations were prepared: 2% and 5% wt of neat and functionalized TiO2. Neat PLA and PLA/TiO2 were processed in such a way so that all the analyzed samples have the same thermal history. Films were obtained by compression molding in a press Dr. Collin GmbH P200E (Ebersberg, Germany) at a temperature of 180°C for about 6 minutes, without any additional pressure, to allow complete melting of the material. Subsequently the pressure was increased up to 100 bars and kept constant for about 3 minutes. The press is equipped with water cooling system which brings the system to room temperature in about 5 minutes. Pure PLA and nanocomposites films have been prepared with the thickness of about 150 μm.
b) PLA/ZnO films by extrusion and calender
Before mixing, the PLA pellets, ZnO powder were dried in an oven for 24 h at 65°C under vacuum. The composites were prepared by mixing of the components from the melt using a twin-screw extruder, Collin ZK 25 (D = 25 mm and L/D = 56). A masterbatch formed by 20 wt% of ZnO and 80 wt% PLA was prepared to improve the dispersion of the fillers within the polymer matrix. Then the masterbatch was diluted in PLA in such quantities to obtain three compositions, 1, 3 and 5% by weight of ZnO. The extrusion was conducted by using the following temperatures, from the hopper to the die: 150/170/170/170/160°C. The scre w speed of the dispenser was 20 rpm, while the speed of the extruder screws was 25 rpm. The films were prepared by using a single screw extruder and before the extrusion the pellets (PLA and composites) were again dried in an oven for 24 h at 65°C under vacuum. The single screw extruder has, as terminal, a calender characterized by two counter rotating cylinder that allow the film passing through them still in the plastic state and the third useful to direct the output material until the collecting cylinder. The extruder and the chill roll unit are Collin E 20T and Collin CR 72T, Ebersberg (Germany), respectively. The thickness of the film depends on the light between the two counter-rotating cylinders and the speed of rotation of the collecting cylinder; films with thickness of about 60 μm were obtained for both the compositions. The extrusion was conducted using the following temperatures, from the hopper to the die: 160/170/180/170/180°C. The screw speed of the extruder was 40 rpm.
UV-visible spectrophotometry
UV-visible spectra were monitored with Jasco V-570 spectrophotometer, Columbia, Maryland (USA). The spectra were recorded by using films in transmission mode.
Attenuated total reflection (ATR) Spectroscopy
The attenuated total reflection (ATR) is a sampling technique of infrared spectroscopy. The analysis in internal reflection is based on internal reflection at a glass with high refractive index (usually diamond, ZnSe or GeSe) placed in direct contact with the sample. The radiation passes through the glass and is refracted; then it strikes the sample several times and penetrates for about 2 μm and is reflected, recrossing the crystal and reach the detector. Film samples were analyzed by using a Perkin Elmer Spectrum, Shelton (USA), 100 with resolution of 4 cm-1, in a range of wave number from 4000 to 400 cm-1 and with a scan number of 8.
Degradation experiments 2.5.1 UV degradation
The PLA and composite films were exposed to UV-accelerated weathering tester (Sunrise, Angelantoni Industrie ACS, Perugia, Italy UVA 360 nm) characterized by light intensity of 20 Wm-2. The films were subjected to the UV irradiation at 40°C and at 25% of humidity and removed at given time to be weighed.
For PLA film the test was done once a day for 17 days, whereas for the PLA/TiO2 nanocomposites the test was done once a day up to the 17th day, then once a week up to the 73rd day of the experiment. For PLA and PLA/ZnO composites the test was done once a day up to the 4th day, then once a week up to the 21st day of the experiment. The weight loss percent, Wloss%, was calculated using the following formula equation 1.
 (1)
(1)
where W0 is the initial weight of samples and Wt is the weight at t time of UV exposure.
Hydrolytic degradation
Hydrolytic degradation was carried out on the films (10 mm ×10 mm) at 37°C in a flask containing a solution 1M of NaOH. Samples were kept or maintained in stirring for a given time and periodically removed, washed with distilled water and dried in vacuum at 36°C for 48 h before the weighing. The wei ght loss percent, Wloss%, was calculated using Equation 1, where W0 is the initial weight of samples and Wt is the weight at t time of NaOH solution contact, after dried. For PLA and PLA/TiO2 nanocomposites the incubation time was: 30, 60, 120, 180, 240, 300, 360, 420, 480 and 540 minutes and for PLA and PLA/ZnO composites the incubation time was: 10, 20, 30 and 40 minutes.
Enzymatic degradation (Proteinase K)
Sample films (2.5 cm × 1.0 cm) were placed in vials containing 5 mL of Tris-HCl buffer (pH 8.6), 1 mg of proteinase K (Sigma, lyophilized powder 80% protein) and 1 mg of sodium azide (Sigma-Aldrich, purified 99.5%) in distilled water. For each experiment, three replicate films in separate vials were used to determine the weight loss at specified incubation time (2-4-8-10-12 h). The film/enzyme was kept at 37°C in the rotary shaker (150 rpm). The buffer/enzyme solution was replaced every incubation time to ensure that enzyme activity remained at a desired level throughout the experiment duration and that the solution pH did not drop below pH 8.00.
At specified incubation time (2-4-8-10-12 h) the film was removed from the vial, washed with distilled water and dried under vacuum at 36°C for 48 h before the weighing. The weight loss was calculated with Equation 1, where W0 is the initial weight of sample and Wt is the weight of the sample after being removed from the Proteinase K solution at the end of each specified incubation time (2-4-8-10-12 h) and dried as described above.
Isothermal degradation
Isothermal tests were recorded by Perkin Elmer Diamond instrument, Albany St. Boston, Massachusetts (USA), using alumina pans and oxygen atmosphere at flow rate of 200 ml/min. The following procedure has been used: heating ramp at 20°C/min from room temperature up to 240°C followed by an isotherm for 30 min. The experiments were carried out on about 3 mg of PLA/TiO2 and PLA/ZnO films.
Results and discussions
UV-vis
Figures 1 and 2 report the transmittance percentage (%) as function of the wavelength in the range from 200 to 850 nm. Figure 1 is for PLA/TiO2 nanocomposite films obtained by compression moulding (thickness about 130 μm) and Figure 2 for PLA/ZnO composite films obtained by calender (film thickness about 60 μm). The transmittance percentage indicates the amount of radiation transmitted by the optical medium at a given wavelength. The radiation, that is not transmitted, is reflected or absorbed by the optical medium. The smaller is the transmittance, the greater the absorption. The transmittance values lower than 100% are due to the absence in the instrument of an integrating sphere; this sphere is able to collect the transmitted radiation deflected respect to the direction of the incident radiation due to the asperities present on the film surface.
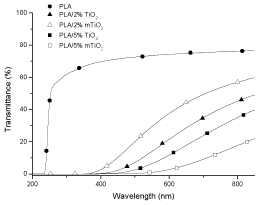
Figure 1. UV-visible spectrum of PLA, PLA/2% TiO2, PLA/2% mTiO2, PLA/5% TiO2 and PLA/5% mTiO2 nanocomposites. The films were obtained by compression molding.
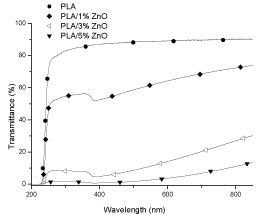
Figure 2. UV-visible spectrum of PLA, PLA/1% ZnO, PLA/3% ZnO and PLA/5% ZnO composites. The films were obtained by calender.
In both the figures, PLA transmittance is reported as reference, and it has to be considered that in figure 1 the transmittance was measured on PLA film obtained by compression moulding, whereas in figure 2 it was measured on PLA film obtained by calender. The figures 1 and 2 underline that by increasing the amount of fillers the transmittance, primarily in the visible region, decreases respect to that of PLA and the shape of the curves are greatly different. This effect could be ascribed to the nature of the filler (TiO2 nanoparticles and ZnO particles), which absorb differently the energy and also to the distribution and agglomeration trend with respect to the fillers loading [24,25]. Comparing the two PLA trends, it results that the compression-moulded PLA film (Figure 1) has lower transmittance than the caledered PLA film (Figure 2).
In particular, in the visible region (400-800 nm) the compression moulded PLA film has a transmittance of about 76%, whereas the calendered film has transmittance of about 90%; these values are almost constant for both samples up to about 300 nm; then at nm lower than 300 the transmittance decreases sharply to 0. This diversity could be ascribed, besides the difference of the film thickness, also to the more asperities present on the surface of the compression-moulded PLA film, as shown in the following SEM micrographs Figure 3. For both the PLA films the transmittance becomes 0 at wavelength range 225-200 nm; this saturation of the spectra, starting at 225 nm, is due to the absorbance of PLA ester groups [26]. For PLA/2% mTiO2 nanocomposite film, Figure 1, the transmittance is 0% from 200 to 368 nm; then the transmittance increases slightly up to 60% (at wavelength 850 nm). For PLA/2% TiO2 nanocomposite film the transmittance is 0% from 200 to 411 nm, after this value the transmittance increases slightly up to 50% (at wavelength 850 nm). For PLA/5% TiO2 nanocomposite film the transmittance is 0% from 200 to 446 nm, after this value the transmittance increases slightly up to 40% (at wavelength 850 nm) and for PLA/5% mTiO2 nanocomposite film the transmittance is 0% from 200 to 498 nm, after this value the transmittance increases slightly up to 22% (at wavelength 850 nm). The percentage of transmittance for PLA/TiO2 nanocomposites has lower values than PLA, this is due to the particles which do not give transparency to the films. It is possible to note that the curves for PLA/TiO2 nanocomposites do not have a plateau as that shown by PLA, and also that the wavelength range where the transmittance is 0 increases with the amount of TiO2 (modified and unmodified).
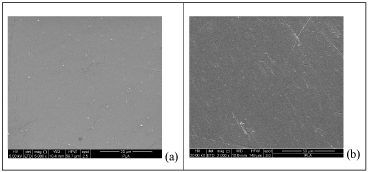
Figure 3. SEM micrographs of PLA by compression moulding (a) and PLA by calender (b) surface films
It has to be also noted that the transmittance values of the PLA/2% mTiO2 nanocomposite film are higher than those of the same sample composition but with the plain TiO2, whereas it is the opposite for the nanocomposite films with 5%TiO2. TiO2 nanoparticles, modified or not, extend the anti-UV area.
PLA/ZnO films, Figure 2, the transmittance is 0% from 200 to about 230 nm, then there is an increase of T (%) which is lowest for the composite with ZnO 5 wt%. Analyzing the spectra from 850 to 200 nm, it is observed for film with ZnO 1 wt% a constant decrease of transmittance in all the visible region followed by a small increase at about 385 nm and finally a sharp decrease at about 230 nm. The composite film with ZnO 3 wt% has qualitatively the same trend of the previous commented composite film, but with lower value of transmittance; finally, the composite film with 5 wt% of ZnO shows very low transmittance value in all the visible region, and it goes to zero in the range 230-200 nm. The lower values of transmittance shown by the ZnO composite films is due to the adsorption and reflection of the particles and agglomerates of the ZnO particles [27]. The reason why the UV-vis spectra of the films, with different percentages of ZnO, show an absorption in the region around 385 nm, is due to the intrinsic capacity of the ZnO particles to absorb the UV light [28-30]. The mechanism of protection from UV rays in the polymers by the particles ZnO is based, instead, on the absorption of UV radiation and on their re-emission in the visible region avoiding the generation of heat [31].
UV degradation
Figure 4 reports the PLA and PLA/TiO2 nanocomposites % weight loss as a function of the UV exposure time. It clearly shows that the weight loss is significantly faster in PLA respect to that of nanocomposites. PLA degradates in about 17 days. This means that TiO2 nanoparticles decrease the UV degradation of PLA. For the first 17 days of exposure, the weight losses in PLA/TiO2 nanocomposites vary linearly and do not seem to depend significantly on the amount of TiO2 nanoparticles (modified or not modified), as also reported in literature [21,32]. After this period, the values start differentiating significantly; after the 40th day of exposure, the curves of the PLA/2% TiO2 and PLA/2% mTiO2 nanocomposite films show a strong increase of the degradation trend, and the % weight loss values are much higher than those of the nanocomposite with 5% TiO2. It has to be observed that during the whole period of exposure, the values of the % weight loss for the two nanocomposites with 2%wt TiO2 (modified or not) are almost the same, in fact the two curves in figure 3 are nearly superimposable; whereas in the case of the nanocomposites with 5% of TiO2, the curve of the composite with mTiO2 is always lower and the difference between the two values, at the same exposure time, increases with the time.

Figure 4. Weight loss/UV irradiation time dependence for PLA, PLA/2% TiO2, PLA/2% m TiO2, PLA/5% TiO2 and PLA/5% mTiO2 films
The PLA/ZnO composites have similar behavior as shown in Figure 5. The neat PLA degrades faster than PLA loaded with ZnO and the degradation is almost completed in 21 days. The weight loss as a function of time is lower increasing the amount of ZnO particles in the composites. For example after 14 days of UV exposure the PLA has a weight loss of about 80%, PLA/1% ZnO of about 36%, PLA/3% ZnO of about 23% and PLA/5% ZnO of about 12%.
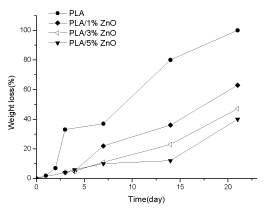
Figure 5. Weight loss/UV irradiation time dependence for PLA, PLA/1% ZnO, PLA/3% ZnO and PLA/5% ZnO
Comparing the systems is possible to observe that PLA/TiO2 films reach the 50% of degradation after 40 days of UV exposure and PLA/ZnO composites reach the same degradation after 21 days. This means that the UV degradation is faster for PLA/ZnO than PLA/TiO2. Moreover, the UV degradation process decreases with the amount of fillers. This results is different from some reported in literature: Buzarovska found that the UV degradation is faster in the composites than in PLA [21], whereas Nakayama et al. reported that the degrees weight loss in the PLA matrix was independent on the amount of functionalized TiO2 nanoparticles [32].
ATR Spectroscopy on films after UV degradation
PLA and PLA composite films were exposed to UV radiation to verify the effect of particles on PLA photodegradation. The UV irradiation produces the formation of degradation products, which lead to evolution of new peaks in the ATR spectra. Figure 6 shows the FTIR-ATR absorbance spectra, in the range 4000-400 cm-1 of UV irradiated calendered PLA films; figure 6 stands for also for the compression moulded PLA films because the compression moulded and calendered films, at 0, 3 and 14 days of UV degradation, show the identical spectra. The spectrum of PLA, at 0 day of UV exposure, shows a strong absorbance band at 1748 cm-1, attributed to the stretching vibrations of amorphous carbonyl groups [33]. The other observed bands, positioned at 1455 and 1380 cm-1, are due to the CH3 asymmetric and symmetric deformations. The strong absorption band located at 1186 cm-1 is due to C-O-C stretching mode. The UV degradation generates the formation of new bands; i) in the hydroxyl region a broad absorption band with a maximum at 3500 cm-1 that corresponds to products such as hydroperoxides or alcohols [34]; ii) a narrow absorption band with a maximum at 1843 cm-1, attributed to anhydride groups [26,34-36]; iii) absorption band with a maximum at 1617 cm-1, ascribed to the stretching of the C=O.
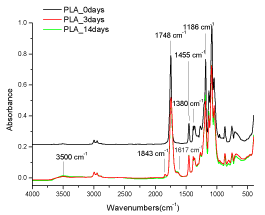
Figure 6. FTIR-ATR spectra of UV irradiated PLA films after 0, 3 and 14 days of UV degradation
Bocchini et al. [26] reported that photooxidation radical mechanism of PLA photooxidation usually begins by radical formed from impurities by UV-irradiation or thermal decomposition. The reaction, with higher probability, is the abstraction of tertiary hydrogen from PLA chain with the formation of a tertiary radical P•. This radical can react with oxygen to form a peroxide radical, which may easily abstract hydrogen from a tertiary carbon with the formation of an hydroperoxide and the initial radical P•. Then, the hydroperoxide undergo es photolysis with the formation of the HO• and a PO• radical that can further evolve by β-scission. Taking into account the stability of the different fragments the most probable β-scission appears to be the reaction leading to the formation of anhydride groups [24]. Figure 7 shows the FTIR-ATR absorbance spectra of UV irradiated PLA/5%TiO2 nanocomposite films after 0, 3, 14 and 30 days of UV degradation. The spectrum was obtained from 4000 to 400 cm-1, but it is shown here only the range 2000-1500 cm-1 where the effects of UV degradation are detectable. Figure 7 represents also the films with 2 wt% TiO2 and those with the modified TiO2 (both 2 and 5%), because the behaviour is found the same. The infrared analysis of PLA/TiO2 nanocomposite films photooxidation shows the presence of a band with a maximum at 1843 cm-1, attributed to the formation of anhydride groups [36]. It is also possible to note that the PLA/TiO2 nanocomposite films do not show other typical degradation peak of PLA, indicating that the TiO2 nanoparticles inhibit the formation of hydroperoxides or alcohols, carboxylic salt and primary amide group. It possible to conclude that the degradation products are independent of the nature TiO2 (modified or not) and independent of exposure time.
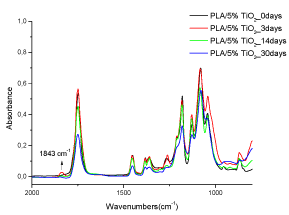
Figure 7. FTIR-ATR spectra of UV irradiated PLA/5% TiO2 nanocomposite films 0, 3, 14 and 30 days of UV degradation
Figures 8 shows the FTIR-ATR absorbance spectra, in the range 4000-1600 cm-1, of PLA/5% ZnO composite films exposed for 0, 3, 14 and 21 days at UV irradiation, as example it is reported only the spectra for PLA/5%ZnO because the behaviour given by the other compositions (1 and 3 wt%) is the same. The IR analysis of the PLA/ZnO composites during photo-oxidation presents the formation of the three absorption bands with maxima at 3500, 1845 and 1617 cm-1, observed also in the case of pristine PLA (Figure 6). However, one can observe a dramatic difference in terms of photoproduct concentrations because under identical exposure times the absorbance measured at 1617 cm-1 is considerably more intense for the PLA/ZnO composites than for the PLA. In particular, this band increases with the amount of ZnO content in the composites and with the UV exposure time. The increasing of that band could be attributed to the possible interaction between the ZnO particles and the active products of PLA photo-degradation.

Figure 8. FTIR-ATR spectra of UV irradiated PLA/5% ZnO composite films after 0, 3,14 and 21 days of UV degradation
Hydrolitic degradation
Figure 9 shows the weight loss of PLA and PLA/TiO2 nanocomposite films as a function of solution contact time. PLA/TiO2 nanocomposites films exhibited higher weight loss as a function of time than neat PLA. This result is in agreement with that reported in literature [21]. It can be observed that nanocomposite containing 5% of modified TiO2 nanoparticles degrade faster than all the nanocomposites and it is fully degraded already at 300 min; the two nanocomposites with 2 wt% of metal dioxide show almost similar behavior. It could be concluded that the hydrolytic degradation time of PLA nanocomposite films is controlled by TiO2 content [21].
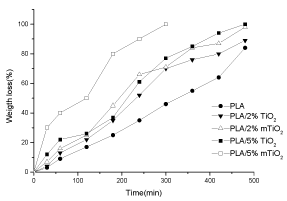
Figure 9. Weight loss (%)-time dependence (in 1 M NaOH) for PLA, PLA/2% TiO2, PLA/2% m TiO2, PLA5% TiO2 and PLA/5% m TiO2 nanocomposites
Figure 10 shows the weight loss of PLA and PLA/ZnO composites films as a function of exposed time in hydrolytic solution. The PLA produced by calendar (Figure 10) has different degradation respect the PLA produced by compression molding (Figure 9). This diversity is due to the different methods to prepare the two films and to their different thickness, lower for PLA produced by calender. In particular PLA produced by calender has hydrolytic degradation faster than PLA produced by compression molding. PLA hydrolytic degradation is slow respecting the PLA/ZnO composites. The hydrolytic degradation time of PLA composite films is widely controlled by ZnO content [37]. For all the composites, the degradation is very slow in the first 10 minutes, and then it starts increasing. For example, at 30 minutes, the weight loss for PLA is 12%, whereas it is: 38% for the PLA/1% ZnO, 36% for PLA/3% ZnO and 28% for PLA/5% ZnO (see along arrow P in Figure 10). This means that ZnO particles decrease the degradation time of PLA. It has to be observed also that the degradation time is inversely dependent on the composition; in fact the composite with 5 wt% ZnO undergoes a degradation of 60% at 40 min, whereas the composite with 1 wt% undergoes the same % degradation already at about 34 min (see along arrow L).
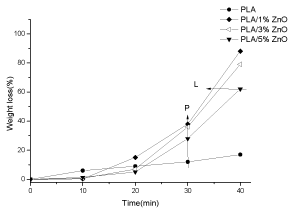
Figure 10. Weight loss (%)-time dependence (in 1 M NaOH) for PLA, PLA/1% ZnO, PLA/3% ZnO and PLA/5% ZnO composites
Enzymatic degradation
Figure 11 shows weight loss of PLA and PLA/TiO2 nanocomposites films after contact in proteinase K solutions at 37°C up to 12 hours. The weight losses in the first 4 h are similar for PLA and for PLA/TiO2 nanocomposites, then the samples start to differentiate their behavior: the weight loss is faster increasing the TiO2 amount in the composites and it results independent on the modification of the titanium oxide. Therefore, it can be concluded that a dominant factor, determining the PLA enzymatic degradation, is the filler content.
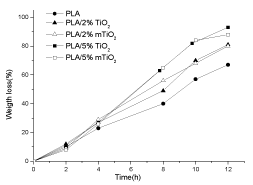
Figure 11. Weight loss of PLA, PLA/2% TiO2 , PLA/2% m TiO2, PLA5% TiO2 and PLA/5% m TiO2 nanocomposite films during the enzymatic degradation at 37°C
Figure 12 shows weight loss after contact of PLA and PLA/ZnO composites films in proteinase K solutions at 37°C. PLA is completely d egraded after 12 hours. The three PLA/ZnO composites show the same trend similar to that of PLA, although the PLA/1% ZnO presents weight loss values slightly lower.
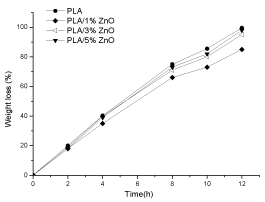
Figure 12. Weight loss of PLA, PLA/1% ZnO , PLA/3% ZnO and PLA5% ZnO composite films during the enzymatic degradation at 37°C
Isothermal degradation
Figures 13 shows the TGA measurements performed under isothermal conditions, up to 40 minutes, at 240°C for PLA and PLA/TiO2 nanocomposites.
After the isothermal treatment, the weight loss for PLA and the two nanocomposites with 5%TiO2 is about 1.5%, whereas it is about 3.5% for the nanocomposites with 2% TiO2, independently of modification.
Figure 14 shows the TGA measurements performed under isothermal conditions at 240°C, for PLA and its composites with ZnO. The weight loss for the PLA and PLA/ZnO composites up to about 15 min is not found. At higher time, the degradation induces the weight loss which results to be function of ZnO content; in at 40 minutes the weight loss is: 2% for neat PLA, 80% for PLA/1% ZnO, 93% for PLA/3% ZnO and 94% for PLA/5% ZnO. It is clear the influence of ZnO particles on the degradation of PLA, in according with literature [38].
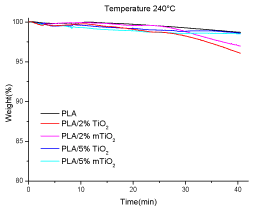
Figure 13. TGA under isothermal conditions (under air) of PLA, PLA/2% TiO2, PLA/2% m TiO2, PLA5% TiO2 and PLA/5% m TiO2 nanocomposite films at 240°C
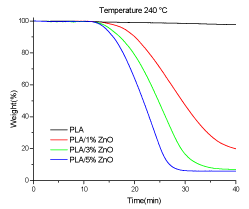
Figure 14. TGA under isothermal conditions (under air) of PLA, PLA/1% ZnO, PLA/3% ZnO and PLA/5% ZnO composite films at 240°C
Conclusions
It is possible to conclude that the degradation study has shown that the PLA/ TiO2 nanocomposite and PLA/ZnO composite films degrade in different times respect to neat PLA films as a function of kind of particles, composition and degradation media, in particular:
-The UV degradation is faster for PLA than PLA/ZnO than PLA/TiO2.
-ZnO particles decrease the time of hydrolytic degradation of PLA composites whereas TiO2 nanoparticles increase significantly that time.
-The enzymatic degradation is faster for PLA/TiO2 nanocomposites respect neat PLA, whereas for PLA/ZnO is slower. In all the system, the weight loss is function of the filler amount.
-This study underlines that the presence of ZnO is able to speed up the isothermal degradation of PLA in a way that is function of the ZnO amount and of the temperature, whereas TiO2 particles do not result to influence significantly the degradation of PLA, at least up to the limit of time (40 min) investigated.
Acknowledgements
The research described herein was partially supported by COST Action FA0904 ‘Eco-sustainable food packaging based on polymer nanomaterials’ and partially by the European Community’s Seventh Framework Programme (ERA-Net Susfood−CEREAL “Improved and resource efficiency throughout the post-harvest chain of fresh-cut fruits and vegetable”).
References
- Singh B, Sharma N (2008) Mechanistic implications of plastic degradation. Polym Degrad Stab 93: 561-584.
- Touati N, Kaci M, Bruzaud S, Grohens Y (2011) The effects of reprocessing cycles on the structure and properties of isotactic polypropylene/cloisite 15A nanocomposites. Polym Degrad Stab 96: 1064-1073.
- Tsuji H, Tsuruno T (2010) Accelerated hydrolytic degradation of Poly(l-lactide)/Poly(dlactide) stereocomplex up to late stage. Polym Degrad Stab 95: 477-484.
- Benali S, Aouadi S, Dechief AL, Murariu M, Dubois P (2015) Key factors for tuning hydrolytic degradation of polylactide/zinc oxide nanocomposites. Nanocomposites 1: 51-61.
- Alexandre M, Dubois P (2000) Polymer-layered silicate nanocomposites: preparation, properties and uses of a new class of materials. Mater Sci Eng 28: 1-63.
- Arias V, Höglund A, Odelius K, Albertsson AC (2013) Tuning the Degradation Profiles of Poly(l-lactide)-Based Materials through Miscibility. Biomacromolecules 15: 391-402.
- Sinha Ray S, Yamada K, Okamoto M, Fujimoto Y, Ogami A, Ueda K (2003) New polylactide/layered silicate nanocomposites. 5. Designing of materials with desired properties. Polymer 44: 6633-6646.
- Kontou E, Georgiopoulos P, Niaounakis M (2012) The role of nanofillers on the degradation behavior of polylactic acid. Polym Compos 33: 282-294.
- Williams DF (1981) Enzymatic hydrolysis of polylactic acid. Eng Med 10: 5-7.
- Oda Y, Yonetsu A, Urakami T, Tonomura K (2000) Degradation of polylactide by commercial proteases. J Polym Environ 8: 29-32.
- Lim HA, Raku T, Tokiwa Y (2005) Hydrolysis of polyesters by serine proteases. Biotechnol Lett 27: 459-464. [Crossref]
- Masaki K, Kamini NR, Ikeda H, Iefuji H (2005) Cutinase-like enzyme from the yeast Cryptococcus sp. strain S-2 hydrolyses polylactic acid and other biodegradable plastics. Appl Environ Microbiol 71: 7548-50.
- Fukuzaki H, Yoshida M, Asano M, Kumakura M (1989) Synthesis of copoly(D,LLactic acid) with relatively low molecular weight and in vitro degradation. Eur Polym J 25:1019-1026.
- Pranamuda H, Tsuchii A, Tokiwa Y (2001) Poly(L-lactide)-degrading enzyme produced by Amycolatopsis sp. Macromol Biosci 1: 25-29.
- Tokiwa Y, Calabia BP (2006) Biodegradability and biodegradation of poly(lactide). Appl Microbiol Biotechnol 72: 244-251. [Crossref]
- Suyama T, Tokiwa Y, Ouichanpagdee P, Kanagawa T, Kamagata Y (1998) Phylogenetic affiliation of soil bacteria that degrade aliphatic polyesters available commercially as biodegradable plastics. Appl Environ Microbiol 64: 5008-5011.
- Torres A, Li SM, Roussos S, Vert M (1996) Screening of microorganisms for biodegradation of poly(lactic-acid) and lactic acid-containing polymers. Appl Environ Microbiol 62: 2393-2397. [Crossref]
- Yang K, Wang X, Wang Y (2007) Progress in Nanocomposite of Biodegradable Polymer. J Ind Eng Chem 13: 485-500.
- Marra A, Silvestre C, Kujundziski AP, Chamovska D, Duraccio D (2016) Preparation and characterization of nanocomposites based on PLA and TiO2 nanoparticles functionalized with fluorocarbons. Polym Bull.
- Marra A, Silvestre C, Duraccio D, Cimmino S (2016) Polylactic acid/zinc oxide biocomposite films for food packaging application. Int J Biol Macromol 88: 254-262. [Crossref]
- Buzarovska A, Grozdanov A (2012) Biodegradable poly(L-lactic acid)/TiO2 nanocomposites: Thermal properties and degradation. J App Polym Sci 123: 2187-2193
- Reuge N, Caussat B, Joffin N, Dexpert-Ghys J, Verelst M, et al. (2008) Modelling of Spray Pyrolysis-Why the Synthesized Y2O3 Microparticles hollow?. AlChE J 54: 394-405.
- Rossignol C, Verelst M, Dexpert-Ghys J, Rul S (2006) Synthesis of Undoped ZnO nanoparticles by spray pyrolysis. Adv Sci Technol 45: 237-241.
- Wang S, Zhang Y, Ren W, Zhang Y, Lin H (2005) Morphology, mechanical and optical properties of transparent BR/clay nanocomposites. Polym Test 24: 766-774.
- Cele HM, Ojijo V, Chen H, Kumar S, Land K, et al. (2014) Effect of nanoclay on optical properties of PLA/clay composite films. Polym Test 36: 24-31.
- Bocchini S, Fukushima K, Blasio AD, Fina A, Frache A, et al. (2010) Polylactic acid and polylactic acid-based nanocomposite photooxidation. Biomacromolecules 11: 2919-2926. [Crossref]
- Berber M, Bulto V, Kliß R, Hahn H (2005) Transparent nanocrystalline ZnO films prepared by spin coating. Scr Mater 53: 547-551.
- Hui Lin O, Md Akil H, Mahmud S (2009) Effect of particle morphology on the properties of polypropylene/nanometric zinc oxide (PP/nanoZnO). Adv compos Lett 18: 77-83.
- Brown HHE (1976) Zinc Oxide Properties and Application, International Zinc and Lead Organization Inc., New York, USA, pp: 76-80
- Ammala A, Hill AJ, Meakin P, Pas SJ, Turney TW (2002) Degradation studies of polyolefins incorporating transparent nanoparticulate zinc oxide UV stabilizers. J Nanopart Research 4: 167-174.
- Chandramouleeswaran S, Mhaske ST, Kathe AA, Varadarajan PV, Prasad V, et al. (2007) Functional behaviour of polypropylene/ZnO-soluble starch nanocomposites. Nanotechnol 18: 1-8.
- Nakayama N, Hayashi T (2007) Preparation and characterization of poly(L-lactic acid)/TiO2 nanoparticle nanocomposite films with high transparency and efficient photodegradability. Polym Degr Stab 92: 1255-1264.
- Furukawa T, Sato H, Murakami R, Zhang J, Noda I, et al. (2007) Comparison of miscibility and structure of poly (3-hydroxybutyrate-co-3- hydroxyhexanoate)/poly (l-lactic acid) blends with those of poly (3-hydroxybutyrate)/poly (l-lactic acid) blends studied by wide angle X-ray diffraction, differential scanning calorimetry, and FTIR microspectroscopy. Polymer 48: 749-1755.
- Therias S, Larché JF, Bussière PO, Gardette JL, Murariu M, et al. (2012) Photochemical behavior of polylactide/ZnO nanocomposite films. Biomacromolecules 13: 3283-3291. [Crossref]
- Gardette M, Therias S, Gardette JL, Murariu M, Dubois Ph (2011) Photooxidation of polylactide/calcium sulphide composites. Polym Degrad Stab 96: 616-623.
- Mayo DW, In: Mayo DW, Miller FA, Hannah RW Editors (2003) Spectra of carbonyl compounds of all kinds (factors affecting carbonyl group frequencies). In: Course Notes on the Interpretation of Infrared and Raman Spectra. New York: John Wiley & Sons, Inc, pp: 179-204.
- Benali S, Aouadi S, Dechief AL, Murariu M, Dubois P (2015) Key factors for tuning hydrolytic degradation of polylactide/zinc oxide nanocomposites. Nanocomposites 1: 51-61.
- Murariu M, Doumbia A, Bonnaud L, Dechief AL, Paint Y, et al. (2011) High-Performance Polylactide/ZnO Nanocomposites Designed for Films and Fibers with Special End-Use Properties. Biomacromolecules 12: 1762-1771.
-


