Abstract
We studied patients with stable and typical angina pectoris (AP) without coronary artery disease. Patients had either a microvascular dysfunction (MVD) or a hypersensitive heart syndrome (HHS). The study was aimed to detect differences in the two conditions.
MVD and HHS patients show many important clinical differences. Female sex, fibromyalgia, gastroesophageal reflux symptoms are more frequent in HHS patients. The quality of life is significantly worse in HHS patients. Resting heart rate is higher in HHS than in MVD patients.
Cardiovascular risks factors are more frequent in MVD patients. Left ventricular diastolic dysfunction is frequent in MVD patients and rare in HHS. Left ventricular dyskinesia is only present in MVD patients.
In spite of a normal cardiac function without ischemia, HHS patients have more AP and dyspnea, and use more sublingual nitrates than MVD patients with MVD. Also, the time to occurrence of AP is shorter In HHS patients, but the ST-downsloping is absent or smaller. Thus, HSS have more symptoms than those with MVD. The higher heart rate in HHS patients might be due to an activated sympathetic system or reduced vagal activity.
The differences between MVD and HHS patients should allow a differential diagnosis between AP related to cardiac MVD and to the non-cardiac HHS.
Effects of antiischemic and antianginal effects of drugs depend on patients' selection. The data confirm the hypothesis that AP in HHS patients is part of a generalized pain syndrome and not a real cardiac pathology. Indeed, HHS patients have a multisystem pain with some preference for the chest pain. MVD patients have a real cardiac ischemia and can be properly treated with antianginal drugs. On the contrary, antianginal drugs are ineffective in HHS patients.
Key words
angina pectoris, chest pain, microcoronary dysfunction, hypersensitive heart syndrome
Introduction
Angina pectoris (AP), i.e., chest pain, is defined as typical when meets 3 or 4 of all of the following criteria: substernal chest discomfort of characteristic quality and duration; provoked by exertional or emotional stress; relieved by rest and/or by sublingual or spray nitrates within minutes. In the past it was assumed that AP is a usually a symptom of coronary artery disease (CAD) [1], but it is now established that AP is not always a symptom of CAD. Indeed, almost 50% of patients who undergo selective coronarography because of stable AP attributable to myocardial ischemia are found not to have a CAD [2].
In the large majority of patients with AP without CAD, myocardial ischemia and AP are induced by microvascular dysfunction (MVD) [3-7]. MVD derives from endothelium dependent, endothelium independent mechanisms, and the combination of the two [3-8]. Up to now 5 types of MVD have been recognized [3,4]. In a minority of patients AP without CAD myocardial ischemia and AP are due to an increased coronary constriction [3-8]. CAD, MVD and coronary spam are pathologies which explain ischemia and confirm the cardiac origin of chest pain.
However, we also know a syndrome called hypersensitive heart syndrome (HHS) [9,10]. These patients have typical AP without any organic cardiac or non-cardiac pathology which might explain the symptom. It is hypothesized that these patients have and enhanced pain perception. Indeed it could be demonstrated that these patients report AP after intracardiac injection of saline, contrast medium injection, catheter manipulation, and electrical cardiac stimulation, which usually do not cause pain in other subjects [9].
It may be easy to diagnose CAD. Diagnosing MVD may be more difficult, but is it possible [3-7]. When AP is considered cardiac therapies are aimed to reduce ischemia. However, it is unlikely that antianginal therapies are effective in patients with HHS. It would be important to distinguish patients with cardiac ischemia from those with HHS.
We studied 36 consecutive patients with MVD or HHS. We collected data on symptoms, concomitant diseases and cardiac function. The hypothesis was that the two groups can be distinguished and thus receive appropriated therapy.
Material and methods
This was a registry, i.e., a pragmatic trial [11] which is registered in ClinicalTrial.Org. Patients and their referring physicians gave their authorization to collect and analyze data. Data were available for treating physicians. Data collection did not interfere with diagnostic and therapeutic decisions.
Patients: Between January 1999 and January 2016 we checked 36 consecutive Caucasian patients with stable and typical AP. Patients with severe renal, hepatic or hematologic disorders were not selected. Occlusive CAD had been excluded in all by coronarography.
Twenty-four out of 36 (67%) patients had MVD. In 19 cases MVD was demonstrated by acetylcholine stress testing and in 3 cases by increased levels of endothelin-1. Twelve out of 36 patients (33%) had no cardiac or extracardiac explanation for AP and were considered to have HHS.
Concomitant diseases and medications were recorded and are shown in Table 2 and 3. All medications were left unchanged as prescribed from the referring physicians.
General data are shown in table 3. Patients who were not born in Switzerland were recorded as immigrants. Patients who never smoked or quitted smoking since 5 years were nonsmokers.
Quality of life was collected at baseline with the RAND 36-Item Health Survey questionnaire [12]. The questionnaire collects data on physical functioning, role functioning/physical, energy/fatigue, emotional well-being, social functioning, pain, general heath, and health changes. Data are shown in Table 4.
Table 1. Concomitant diseases.
Diseases |
MVD |
HHS |
p value |
Arterial hypertension |
16 yes, 8 no |
0 yes; 12 no |
< 0.0001 |
Diabetes mellitus |
12 yes; 12 no |
4 yes; 8 no |
< 0.001 |
Dyslipidemia |
8 yes, 8 no |
1 yes; 11 no |
< 0.0001 |
Gastroesophageal reflux disease |
6 yes; 18 no |
10 yes; 2 no |
< 0.0001 |
Hypothyroidism |
3 yes, 21 no |
1 yes; 11 no |
< 0.0001 |
Mood disorders |
6 yes; 18 no |
10 yes; 2 no |
< 0.0001 |
Fibromyalgia |
16 yes; 8 no |
10 yes; 2 no |
< 0.0001 |
Table 2: Medications.
Concomitant therapy |
MVD
no. of patients |
HHS
no. of patients |
ACE-inhibitors |
10 |
0 |
Amlodipine |
5 |
0 |
Angiotensin-2-blockers |
6 |
0 |
Aspirin 100 mg |
24 |
12 |
Citalopram or venlafaxine |
6 |
10 |
Exenatide, or liraglutide, or sitagliptin |
9 |
3 |
Ibuprofen, or paracetamol |
16 |
10 |
Levothyroxine |
3 |
1 |
Metformin |
10 |
4 |
Pantoprazol |
6 |
10 |
Statins |
8 |
1 |
Antianginal therapy |
|
|
Sublingual nitroglycerine on need |
24 |
12 |
Bisoprolol, or metoprolol, or nebivolol |
24 |
12 |
Ranolazine |
24 |
12 |
Table 3: General data.
|
MVD |
HHS |
p value |
Sex |
17 f, 7 m |
8 f , 4 m |
< 0.0001 |
Age, years (mean ± SD) |
67 ± 3.5 |
67 ± 2.4 |
ns |
Weight, kg (mean ± SD) |
71.0 ± 7.5 |
65.9 ± 7.2 |
ns |
Immigrants |
3 m, 2 f |
1 m, 7 f |
< 0.0001 |
Smoker |
9 yes; 15 no |
8 yes; 4 no |
< 0.0001 |
Legend
f |
Female |
m |
Male |
SD |
1 standard deviation |
p |
Non-significant |
ns |
P difference between MVD and HHS |
Table 4: Quality of life.
|
MVD Base |
MVD FU |
HHS Base |
HHS FU |
|
|
mean ± SD |
mean ± SD |
mean ± SD |
mean ± SD |
p1 |
p2 |
p3 |
Phys. Funct. |
61.0 ± 8.6 |
61.4 ± 6.5 |
41.1± 3,3 |
40.7 ± 3.8 |
p< 0.0001 |
ns |
ns |
Role Funct. |
47.3 ± 3.4 |
50.7 ± 4.2 |
38.3 ± 4.6 |
38.2 ± 4.7 |
p< 0.0001 |
ns |
ns |
Pain |
39.2 ± 4.9 |
39.6 ± 4.3 |
58.1 ± 7.4 |
58.7 ± 6.7 |
p< 0.0001 |
ns |
ns |
Legend
Phys. Funct. |
Physical functioning |
Role Funct. |
Role functioning/emotional |
p1 |
p value MVD versus HHS, at baseline |
p2 |
p value MVD, baseline versus follow-up |
p3 |
p value HHS, baseline versus follow-up |
ns |
Non-significant |
Cardiac data: at baseline and after 6 months we noted grade (CCS classification) and number of weekly AP episodes, number of weekly used sublingual nitrates, blood pressure, and heart rate. We also collected echocardiographic data: left atrial dimensions (LAd), left ventricular ejection fraction (LVEF), systolic time intervals (STIs; i.e., PEP/LVET ratio), dyskinesia (abnormal wall motion of at least 1 left ventricular segment), and left ventricular dysfunction (PW Doppler E/A ratio and tissue Doppler E/e1 ratio). Collected ergometric data were the time to the occurrence of AP and maximal ST-downsloping. All data are shown in Table 5.
Table 5: Cardiac parameters.
|
MVD Base |
MVD FU |
HHS Base |
HHS FU |
|
|
mean ± SD |
mean ± SD |
mean ± SD |
mean ± SD |
p1 |
p2 |
p3 |
AP (CCS grade) |
1.75 ± 0.4 |
1.7 ± 0.5 |
1.9 ± 0.7 |
2.1 ± 0.8 |
ns |
ns |
ns |
AP EPI |
1.4 ± 0.5 |
0-9 ± 0.7 |
2.0 ± 0.5 |
2.1 ± 0.5 |
< 0.5 |
< 0.5 |
< 0.5 |
NITRO |
1.4 ± 0.5 |
0.9 ± 2.3 |
2.0 ± 0.6 |
2.3 ± 0.5 |
< 0.004 |
< 0.5 |
< 0.5 |
Dyspnea |
1.8 ± 0.4 |
2.0 ± 0.0 |
1.5 ± 0.5 |
2.0 ± 0.0 |
< 0.0001 |
< 0.0001 |
ns |
SBP |
141.7 ± 3.3 |
140.2 ± 3.0 |
121.2 ± 5.4 |
141.7 ± 3.3 |
< 0.04 |
< 0.003 |
ns |
DBP |
80.4 ± 4.7 |
78.2 ± 4.2 |
67.8 ± 2.2 |
68.4 ± 3.0 |
< 0.0001 |
ns |
< 0.5 |
HR |
64.7 ± 4.7 |
65.0 ± 3.5 |
80.0 ± 3.0 |
64.7 ± 4.7 |
< 0.0001 |
ns |
< 0.5 |
LAd |
11.5 ± 1.1 |
9.5 ± 0.5 |
9.6 ± 0.7 |
9.5 ± 0.5 |
< 0.0001 |
< 0.0001 |
< 0.5 |
STIs |
0.33± 0.2 |
0.24 ± 0.1 |
0.24± 0.1 |
0.23 ± 0.1 |
< 0.0001 |
< 0.5 |
ns |
LVEF |
70.3 ± 4.9 |
70.1± 4.0 |
72.3 ± 3.8 |
71.3 ± 3.0 |
ns |
ns |
< 0.5 |
LV-DD E/A |
1.6 ± 0.5 |
1.9 ± 0.3 |
2.0 ± 0.0 |
2.0 ± 0.0 |
< 0.0001 |
< 0.0001 |
ns |
LV-DD E/e1 |
14.6 ± 2.0 |
11.7 ± 1.2 |
11.7 ± 1.25 |
13.6 ± 1.2 |
< 0.0001 |
< 0.5 |
< 0.5 |
LV-DYSK |
1.8 ± 0.4 |
1.9 ± 0.3 |
2.0 ± 0.0 |
2.0 ± 0.0 |
< 0.0001 |
< 0.0001 |
ns |
Ex Time to AP |
7.0 ± 0.5 |
6.3 ± 0.7 |
6.3 ± 0.7 |
6.3 ± 0.6 |
< 0.005 |
< 0.002 |
ns |
Max ST-DOWN |
1.0± 0.3 |
1.0 ± 0.2 |
0.2 ± 0.1 |
0.3 ± 0.1 |
< 0.0001 |
ns |
< 0.002 |
Legend
Base |
Baseline |
FU |
Follow-up |
AP EPI |
Weekly number of AP episodes |
NITRO |
Weekly number of used sublingual nitroglycerine |
Dyspnea |
NYHA grade of dyspnea |
DBP |
Diastolic blood pressure, mm Hg. |
SBP |
Systolic blood pressure, mm Hg. |
HR |
Heart rate, beats/minute. |
LAd |
Left atrial dimension, cm2. |
STIs |
Systolic time intervals, ratio. |
LVEF |
Left ventricular ejection fraction, %. |
LV-DD E/A |
Pulsed Doppler mitral valve, E/A wave ratio. |
LV-DD E/ e1 |
Tissue Doppler interventricular septum, E/ e1 wave ratio. |
LV-DYSK |
Left ventricular dyskinesia, number of segments. |
Ex-Time |
Exercise time to begin of AP, minutes. |
Max ST-DOWN |
Maximal ST-downsloping at exercise, mm. |
p1 |
p value MVS versus HHS, at baseline |
p2 |
p value MVD, baseline versus follow-up |
p3 |
p value HHS, baseline versus follow-up |
ns |
Non-significant |
Table 6: Differences between MVD and HHS patients.
MVD patients |
HHS patients |
Female sex is less frequent |
Female sex is more frequent. |
Immigrant status is less frequent |
Immigrant status is more frequent |
Smoking is less frequent |
Smoking is more frequent |
Cardiovascular risks are more frequent |
Cardiovascular risks are less frequent |
Quality of life is less reduced. |
Quality of life is more reduced. |
Hypertension is more frequent |
Hypertension is less frequent |
Heart rate is lower |
Heart rate is higher |
AP and nitroglycerin consumption are lower |
AP and nitroglycerin consumption are higher |
Cardiac dysfuntion is frequent. |
Cardiac dysfunction is rarer. |
Ergometric time to AP is longer |
Ergometric time to AP is shorter |
Ergometric ST-downsloping is greater |
Ergometric ST-downsloping is smaller |
Statistical analysis was performed with Statgraphics software using an intention-to-treat method. Data are expressed as mean ± 1 standard deviation (SD). The within-group difference between MVD and HHS patients was compared. Absolute values and percentual changes in relation to baseline measurements were analyzed. The 2 hypotheses tested were: null hypothesis: mu1-mu2=0.0, and alternative hypothesis: mu1-mu2>>0.0. Within-groups comparisons were made using paired t tests or the non-parametric Wilcoxon signed-rank test, where appropriate. Between-group comparisons were performed by unpaired t tests or the non-parametric Mann-Whitney U test, respectively. Chi-square test or Kruskal-Wallis test were used to compare continuous normally or not normally distributed and qualitative variables, where appropriate. Multivariate analysis of variance was performed. A p value of <0.05 was considered statistically significant.
Results
At follow-up data were available for all patients.
Clinical data: the two groups were similar for age and weight. Female sex, immigrant status and smoking status were significantly less frequent in MVD patients. Data and p values are shown in table 1.
Concomitant diseases were significantly different in the two groups. Arterial hypertension, diabetes mellitus, dyslipidemia and hypothyroidism were significantly more frequent in MVD patients. On the other hand, gastroesophageal reflux disease, mood disorders and fibromyalgia were significantly more frequent in HHS patients. Data and p values are shown in Table 1.
Concomitant medications: The number of treated patients was different in the two groups, but the types of drugs were similar. Cardiac medications were similar in both groups. Used drugs are shown in Table 2.
Quality of life: quality of life was significantly worse in HHS patients. Data and p values are shown in Table 4.
Cardiac data
• At baseline the grade of AP was similar in both groups. At follow-up the grade of AP decreased significantly in MVD but did not change in HHS. Altogether the grade of AP was statistically lower in patients with MVD. Data and p values are shown in Table 5.
• At baseline the number of weekly episodes of AP was significantly greater in MVD. At follow-up the number of AP episodes decreased significantly in MVD and increased significantly in HHS. Altogether the number of AP episodes was statistically smaller in patients with MVD. Data and p values are shown in Table 5.
• At baseline the number of weekly used sublingual nitrates was significantly greater in HHS. At follow-up nitrates consumption decreased significantly in MVD while it increased in HHS. Altogether nitrates consumption was statistically smaller in patients with MVD. Data and p values are shown in Table 5.
• At baseline the grade of dyspnea was statistical smaller in patients with MVD. At follow-up dyspnea decreased significantly in MVD and increased in HHS. Altogether dyspnea was statistically less severe in patients with MVD. Data and p values are shown in Table 5.
• At baseline blood pressure was significant lower in HHS. At follow-up blood pressure was almost unchanged almost in the two groups. Altogether, blood pressure was significantly lower in HHS. Data and p values are shown in Table 5.
• At baseline heart rate was significantly lower in MVD. At follow-up heart rate decreased significantly in both groups, but the changes were clinically irrelevant. Altogether, heart rate was significantly lower in patients with MVD. Data and p values are shown in Table 5.
Echocardiographic data
• At baseline STIs were normal in both groups but significantly lower in MVD. At follow-up the STIs decreased significantly in both groups, and the difference between groups was statistically significant. However, since the STIs were and remained normal, the statistically significant changes have little clinical relevance. Data and p values are shown in Table 5.
• At baseline LVEF was normal and similar in the two groups. At follow-up LVEF increased significantly in both groups and the difference between the two groups was statistically significant. However, since LVEF remained normal, the statistically significant changes lack clinical relevance. Data and p values are shown in Table 5.
• At baseline LAd were significantly lower in MVD. At follow-up LAd decreased significantly in both groups and the difference between the two groups was statistically significant. However, LAd were always normal and thus the statistically significant changes lack clinical relevance. Data and p values are shown in Table 5.
• At baseline left ventricular dyskinesia was detected in 21% (5/24) of patients with MVD and in none of the HHS patients. The difference between the two groups was statistically significant. At follow-up dyskinesia decreased and was detectable in only 8% (2/24) of MVD patients, the change being statistically significant. At follow-up as at baseline, none of the HHS patients had dyskinesia. Altogether left ventricular dyskinesia was only present in some MVD patients and absent in HHS patients. Data and p values are shown in Table 5.
• At baseline left ventricular diastolic dysfunction at baseline was significantly more frequent in MVD patients. At follow-up dyskinesia remained unchanged in MVD patients and increased in HHS patients, the difference between the two groups being significant. Data and p values are shown in Table 5.
Ergometry
• At baseline exercise time to the occurrence of AP episodes was significantly greater in MVD patients. At follow-up the exercise time increased significantly in both groups, but the difference between the two groups was statistically significant. Data and p values are shown in Table 3. Exercise time is also shown in Figure 1.

Figure 1. Cycloergometry: minutes to the occurrence of AP
Legend
MVD Base |
MVD. Minutes to AP at baseline. |
MVD FU |
MVD. Minutes to AP at follow-up. |
HHS Base |
HHS. Minutes to AP at baseline. |
HHS FU |
HHS. Minutes to AP at follow-up. |
• At baseline maximal stress-induced ST-downsloping was significantly greater in the MVD patients, the difference being statistically significant. In 42% (5/12) of HHS patients AP occurred without a significant ST-downsloping. At follow-up ST-downsloping decreased significantly in the MVD patients and remained unchanged in the HHS patients. The difference between the two groups was statistically significant. Data and p values are shown in Table 3. ST-downsloping is also shown in Figure 2.
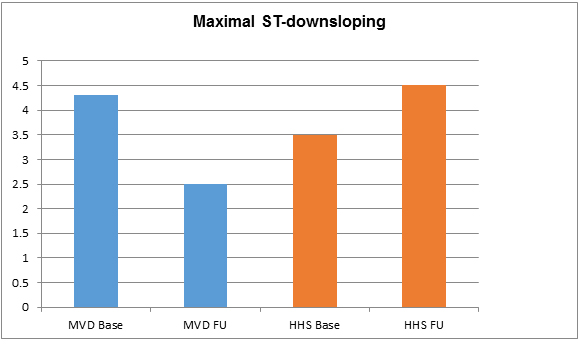
Figure 2. Cycloergometry: maximal ST-downsloping (mV).
Legend
MVD Base |
MVD. ST-downsloping at baseline. |
MVD FU |
MVD. ST-downsloping at follow-up. |
2021 Copyright OAT. All rights reserv
HHS Base |
HHS. ST-downsloping at baseline. |
HHS FU |
HHS. ST-downsloping at follow-up. |
Discussion
There are no absolutes and AP is indistinguishable in MVD and HHS patients.
However, MVD and HHS patients show many important clinical differences. Female sex, fibromyalgia, gastroesophageal reflux symptoms are more frequent in HHS patients. The quality of life is significantly worse in HHS patients. Resting heart rate is higher (80 beats/min) in HHS than in MVD patients (65 beats/min).
According to the characteristics of MVD cardiovascular risks factors (diabetes mellitus, dyslipidemia, hypertension, smoking status, and hypothyroidism) are more frequent in MVD patients. Left ventricular diastolic dysfunction is frequent in MVD patients and rare in HHS. Left ventricular dyskinesia is only present in MVD patients.
In spite of a normal cardiac function without ischemia, HHS patients have more AP and dyspnea, and use more sublingual nitrates than MVD patients with MVD. Also, the time to occurrence of AP is shorter In HHS patients, but the ST-downsloping is absent or smaller. Thus, HSS have more symptoms than those with MVD. The higher heart rate in HHS patients might be due to an activated sympathetic system or reduced vagal activity.
Our data are summarized in table 6. The differences between MVD and HHS patients should allow a differential diagnosis between AP related to cardiac MVD and to the non-cardiac HHS.
Effects of antiischemic and antianginal effects of drugs depend on patients' selection. E.g., ranolazine has been proven to exert a good antiischemic efficacy when given to patients with real myocardial ischemia [13-15]. On the other hand, the effect of ranolazine was less clear in patients with a different etiology of AP [16]. Consequently, in an editorial, Crea and Lanza [17] have strengthened the need for precision medicine, especially in patients with AP without CAD. Indeed, contrary to epicardial CAD, the etiology of MVD is complex and the coronary microcirculation as yet is elusive to conventional imaging techniques.
Altogether, the data confirm the hypothesis that AP in HHS patients is part of a generalized pain syndrome and not a real cardiac pathology. Indeed, HHS patients have a multisystem pain with some preference for the chest pain. Typically, these patients complain of more pain than patients with organic diseases and also consume more analgesic drugs. By mixing HHS with MVD patients, the effects of an antianginal and antiischemic therapy are flawed. One might wrongly conclude that the given therapy is poorly effective in patients with ischemia due to MVD.
Our study has some weaknesses. Most important, this is a single center study with a small number of patients. Also, we analyzed many data, with a risk for a statistical type I error. However, our data are in line with the rational expectations: patients with HHS have a normal cardiac function, but have more symptoms than those with MVD. It would be strange if the p values would have been be generated by chance.
Acknowledgment
The authors thank Mrs J. Bugmann for the technical assistance and writing of the manuscript.
References
- Kannel WB, Feinleib M (1972) Natural history of angina pectoris in the Framingham study. Prognosis and survival. Am J Cardiol 29: 154-163. [Crossref]
- Patel MR, Peterson ED, Dai D, Brennan JM, Redberg RF, et al. (2010) Low diagnostic yield of elective coronary angiography. N Engl J Med 362: 886-895. [Crossref]
- Lanza GA, Crea F (2010) Primary coronary microvascular dysfunction: clinical presentation, pathophysiology, and management. Circulation 121: 2317-2325.
- Herrmann J, Kaski JC, Lerman A (2012) Coronary microvascular dysfunction in the clinical setting: from mystery to reality. Eur Heart J 33: 2771-2782b. [Crossref]
- Sestito A, Lanza GA, Di Monaco A, Lamendola P, Careri G, et al. (2011) Relation between cardiovascular risk factors and coronary microvascular dysfunction in cardiac syndrome X. J Cardiovasc Med (Hagerstown) 12: 322-327. [Crossref]
- Cocco G, Jerie P (2015) Angina pectoris in patients without flow-limiting coronary artery disease (cardiac syndrome X). A forest of a variety of trees. Cardiol J 22: 605-612. [Crossref]
- Ong P, Athanasiadis A, Borgulya G, Vokshi I, Bastianen R et al. (2014) Clinical usefulness, angiographic characteristics, and safety evaluation of intracoronary acetylcholine provocation among 921 consecutive white patients with unobstructed coronary arteries. Circulation129: 1723-1730.
- Cocco G, Jerie P (2015) Angina pectoris in patients without flow-limiting coronary artery disease (cardiac syndrome X). A forest of a variety of trees. Cardiol J 22: 605-612. [Crossref]
- Benjamin SB (1992) Microvascular angina and the sensitive heart: historical perspective. Am J Med 92: 52S-55S. [Crossref]
- Pasceri V, Lanza GA, Buffon A, Montenero AS, Crea F, et al. (1998) Role of abnormal pain sensitivity and behavioral factors in determining chest pain in syndrome X. J Am Coll Cardiol 31: 62-66. [Crossref]
- Ford I, Norrie J1 (2016) Pragmatic Trials. N Engl J Med 375: 454-463. [Crossref]
- Ware JE, Sherbourne CD(1992) The MOS 36-Item Short-Form Health Survey (SF-36): I. Conceptual Framework and Item Selection Medical Care 30: 473-483.
- Rousseau MF, Pouleur H, Cocco G, Wolff AA (2005) Comparative efficacy of ranolazine versus atenolol for chronic angina pectoris. Am J Cardiol 95: 311-316. [Crossref]
- Cocco G (2013) Indicated and off-label use of ranolazine. E-journal of Cardiology 18.
- Cocco G (2012) Management of myocardial ischemia. Is ranolazine needed? For all or some patients with myocardial ischemia? Expert Opin Pharmacother 13: 2429-2432. [Crossref]
- Bairey Mer CN, Handberg EM, Shufelt CL, Metha PK, Minissan MB et al. (2016) A randomized, placebo-controlled trial of late Na current inhibition (ranolazine) in coronary microvascular dysfunction (CMD): impact on angina and myocardial perfusion reserve. Eur Heart J 37: 1504–1513.
- Crea F, Lanza GA (2016) Treatment of microvascular angina: the need for precision medicine. Eur Heart J 37: 1514-1516. [Crossref]