Abstract
Dietary intake of 117 male adolescents (aged 12 to 18 years, residing in Istanbul, Turkey) with autism spectrum disorder (ASD) and classified as normal (n=39), overweight (n=39) and obese (n=39) according to BMI-for-age were assessed. Anthropometric measurements were taken and participants were asked to complete a general questionnaire, feeding assessment survey and three-day food records. Daily intakes of energy and nutrients were calculated using food records. The EAR-cut point method was used to investigate the prevalence of inadequacy and potential risk of excess. Dietary fibre, calcium, zinc and folate intake of many participants were below the DRI value. Prevalence of inadequacy for iron, vitamin A, B6 and C were lower than these nutrients. Daily consumption of sodium and cholesterol was higher than the recommendations. Percent DRI value for energy differed significantly in each BMI-for-age group (p<0.05) and was highest in the obese category. This category also had higher %DRI values for most vitamins and minerals. Percent energy values provided by macronutrients (AMDR) were not significantly different from each other across BMI-for-age categories and remained within the reference values.
Key words
Autism spectrum disorder (ASD), BMI-for-age, nutrient intake, adolescents, Turkey
Introduction
ASD is a range of complex neurodevelopment disorders, characterised by persistent deficits in social communication and interaction, inadequacy of nonverbal communicative behaviours and deficits in developing, maintaining and understanding relationships. These symptoms can be accompanied by restricted, repetitive patterns of behaviour, interests or activities [1]. Along with these core features, there may be a host of additional associated impairments including inattention, impulsivity, challenging behaviours, feeding and sleep problems [2-11].
ASDs can occur in all racial, ethnic and socioeconomic groups and they are almost five times more common among boys than girls. Autism and Developmental Disabilities Monitoring (ADDM) Network estimates the prevalence of ASD as 1 in 68 [12]. An accurate prevalence data is not available and for this reason global prevalence figures are usually used for Turkey.
Most of the current research proposes children with ASD may be at great risk or even greater risk for overweight and obesity in comparison to their typically developing (TD) peers [13-20]. The existing literature suggests that obesity is at least as high or higher in children with ASD than in TD ones [20-22]. Inadequate or excess intake of macro and micronutrients (such as calcium, dietary fibre, vitamin A, C and folate) have been reported in many studies [23-27].
School age children and adolescents in Turkey encounter two nutritional problems that are on each end of the nutritional spectrum: Obesity versus underweight and micronutrient deficiencies accompanying both of them [28,29]. Indeed, our previous study with 164 Turkish individuals (male and female, aged 4-18 years) with ASD revealed that 58.5% of the participants were overweight and obese and 11.0% of them were severely thin and thin (according to classification by BMI-for-age standards by the World Health Organization). The same study also found that the majority of the individuals had inadequate intakes of calcium, zinc, vitamin B6 and folate [20].
To our knowledge, this is the second study on the dietary of the Turkish adolescents with ASD. Many of other studies looked into social, psychological, behavioural and biochemical aspects of ASD in Turkish children [30-34]. Since ASD is more common in males than females, this study attempted investigating the dietary intake of Turkish male adolescents aged 12-18 years and having a normal to high body mass index (BMI) for-age. The study also aimed to reveal any possible differences in the intake levels of energy and nutrients among the adolescents that are categorised as normal, overweight and obese according to their BMI-for-age values.
Methods
Participants
A subject group of 117male individuals (39 normal, 39 overweight and 39 obese as classified by BMI-for-age) with ASD and aged between 12 to 18 years was used. These individuals were randomly recruited from different autism rehabilitation centres in Istanbul (the most populous city in Turkey with significant financial and cultural importance) between December 2013 and March 2014. They were previously diagnosed with ASD by a paediatrician, child neurologist or a child psychiatrist using the Diagnostic and Statistical Manual of the American Psychiatric Association (DSM-IV).
Permission to conduct the study was granted by the Ethical Committee of the National Education Directorate of Istanbul. All parents and caregivers (i.e. either unpaid or paid individuals providing care in one’s home or in a care setting) who volunteered to take part in the study gave written informed consent.
Data Collection
All participants (n=117) were weighed and measured in light clothing without shoes using a portable scale (accuracy 50 g; Seca874, Seca Ltd., Birmingham) and mobile stadiometer (accuracy 1 mm; Seca 217, Seca Ltd., Birmingham). The BMI-for-age values were calculated using AnthroPlus Software version 1.0.4 and the participants were classified as normal, overweight and obese.There were 39 children in each BMI-for-age category.
Participants or their parents/caregivers were asked to complete two different questionnaires: (1) General questionnaire (2) Feeding assessment survey (FAS). Participants or their parents/caregivers also filled in three-day-food records after receiving standardised training on completing them. The training was delivered by one of the authors, who is a dietician. The aim of the training was to enable the participants to provide accurate information on portion sizes, cooking techniques, meal times, brand names of food products and etc. A visual food portion size booklet, which was prepared by the dietician, was also given to each of the participants. Assistance in completing the food records and questionnaires was available at all times during the study.
Measures
A general questionnaire, feeding assessment survey (FAS) and 3-day food records were used. General questionnaire was prepared by the authors. Feeding assessment survey included questions selected from the “Feeding history questionnaire”, which was prepared by the Children’s Hospital of Philadelphia [35].
General questionnaire
General questionnaire included questions about the education level and occupation of the parents, number of individuals in the family and monthly income of the household.
Feeding assessment survey
Feeding assessment survey aimed to gather information on the foods that children opted for or avoided eating, children’s daily routine of feeding, drug usage and bowel movements. Some items in the “Feeding history questionnaire” were taken from the Children’s Hospital of Philadelphia. Permission to use these items was granted by the Manager of the Paediatric Feeding and Swallowing Centre of the hospital.
Three-day- food records
Food records were filled in for two weekdays and one weekend day by the parents/caregivers or individuals. Participants were assisted in recording the foods consumed out of home. A nutrition software program (Ebispro for Windows, Turkish Version (BeBiS 7), Pasifik Company) that contains information on 20,000 foods and beverages was used to calculate the mean daily intakes of energy and nutrients (protein, fat, carbohydrate, fibre, cholesterol, sodium, calcium, zinc, iron, vitamin A, vitamin B6, vitamin C and folate).
Dietary assessment
For the analysis of dietary intake, the participants were divided into two age groups (12-13 years and 14-18 years) to correspond to the age groups used in Dietary Reference Intake (DRI) [36].
DRI are a set of four lists of values for measuring the nutrient intakes of healthy people. The four lists are Estimated Average Requirements (EAR), Recommended Dietary Allowances (RDA), Adequate Intakes (AI) and Tolerable Upper Intake Levels (UL). The EAR is the average amount of a nutrient that is likely to meet the daily needs of half of the individuals in a specific age and gender group. The RDA is the average daily nutrient intake level that meets the needs of nearly all (97 to 98 percent) healthy people in a particular life stage and gender group. The AI is the approximate amount of nutrient that groups of similar individuals need to consume to maintain good health. The UL is the highest amount of a nutrient that can be consumed daily without harm in a similar age and group of individuals [37].
The EAR cut-point method [38] was used to assess the prevalence of the inadequacy of nutrients (protein, carbohydrate, dietary fibre, cholesterol, calcium, zinc, iron, sodium, vitamins A, B6 and C and folate) . When an EAR value does not exist for a particular nutrient, AI value was used (e.g. dietary fibre). UL values were used to determine potential risk from chronic excessive nutrient intake.
In order to compare the daily intake of the individuals in different BMI-for-age categories, percent DRI values were calculated for each individual. Each intake value was divided by the relevant DRI value (RDA or AI) of the same age group (i.e. 12-13 years and 14-18 years); so comparison between the intakes of the individuals in different BMI-for-age categories was possible (without considering the differences in age groups).
In addition to the four DRI lists aforementioned, another nutrition tool called “Acceptable Micronutrient Distribution Range (AMDR)” was used. AMDR are values for healthy ranges of intake of carbohydrate, fat and protein expressed as percent of total daily calorie intake [37]. The percent energy provided by protein, fat and carbohydrate was calculated and compared with the AMDR values for children aged 4 to 18 [36].
Statistical analysis
Statistical analyses were conducted using the Statistical Package for Social Sciences, SPSS (Version 20) (SPSS Inc., Chicago, IL, USA), with statistical significance set at p<0.05.
For determining the significant differences in the %DRI value of energy and other nutrients except iron (protein, carbohydrate, dietary fibre, cholesterol, sodium, calcium, zinc, vitamins A, B6 and C and folate), non-parametric tests (Kruskal-Wallis test followed by Mann-Whitney U tests) were used. For multiple comparisons, the significance level was adjusted by dividing the p value (0.05) with the number of tests (i.e.3). Thus, the new p value for these tests was set as 0.017. Different from these nutrients, for iron, ANOVA test followed by Tamhane’s T2 test were used.
ANOVA tests were also used to assess the differences in AMDR values for protein, fat and carbohydrate for different age and BMI-for-age categories.
In order to assess the prevalence of inadequacy and the potential risk from chronic excessive nutrient intake, the distribution of usual intakes was examined after the adjustment of the data for day-to-day variation. This adjustment included the examination of the normality by the Shapiro-Wilk statistic and an ANOVA test to find out the within- and between-person variance [39]. Percentile values for the usual intake distributions of nutrients were calculated by using SPSS and then compared with the DRI values (such as EAR, AI and UL).
Results
General characteristics of the study group
Male individuals with ASD (n=117), aged 12 to 18 and classified as normal, overweight and obese according to their BMI-for-age were recruited. Each BMI-for-age group had 39 adolescents. The number of adolescents in different age groups varied between 8 and 27 (Figure1). Except adolescents aged 17 years, obese and overweight individuals constituted the majority of the other age categories.
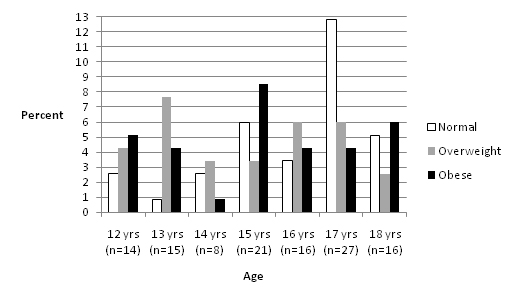
Figure 1. Percent distribution of BMI-for-age values (n=117)
Assessment of the adolescents’ daily nutrient intake
The percent of adolescents with intakes less than the AI for dietary fibre was 75-90% for the younger group (12 and 13 years) and 90-95% for the other group (14 to 18 years) (Table 1).
Table 1. Assessment of the children’s daily nutrient intake (n=117)
|
|
|
|
|
|
Percentile of usual intake distribution
|
|
|
Nutrient
|
EAR
|
UL
|
Mean
|
5th
|
10th
|
25th
|
50th
|
75th
|
90th
|
95th
|
99th
|
|
12-13 yrs (n=29)
|
Protein (g/kg)
|
0.76
|
n/a
|
1.36
|
0.82
|
0.92
|
1.10
|
1.43
|
1.60
|
1.73
|
1.92
|
2.10
|
|
Carbohydrate (g)
|
100
|
n/a
|
239
|
140
|
165
|
211
|
236
|
283
|
307
|
332
|
347
|
|
Fibre (g)
|
31*
|
n/a
|
21
|
11
|
12
|
15
|
22
|
26
|
34
|
36
|
37
|
|
Cholesterol (mg)
|
n/a
|
300ɫ
|
172
|
115
|
152
|
201
|
322
|
442
|
563
|
647
|
866
|
|
Calcium (mg)
|
1100
|
3000
|
822
|
359
|
537
|
571
|
812
|
1031
|
1274
|
1368
|
1399
|
|
Zinc (mg)
|
7.0
|
23.0
|
11.0
|
6.0
|
6.7
|
9.0
|
11.1
|
12.3
|
13.4
|
15.3
|
15.7
|
|
Iron (mg)
|
5
|
40
|
12
|
7.3
|
8.0
|
9.9
|
12.0
|
13.3
|
14.0
|
14.4
|
14.9
|
|
Sodium (mg)
|
n/a
|
2200ɫ
|
4340
|
2666
|
2956
|
3302
|
3963
|
5308
|
6140
|
6992
|
7198
|
|
Vitamin A (µg)
|
445**
|
1700***
|
1089
|
364
|
452
|
755
|
1060
|
1459
|
1820
|
1941
|
2106
|
|
Vitamin B6 (mg)
|
0.8
|
60.0
|
1.0
|
0.9
|
1.0
|
1.1
|
1.4
|
1.7
|
1.8
|
1.9
|
2.0
|
|
Vitamin C (mg)
|
39
|
1200
|
109
|
28
|
41
|
62
|
101
|
144
|
201
|
205
|
231
|
|
Folate (µg)
|
250
|
600
|
276
|
169
|
182
|
227
|
257
|
304
|
384
|
387
|
433
|
|
14-18 yrs (n=88)
|
Protein (g/kg)
|
0.73
|
n/a
|
1.10
|
0.64
|
0.75
|
0.90
|
1.07
|
1.26
|
1.56
|
1.65
|
2.08
|
|
Carbohydrate (g)
|
100
|
n/a
|
289
|
184
|
208
|
240
|
270
|
338
|
390
|
431
|
485
|
|
Fibre (g)
|
38*
|
n/a
|
24
|
12
|
14
|
19
|
23
|
28
|
32
|
41
|
49
|
|
Cholesterol (mg)
|
n/a
|
300ɫ
|
173
|
99
|
140
|
195
|
315
|
469
|
597
|
633
|
711
|
|
Calcium (mg)
|
1100
|
3000
|
894
|
411
|
533
|
693
|
827
|
1039
|
1288
|
1385
|
1867
|
|
Zinc (mg)
|
8.5
|
34.0
|
12.0
|
6.6
|
7.9
|
9.1
|
10.5
|
14.0
|
16.6
|
18.0
|
22.0
|
|
Iron (mg)
|
7.7
|
45
|
13
|
7.5
|
8.0
|
10.6
|
13.0
|
15.0
|
18.1
|
20.0
|
23.3
|
|
Sodium (mg)
|
n/a
|
2300ɫ
|
4717
|
2734
|
3084
|
3481
|
4228
|
5711
|
7074
|
7777
|
9202
|
|
Vitamin A (µg)
|
630**
|
2800***
|
1496
|
526
|
624
|
911
|
1269
|
1594
|
2117
|
2827
|
7111
|
|
Vitamin B6 (mg)
|
1.1
|
80
|
1.0
|
0.8
|
1.0
|
1.1
|
1.4
|
1.7
|
1.9
|
2.1
|
2.5
|
|
Vitamin C (mg)
|
63
|
1800
|
126
|
46
|
66
|
90
|
125
|
157
|
186
|
211
|
255
|
|
Folate (µg)
|
330
|
800
|
314
|
172
|
189
|
242
|
301
|
364
|
441
|
466
|
637
|
|
|
*AI value.
** As retinol activity equivalents (RAEs).
*** As preformed vitamin A only.
ɫ Generally recommended values not to be exceeded daily, please see relevant text.
EAR: Estimated Average Intake, AI: Adequate Intake, UL: Tolerable Upper Intake Level. EAR, UL and AI values taken from the Institute of Medicine (2010).
|
The prevalence of inadequacy for calcium was 75-90% in both age groups. Zinc was another micronutrient with insufficient intake level: the prevalence of inadequacy was 10-25% in both the younger and the other group. Among vitamins, folate had a high prevalence of inadequacy. The values ranged between 25-50% in the younger group and 50-75% in the older group. Inadequate iron intake levels were observed only in the older group at a rate of 5-10%. In the older group, 25% of the children had an inadequate intake of vitamin B6. Inadequacy of vitamin A and C were seen in the younger and older groups, with a prevalence rate of 5-10% in both.
Prevalence for potential risk of excess was alarmingly high for sodium in particular, followed by cholesterol. More than 95% of the children had daily sodium intake greater than the maximum values not to be exceeded daily. In both age groups, the prevalence for potential risk of excess varied between 50-75% for cholesterol.
Percent energy values provided by protein, fat and carbohydrate
When percent energy values provided by protein, fat and carbohydrate were evaluated across BMI-for-age and age groups separately, no differences were observed (p>0.05) (Table 2). In both groups, percent energy provided by protein and carbohydrate remained within the AMDR range (i.e. 10-30% for protein and 45-65% for carbohydrate, respectively). In the BMI-for-age group, percent fat value (ranging from 36.9 to 37.5%) was slightly above the upper value of the AMDR range (i.e. 25-35%). Similarly, when the AMDR values in each age group (i.e. 12 to 18 years) were investigated it could be seen that the percent of energy provided by fat (varying from 35.2 to 39.4%) was either equal to or slightly higher than the upper limit of the range.
Table 2. Percent contribution of protein, fat and carbohydrate to energy intake (AMDR)ɫa) According to BMI-for age category b) According to age
|
BMI-for-age*
|
%
Protein
|
%
Fat
|
%
Carbohydrate
|
|
Normal (n=39)
|
14.2 ± 3.2
|
37.1 ± 7.5
|
47.5 ± 7.7
|
|
Overweight (n=39)
|
13.9 ± 3.4
|
36.9 ± 6.6
|
47.7 ± 6.3
|
|
Obese (n=39)
|
13.9 ± 2.2
|
37.5 ± 5.4
|
46.9 ± 4.4
|
a)
|
Age*
|
%
Protein
|
%
Fat
|
% Carbohydrate
|
|
12 (n=14)
|
15.4 ± 3.1
|
38.2 ± 6.3
|
45.4 ± 6.9
|
|
13 (n=15)
|
13.7 ± 3.1
|
39.4 ± 6.3
|
45.1 ± 6.6
|
|
14 (n=8)
|
15.5 ± 2.3
|
34.8 ± 7.0
|
49.0 ± 5.6
|
|
15 (n=21)
|
13.6 ± 3.2
|
37.0 ± 5.3
|
47.6 ± 4.9
|
|
16 (n=16)
|
14.6 ± 2.8
|
36.0 ± 7.3
|
48.3 ± 6.5
|
|
17 (n=27)
|
13.5 ± 2.9
|
37.9 ± 7.0
|
47.1 ± 6.6
|
|
18 (n=16)
|
13.7 ± 2.6
|
35.2 ± 6.5
|
50.1 ± 6.0
|
|
ɫ Acceptable Macronutrient Distribution Ranges (AMDR) for protein, carbohydrate and fat are 10-30%, 25-35% and 45-65%, respectively [36].
* There was no statistical difference between groups (p>0.05).
|
Comparison of percent DRI for energy and nutrients between BMI-for-age categories
As a general trend, the percent DRI values for energy and nutrients increased as BMI-for-age values increased. However, the differences in percent DRI values for nutrients between normal, overweight and obese categories were not always statistically significant (Table 3). Only the percent DRI value of energy differed significantly in every BMI-for-age group (p<0.05). There were no differences in the percent DRI values for cholesterol, vitamin A and vitamin C across groups.
Table 3. Percent dietary reference intakes (DRI) for energyɫ and nutrientsɫɫ
|
|
BMI-for-age
|
|
|
Normal*
(n=39)
|
Overweight
(n=39)
|
Obese
(n=39)
|
|
Energy (kcal)
|
71.3 ± 10.5a
|
82.7 ± 14.2b
|
100.1 ± 23.4c
|
|
Protein (g)
|
144.7 ± 36.6a
|
176.7 ± 61.9a,b
|
205.8 ± 56.4b
|
|
Carbohydrate (g)
|
185 ± 43a
|
204.3 ± 39.1a
|
248.3 ± 68.5b
|
|
Fibre (g)
|
56.3 ± 16.8a
|
64.8 ± 23.3a,b
|
73.5 ± 26.2b
|
|
Cholesterol (mg)
|
160.6 ± 74.6a
|
168.7 ± 103.9a
|
187.6 ± 85.6a
|
|
Sodium (mg)
|
58.7 ± 17.1a
|
290.1 ± 86.5a
|
372.6 ± 140.2b
|
|
Calcium (mg)
|
58.7 ± 17.1a
|
61.7 ± 21.5a
|
81.7 ± 29b
|
|
Zinc (mg)
|
94.7 ± 25.9a
|
112.2 ± 32.9b
|
131.7 ± 38.4b
|
|
Iron (mg)
|
108.3 ± 28.7a
|
125.2 ± 29.6b
|
140.5 ± 39.1b
|
|
Vitamin A (µg)**
|
142 ± 68.4a
|
208 ± 224a
|
160.2 ± 65.7a
|
|
Vitamin B6 (mg)
|
100.5 ± 31.4a
|
130.6 ± 38.5b
|
131.1 ± 31.5b
|
|
Vitamin C (mg)
|
169.1 ± 74.8a
|
199.2 ± 119.3a
|
109.6 ± 82.4a
|
|
Folate (µg)
|
69.2 ± 17.7a
|
78.5 ± 23.6a
|
97.7 ± 27.3b
|
|
*Different superscripts in a row denote statistical significance (p<0.05).
** As retinol activity equivalents (RAEs).
ɫAdequate Intake (AI) for dietary fibre and Recommended Dietary Allowances (RDA) for other nutrients were used.
ɫɫDietary Reference Intake (DRI) values for Turkish children were used (i.e. 2445 kcal for children aged 10-13 and 2860 kcal for children aged 14-18) [76].
|
Adolescents in the obese category had percent DRI values for protein and fibre significantly higher than the children in the normal category. There were no differences between the normal and overweight and between the overweight and obese categories for these nutrients.
Both overweight and obese categories had significantly higher percent DRI values for zinc, iron and vitamin B6 when compared to the children with a normal BMI-for-age.
Percent DRI values of the remaining nutrients (carbohydrate, sodium, calcium and folate) in the obese category were higher than both normal and overweight categories (p<0.05). The % DRI values for these nutrients in the normal and overweight categories were similar to each other.
Discussion
A significant finding of the study was that for dietary fibre the intake levels of the majority of the adolescents (75-95%) were below the DRI value (AI). Among these adolescents 36% of them suffered from constipation and the remainder had normal bowel habits (data not shown). The AIs are set using different criteria than EAR and therefore they are of limited use in assessing the adequacy of groups [40]. Because the mean intakes for both age groups (i.e. 12-13 years and 14-18 years) were below the AI value in the study, the prevalence of inadequacy for dietary fibre could not be assumed. On the other hand, it can be clearly seen in Table 3 that the dietary fibre intake of adolescents only provided 56.3 to 73.5% of the AI value across all BMI-for-age categories. This was in line with the studies reporting low dietary intake of dietary fibre in healthy adolescents and university students in Turkey [41-44]. Studies carried out with children with ASD reported lower intake levels of dietary fibre [45,46]. However, our previous study with Turkish children and adolescents with ASD, which recruited 115 children (male and female) aged 4-18 years, did not reveal inadequate intake levels of this nutrient (20).
Inadequate intake levels of calcium in children and adolescents with ASD have been reported by many studies [17,23,25,45,47-49]. The current study produced similar results. Low calcium intake of children with ASD is usually ascribed to the limitation or elimination of dairy products from the individuals’ diet due to the popularity of gluten free and casein free (GFCF) diets, which are claimed to ameliorate the symptoms of this disorder. Although adopted by many families, systematic reviews of GFCF diets could not support the use of such diets in the treatment of ASD [50,51]. None of the participating adolescents in the current was on a GFCF diet. Calcium deficiency was reported with typically developing Turkish children [52,53] and adults [54]; as well as children and adolescents with ASD in our previous study [20]. Unlike European countries, milk does not constitute an essential part of the meals and the consumption of milk and milk products in Turkey is lower than developed countries [55]. This and the inclination to limit milk and dairy products in the diet could be given as reasons for calcium deficiency in Turkish adolescents with ASD.
Zinc was another mineral that some adolescents with ASD were not taking in sufficient amounts. The prevalence rate of inadequacy (10-25%) was similar to what was obtained in our previous study [20] with the same gender and age group (15.1-20.5%). As cereals and legumes are dominant sources for energy and protein in Turkey, zinc deficiency is common in healthy adults and children [56-58]. A study of Turkish children with ASD found that they had lower levels of zinc in plasma and red blood cells compared to neurotypical children (p<0.05) [31]. However, it must be noted that reasons other than nutritional intake levels, such as possibility of metabolic abnormality involving zinc [31] or lower absorption ability in the intestinal duct [59] could also give rise to zinc deficiency in children with ASD.
Unlike our previous study [20], this study revealed that 5-10% of individuals (aged 14-18) had inadequate levels of iron intake. A study carried out with American children found that 2% of the children (aged 2-12, n=368) had intakes less than the EAR value and the inadequacy of iron increased with age [60]. Another study reported a high prevalence of insufficient dietary iron intake in children with ASD (aged 2-12, n=33) and attributed this to their narrow food preferences [61]. Similarly, a substantial proportion of children (both TD and children with ASD) were reported to consume less than the DRI value for iron [45]. Iron intake does not necessarily correlate to iron status of the individuals, as the absorption rate of iron in the body is dependent on an array of factors (such as type of iron consumed, inhibiting and enhancing factors, health condition of the individual etc.) [37]. So, it can be conferred from the current study that some adolescents with ASD could have higher risk for iron deficiency due to lower intake levels but blood tests are required to confirm the occurrence iron deficiency anaemia.
When matched with the same gender and age group, the values for the prevalence of inadequacy for folate for the younger and the older group (between 25-50% and 50-75%, respectively), was comparable to the values obtained in our previous study (29.6% for the younger group, n=34 and 52.9% for the older group, n=52) [20]. Data from our current and previous study suggests that some Turkish male adolescents with ASD can be likely to suffer from folate deficiency, regardless of their BMI-for-age category.
The prevalence for inadequacy of vitamin B6 in the older group (less than 25% but greater than 10%) corresponded well to the values obtained with male adolescents aged 9-13 years (12.1%) and 14-18 years (15.1%) in our previous study [20]. The results on vitamin B6 deficiency in children with ASD were inconclusive due to studies reporting lower intakes [17,45,47] and higher intake levels than TD children [45].
Vitamin A and C had lower prevalence rates of inadequacy. Although low intake levels of vitamin A and C have been reported by other studies in children with ASD [23,62], our previous study with Turkish children [20] did not indicate the inadequacy of any of these nutrients.
Apart from insufficient intake of some nutrients, there were also risks associated with excess consumption of sodium and cholesterol. More than 95% of the adolescents in the current study consumed more than the maximum recommended amounts set for their age group (2200 and 2300 mg for the younger and older group, respectively). Our results from the current and previous study [20] asserted that the potential risks of adverse effects of sodium in Turkish adolescents with ASD was high. This situation was not pertinent to adolescents with ASD but it rather reflected the salt consumption of Turkish people in general. It has been found that Turkish adults consume 7200 mg sodium on average, against the maximum daily consumption level set as 2400 mg [63]. As no accurate data was available for the consumption levels of adolescents, further comparisons between adolescents with ASD and typically developing counterparts could not be made. However, excess salt consumption in this group of adolescents definitely warrants further studies and interventions as increased blood pressure due to excess consumption can be a risk factor for cardiovascular disease (CVD) in adulthood [64].
Potential risk for excess consumption of cholesterol was also a concern as was in our previous study [20]. When the normal, overweight and obese categories were considered, the range for potential risk of excess consumption was between 50 to 75% in both studies. A recent study reported intake levels of cholesterol in children with ASD (6-9 years, n=40) that were slightly higher than Spanish recommendations [65]. Children and adolescents with high cholesterol levels are more likely to have high levels as adults when compared to the rest of the population and elevated blood levels are associated with CVD [66,67]. Due to these reasons, we feel that strategies and interventions are necessary to reduce the daily cholesterol intake levels of these children with ASD.
2021 Copyright OAT. All rights reserv
Excess intake of Vitamin A in (Table 1) should be interpreted with caution, as the UL value for this nutrient was expressed as “preformed” vitamin A and therefore it includes the form that comes from animal sources and supplements [36,68]. The rate for excess intake of vitamin A (i.e. higher than 5% but lower than 10%) in the older group was similar to the values obtained from a gender and age-matched group in our previous study (6.8%) [20]. However, in the current study 10-25% of the younger group also seemed to have consumed this nutrient in excess. There were a total of nine adolescents in both age groups with intakes higher than the UL values. Their food records and feeding assessment surveys revealed that none of them took supplements and all of them consumed the form of the vitamin supplied by the plant foods. Therefore, the potential risk of excess did not apply to any of them.
It is frequently reported that children with ASD can be overly selective, with aversions to specific textures, colours, smells, and temperatures and rigidity with respect to specific brands of foods [69,70]. Different dietary patterns (caused by the unusual feeding behaviours) and preference for specific foods can lead to the development of under or overweight as well as nutritional imbalances (i.e. inadequate or excess intake of nutrients) [13-15,18,20,25,71,72]. This study gathered some data on the foods that the adolescents particularly liked eating or refrained from, but the number of selective adolescents [24] was not sufficient to establish a statistical relationship between inadequate intakes and food selectivity.
Only the %DRI value for energy differed significantly across each BMI-for-age category (Table 3). There were also some other significant differences in %DRI values; particularly between the normal and obese categories. It must be noted that these values were not actual intake values and therefore should be treated with caution. Percent DRI values were obtained by dividing the actual intake values by the appropriate DRI value for the corresponding age group. By doing this, we aimed to remove the impact of age differences in adolescents within the same BMI-for-age group. Otherwise, age differences could have interfered with the interpretation of the intake data (e.g. two males with different ages (e.g. 12 and 18 years) can fall into the overweight category; but their nutritional requirements will not be the same).
As a general trend, %DRI values increased gradually as BMI-for-age values increased (i.e. normal>overweight>obese) in the current study. As typically developing adolescents with high BMI-for-age values tend to consume energy-dense and nutrient-poor foods, the children in the overweight and obese categories were expected to have lower %DRI values for vitamins and minerals. However, %DRI values for most vitamins and minerals in the obese category were higher than the normal category. This implied that the diet of the children with ASD did not only consist of energy-dense and nutrient-poor foods.
An interesting finding was that the percent energy values (AMDR) provided by macronutrients did not differ significantly across normal, overweight and obese categories, despite the fact that the adolescents in each category had significantly different percent DRI values for energy. These results could be interpreted as different energy intake levels across BMI-for-age categories with similar ratios of energy provided by protein, fat and carbohydrates. The AMDR values in the study also remained in the recommended ranges and this was in accordance with the findings of the study carried out with American children with ASD (2-11 years, n=252) [23].
Obesity is not only caused by excess intake of calories from foods. Especially in the case of children with ASD, reduced physical activity due to physiological (such as impairment in motor skills) and social limitations (such as impaired communication and social interaction) [73], drug usage [74-76] and related chronic health conditions can also contribute to overweight or obesity. This study was not conducted to investigate the reasons overweight or obesity in the study group. The current study was designed as a continuation of our first study [20] and focused on the dietary intake of male adolescents with normal to high BMI-for-age values. However, we were also interested to collect data on the use of drugs and supplements in addition to the usual diet of the adolescents. Thirty adolescents were reported to use atypical antipsychotic drugs (73% were obese) and seven adolescents consumed supplements (57% of them were overweight; 3 adolescents were taking multivitamins and minerals, 1 adolescent was taking omega-3 fatty acids and 1 adolescent was taking herbal supplement containing gingko biloba).
Several limitations of this study are noteworthy. As this was a preliminary study on the adolescents with high BMI-for-age values, a control group was not included. If all the participants were chosen as to be in the same age group (either 9-13 years or 14-18 years, as listed by the DRI Tables) direct use of daily nutrient intake values could have been possible. However, excluding one of the two age groups in the study would have decreased the robustness of the statistical tests and therefore was not preferred. The statistical power of the tests could have been recovered by recruiting more participants, but since participation was on voluntary basis this could not have been achieved. In addition, over- or underreporting of nutritional intake data might have affected the accuracy of food diaries as they were filled in by parents/caregivers of children instead of a nutritionist or a dietician. A direct measure of food intake could also have been more optimal. Lastly, all participants were recruited from Istanbul and therefore the data may not represent the children with ASD in the other parts of Turkey. In spite of these limitations, we believe that this is a valuable study on the dietary intake of Turkish adolescents with ASD, an area that warrants more detailed studies with the aim of correcting the nutritional imbalances and improving the quality of life of these individuals.
Conclusion
This study has contributed to present knowledge on the dietary intake of Turkish adolescents with ASD. Although the results did not indicate reduced intake levels for some micronutrients in overweight and obese adolescents, prevalence data suggested that some individuals could be prone to nutritional deficiencies. Excess intakes of sodium and cholesterol have continued to be a concern due to the possible long-term effects on health. In addition to nutritional assessment, future studies can include biochemical tests, which will help identify individuals with nutritional deficiency, excess or imbalances. There is still a need for more studies that screen the nutritional and weight status of Turkish adolescents with ASD. Only then would dietary interventions be planned and implemented to resolve and improve the identified nutritional problems.
Conflicts of Interests
The authors declare that they have no conflicts of interest.
References
- American Psychiatric Association (2013) Diagnostic and Statistical Manual of Mental Disorders (5thedtn). American Psychiatric Publishing: Arlington, VA.
- Accardo JA, Malow BA (2014) Sleep, epilepsy, and autism. Epilepsy Behav 47: 202-206.
- Adams HL, Matson JL, Jang J (2014)The relationship between sleep problems and challenging behavior among children and adolescents with autism spectrum disorder. Res Autism Spectr Disord 8: 1024-30.
- Gillberg C (2015) The ESSENCE in child psychiatry: Early symptomatic syndromes eliciting neurodevelopmental clinical examinations. Res Dev Disabil 31: 1543-51. [Crossref]
- Keen DV (2008) Childhood autism, feeding problems and failure to thrive in early infancy. Seven case studies. Eur Child Adolesc Psychiatry 17: 209-216.
- Gringras P (2014) Chapter 16 - Sleep and Its Disturbances in Autism Spectrum Disorder. Principles and Practice of Pediatric Sleep Medicine: 125-31.
- Matson JL, Mahan S, Hess JA, Fodstad JC, Neal D (2010) Progression of challenging behaviors in children and adolescents with Autism Spectrum Disorders as measured by the Autism Spectrum Disorders-Problem Behaviors for Children (ASD-PBC). Res Autism Spectr Disord 4: 400-404.
- Matson JL, Mahan S, Hess JA, Fodstad JC (2010) Effect of developmental quotient on symptoms of inattention and impulsivity among toddlers with Autism Spectrum Disorders. Res Dev Disabil 31: 464-9.
- Mazurek MO, Petroski GF (2015) Sleep problems in children with autism spectrum disorder: examining the contributions of sensory over-responsivity and anxiety. Sleep Med 16: 270-279.
- Seiverling L, Williams K, Sturmey P (2010) Assessment of Feeding Problems in Children with Autism Spectrum Disorders. J Dev Phys Disabil 22: 401-413.
- Singh K, Zimmerman AW (2015) Sleep in Autism Spectrum Disorder and Attention Deficit Hyperactivity Disorder. Semin Pediatr Neurol 22: 113-125.
- Centers for Disease Control and Prevention (2015) Autism Spectrum Disorder.
- Curtin C, Bandini LG, Perrin EC, Tybor DJ, Must A (2005) Prevalence of overweight in children and adolescents with attention deficit hyperactivity disorder and autism spectrum disorders: a chart review. BMC Pediatr 5: 48.
- Curtin C, Anderson SE, Must A, Bandini L (2010) The prevalence of obesity in children with autism: a secondary data analysis using nationally representative data from the National Survey of Children’s Health. BMC Pediatr 10: 11.
- Ho HH, Eaves LC, Peabody D (1997) Nutrient intake and obesity in children with autism. Focus Autism Other Dev Disabl 12: 187-192.
- Memari AH, Kordi R, Ziaee V, Mirfazeli FS, Setoodeh MS (2012) Weight status in Iranian children with autism spectrum disorders: Investigation of underweight, overweight and obesity. Res Autism Spectr Disord 6: 234-239.
- Xia W, Zhou Y, Sun C, Wang J, Wu L (2010) A preliminary study on nutritional status and intake in Chinese children with autism. Eur J Pediatr 169: 1201-1206.
- Xiong N, Ji C, Li Y, He Z, Bo H, et al. (2009) The physical status of children with autism in China. Res Dev Disabil 30: 70-76. [Crossref]
- Shmaya Y, Eilat-Adar S, Leitner Y, Reif S, Gabis L (2015) Nutritional deficiencies and overweight prevalence among children with autism spectrum disorder. Res Dev Disabil 38: 1-6. [Crossref]
- Bicer AH, Alsaffar AA (2013) Body mass index, dietary intake and feeding problems of Turkish children with autism spectrum disorder (ASD). Res Dev Disabil 34: 3978-3987. [Crossref]
- Curtin C, Jojic M, Bandini LG (2014) Obesity in children with autism spectrum disorder. Harv Rev Psychiatry 22: 93-103. [Crossref]
- Must A, Curtin C, Hubbard K, Sikich L, Bedford J, et al. (2014) Obesity Prevention for Children with Developmental Disabilities. Curr Obes Rep 3: 156-170. [Crossref]
- Hyman SL, Stewart PA, Schmidt B, Cain U, Lemcke N, et al. (2012) Nutrient intake from food in children with autism. Pediatrics 130 Suppl 2: S145-153. [Crossref]
- Kidd PM (2003)An approach to the nutritional management of autism. Altern Ther Health Med 9: 22-31.
- Zimmer MH, Hart LC, Manning-Courtney P, Murray DS, Bing NM, et al. (2012) Food variety as a predictor of nutritional status among children with autism. J Autism Dev Disord 42: 549-556. [Crossref]
- Marí-Bauset S, Llópis-González A, Zazpe I, Marí-Sanchis A, Suárez-Varela MM (2015) Fat intake in children with autism spectrum disorder in the Mediterranean region (Valencia, Spain). Nutr Neurosci.
- De Vinck-Baroody O, Shui A, Macklin EA, Hyman SL, Leventhal JM, et al. (2015) Overweight and obesity in a sample of children with autism spectrum disorder. Acad Pediatr 15: 396-404.
- Pekcan G, Karaagaoglu N (2000) State of nutrition in Turkey. Nutr Health 14: 41-52.
- Ministry of Health (2014) Nutrition and Health Survey 2010. Ankara.
- Hergüner S, Hergüner A (2011) Otistikbozukluguolançocukveergenlerdekolesteroldüzeyleri. Selçuk Üniversitesi Tip Fakültesi Derg 27: 226-228.
- Yorbik O, Akay C, Sayal A, Cansever A, Sohmen T, et al. (2004) Zinc status in autistic children. J Trace Elem Exp Med 17: 101-107.
- Yorbik O, Dilaver B, Cansever A, Akay C, Sayal A, et al. (2003) Otistikçocuklardasaçkursundüzeylerininarastirilmasi. Klin Psikiyatr 6: 213-216.
- Yorbik O, Sayal A, Akay C, Akbiyik DI, Sohmen T (2002) Investigation of antioxidant enzymes in children with autistic disorder. Prostaglandins, Leukot Essent Fat Acids 67: 341-343.
- Bilgiç A, Gürkan K, Türkoglu S, Akça ÖF, Kiliç BG, et al. (2010) Iron deficiency in preschool children with autistic spectrum disorders. Res Autism Spectr Disord 4: 639-644.
- Pediatric Feeding and Swallowing Center (2013) Feeding History Questionnaire [Internet].
- Institute of Medicine (2015) DRI Tables [Internet].
- Sizer F, Whitney E (2013) Nutrition: Concepts and Controversies [Internet]. Cengage Learning.
- Institute of Medicine (2000) Dietary Reference Intakes: Applications in Dietary Assessment. National Academy Press:Washington D.C..
- Institute of Medicine (2003) Adjustment of Observed Intake Data to Estimate the Distribution of Usual Intakes in a Group: Dietary Reference Intakes: Applications in Dietary Planning.The National Academies Press:Washington D.C.
- Barr SI, Murphy SP, Poos MI (2002) Interpreting and using the dietary references intakes in dietary assessment of individuals and groups. J Am Diet Assoc 102: 780-788. [Crossref]
- Baş M, Altan T, Dinçer D, Aran E, Kaya HG, et al. (2005) Determination of dietary habits as a risk factor of cardiovascular heart disease in Turkish adolescents. Eur J Nutr 44: 174-182. [Crossref]
- Neslisah R, Emine AY (2011) Energy and nutrient intake and food patterns among Turkish university students. Nutr Res Pract 5: 117-123.
- Garipagaoglu M, Eliuz B, Esin K, Çagatay P, Nalbant H, et al. (2012) sinifögrencilerininbeslenmedurumlarinindegerlendirilmesi. Istanbul Tip Derg 13: 1-8.
- Garipagaoglu M, Budak N, Oner N, Saglam O, Nisli K (2006) Üç farkli üniversite deegitimgörenkizögrencilerinbeslenmedurumlarivevücutagirliklarinindegerlendirilmesi. Saglik Bilim Derg 15: 173-180.
- Herndon AC, DiGuiseppi C, Johnson SL, Leiferman J, Reynolds A (2009) Does nutritional intake differ between children with autism spectrum disorders and children with typical development? J Autism Dev Disord 39: 212-222. [Crossref]
- Schmitt L, Heiss CJ, Campbell EE (2008) A comparison of nutrient intake and eating behaviour of boys with and without autism. Top Clin Nutr 3: 23-31.
- Cornish E (1998) A balanced approach towards healthy eating in autism. J Hum Nutr Diet. 11:501-9.
- Lindsay RL, Eugene Arnold L, Aman MG, Vitiello B, Posey DJ, et al. (2006) Dietary status and impact of risperidone on nutritional balance in children with autism: a pilot study. J Intellect Dev Disabil 31: 204-209.
- Johnson CR, Handen BL, Mayer-Costa M, Sacco K (2008) Eating habits and dietary status in young children with autism. J Dev Phys Disabil 20: 437-448.
- Mulloy A, Lang R, O’Reilly M, Sigafoos J, Lancioni G, et al. (2010) Gluten-free and casein-free diets in the treatment of autism spectrum disorders: A systematic review. Res Autism Spectr Disord 4: 328-339.
- Marí-Bauset S, Zazpe I, Mari-Sanchis A, Llopis-González A, Morales-Suárez-Varela M (2014) Evidence of the gluten-free and casein-free diet in autism spectrum disorders: a systematic review. J Child Neurol 29: 1718-1727.
- Akman AO, Tumer L, Hasanoglu A, Ilhan M, Caycı B (2011) Frequency of vitamin D insufficiency in healthy children between 1 and 16 years of age in Turkey. Pediatr Int 53: 968-973. [Crossref]
- Üner A, Acar MN, Cesur Y, Dogan M, Çaksen H, et al. (2010) Rickets in healthy adolescents in Van, the eastern of Turkey. European Journal of General Medicine.
- Hekimsoy Z, Dinç G, Kafesçiler S, Onur E, Güvenç Y, et al. (2010) Vitamin D status among adults in the Aegean region of Turkey. BMC Public Health 10: 782. [Crossref]
- TEPAV (2012) Sütve Süt Ürünleri Imalati Sektörü Sonuç Raporu [Internet].
- Taneli B (2005) Anadolu toplumunda çinko. Ege Tip Derg 44: 1-10.
- Cakmak I (2008) Enrichment of cereal grains with zinc: Agronomic or genetic biofortification? Plant Soil 302: 1-17.
- Tanriverdi MH (2008) Pnömönitanisiylahastaneyeyatirilan 0-2 yasarasiçocuklarda serum çinkodüzeyi. Istanbul EgitimveArastimaHastanesi.
- Yasuda H, Yoshida K, Yasuda Y, Tsutsui T (2011)Infantile zinc deficiency: association with autism spectrum disorders. Sci Rep 1: 129.
- Reynolds A, Krebs NF, Stewart PA, Austin H, Johnson SL, et al. (2012) Iron status in children with autism spectrum disorder. Pediatrics 130: S154-S159.
- Dosman CF, Brian JA, Drmic IE, Senthilselvan A, Harford MM, et al. (2007) Children with autism: effect of iron supplementation on sleep and ferritin. Pediatr Neurol 36: 152-158. [Crossref]
- Emond A, Emmett P, Steer C, Golding J (2010) Feeding symptoms, dietary patterns, and growth in young children with autism spectrum disorders. Pediatrics 126: e337-342. [Crossref]
- SaglikBakanligi (2011)Türkiye Asiri Tuz Tüketiminin Azaltilmasi Programi 2011- 2015. Ankara.
- He FJ, Mac Gregor GA (2009) A comprehensive review on salt and health and current experience of worldwide salt reduction programmes. J Hum Hypertens 23: 363-84.
- Marí-Bauset S, Llopis-González A, Zazpe-García I, Marí-Sanchis A, Morales-Suárez-Varela M (2015) Nutritional status of children with autism spectrum disorders (ASDs): a case-control study. J Autism Dev Disord 45: 203-212. [Crossref]
- American Academy of Pediatrics Committee on Nutrition. (1998) American Academy of Pediatrics. Committee on Nutrition. Cholesterol in childhood. Pediatrics 101: 141-147. [Crossref]
- Cook WB (2009) High cholesterol in children. US Pharm 34: 27-32.
- Duyff RL (2002) American Dietetic Association of Complete Food and Nutrition Guide. New Jersey: John Wiley and Sons.
- Cermak SA, Curtin C, Bandini LG (2010) Food selectivity and sensory sensitivity in children with autism spectrum disorders. J Am Diet Assoc 110: 238-246. [Crossref]
- Schreck KA, Williams K (2006) Food preferences and factors influencing food selectivity for children with autism spectrum disorders. Res Dev Disabil 27: 353-363. [Crossref]
- Bölte S, Ozkara N, Poustka F (2002) Autism spectrum disorders and low body weight: is there really a systematic association? Int J Eat Disord 31: 349-351. [Crossref]
- Mouridsen SE, Rich B, Isager T (2002) Body mass index in male and female children with infantile autism. Autism 6: 197-205. [Crossref]
- Lang R, Koegel LK, Ashbaugh K, Regester A, Ence W, et al. (2010) Physical exercise and individuals with autism spectrum disorders: A systematic review. Res Autism Spectr Disord 4: 565-576.
- Sharma A, Shaw SR (2012) Efficacy of risperidone in managing maladaptive behaviors for children with autistic spectrum disorder: a meta-analysis. J Pediatr Health Care 26: 291-299.
- Uçok A, Gaebel W (2008) Side effects of atypical antipsychotics: a brief overview. World Psychiatry 7: 58-62.
- Saglik Bakanligi (2004) Türkiye’ye ÖzgÜ Beslenme Rehberi. Ankara.