Abstract
We sought to demonstrate preclinical adverse cardiac and systemic effects of Obstructive Sleep Apnea (OSA) improve with Continuous Positive Airway Pressure (CPAP) utilizing known biomarkers and echocardiographic measures. Our goal was to determine which measures would have utility in monitoring effectiveness of CPAP therapy. Subjects were recruited from a tertiary academic medical center with open access referrals to an American Academy of Sleep Medicine accredited sleep center. Consecutive patients with polysomnography confirmed OSA at least moderate in severity (Apnea Hypopnea Index> 20) were invited to participate. After satisfying the exclusion and inclusion criteria, patients completed an echocardiography and biomarker testing and then started CPAP at the pressure recommended based on their treating sleep physician. Twenty-one patients completed baseline and repeat echocardiography and biomarker testing after 3 months of CPAP. Adherence to therapy was monitored using a combination of prospectively logged self-report and interrogation of their CPAP devices. Nearly all subjects used CPAP at least 4 hours/night. . Cardiovascular parameters measured included 2d ECHO with specific measurements of right heart function including Tricuspid Annular Plane Systolic Excursion (TAPSE), Right Ventricular Velocity of the tricuspid annular systolic motion (S’ or S-prime) by tissue Doppler and serum biomarkers including uric acid (UA), leptin, C-Reactive Protein (CRP), fibrinogen and Brain Natriuretic Peptic (BNP). Baseline Echocardiography measures of TAPSE and S’ correlated inversely with OSA severity by AHI. At three months of CPAP use TAPSE improved by 2.5 mm (95% CI 1.6-3.4 p=0.0001) and S’ improved by 1.44 cm/s (95% CI 0.89-2.00 p=0.0002). Serum biomarkers at enrollment were not significantly correlated to AHI severity and were not significantly changes with CPAP. Log ratio changes in Leptin and Uric Acid levels correlated with TAPSE and S’ changes. Our study shows that echocardiographic measures of right heart function in moderate to severe OSA improved significantly with 3 months of CPAP therapy and these improvements correlated with changes in serum biomarkers Leptin and Uric Acid.
Introduction
Numerous cross-sectional studies have demonstrated an association between severe obstructive sleep apnea syndrome OSA and increased cardiovascular mortality and morbidity [1-6]. This is especially true when OSA coexists with hypertension, atrial fibrillation, coronary artery disease or congestive heart failure [5,7-9]. Many risk factors for OSA, such as male gender, obesity and increasing age are the same as for cardiovascular disease making it difficult to establish a causal relationship between OSA and these cardiovascular endpoints [4].
Animal models clearly demonstrate progressive cardiovascular dysfunction in the setting of severe sleep apnea. Epidemiologic studies by their nature have left us with only modest correlations at best. Left ventricular dysfunction is well recognized as a comorbid condition in severe OSA [10,11]. However, right ventricular (RV) dysfunction without overt right heart dilation has been identified as a finding in OSA that may precede deterioration of left heart function [10-12]. Early identification of subclinical RV dysfunction in the setting of OSA could be an important intercession point in prevention of overt heart failure.
Obstruction of the upper airway even when partial, results in increasingly negative inspiratory intrathoracic pressures. This leads to increased Left Ventricular transmural (LVTm) pressures, and increased left ventricular (LV) afterload [13]. The increasingly negative intrathoracic pressure also increases venous return, augmenting RV pre-load, while the desaturation associated with the event leads to hypoxic pulmonary vasoconstriction that in turn increases RV afterload [14]. The overfilling of the RV leads to distension and the leftward septal displacement results in diastolic impairment of LV filling [15].
Even prior to overt LV dysfunction leading to congestive heart failure (both systolic and diastolic forms) the patient with severe OSA likely has key changes in cardiac physiology due to the mechanical [16] and oxidative stresses that are the result of the condition.
The size and systolic function of the right ventricle has been notoriously challenging to accurately measure in clinical research due to the chamber’s crescentic shape. A variety of cardiac ultrasound methodologies have been described to evaluate right heart systolic function, including more recent ultrasound techniques that make use of the tissue Doppler. The use of M-Mode echocardiography to measure tricuspid annular plane systolic excursion TAPSE has been available since the 1970’s. More recently, the development of pulsed wave tissue Doppler imaging that permits the measurement of the tricuspid annular systolic velocity S’ has been described [17]. Both measurements are clinically practical, and can be performed quickly with good reproducibility. Both techniques require inferring RV systolic function based on mechanical motion of the tricuspid annulus. Echocardiographic measurements of TAPSE and S’ has been shown to be inversely correlated with OSA severity by Apnea Hypopnea Index (AHI) [18,19]. Even in the absence of hypertension, the tissue Doppler method does support the presence of right ventricular dysfunction with moderate to severe OSA [18,19].
Given the described mechanical and oxidative stresses16 associated with OSA, it is understandable that there is much interest in identifying biomarkers that may predict future cardiac and system dysfunction in the setting of OSA. Some of the factors investigated include CRP, Fibrinogen, UA, BNP, interleukins, and even Leptin [2,20-26]. Evaluation of these factors in OSA have however drawn contradictory conclusions regarding the association of the biomarker with OSA, its severity and the relative impact of CPAP therapy [18, 24,27-30]. Taking these biomarkers and assessing them together with echocardiography in OSA may provide a better tool in future studies.
The purpose of our study was to identify clinically useful echo measurements and serum markers that would index subclinical cardiac dysfunction in moderate to severe OSA. Our secondary objective was to determine if any combination of these measures could prove useful for monitoring cardiovascular risk abatement provided by therapeutic CPAP in future longitudinal studies of OSA.
Methods
Sample size was calculated based on consideration for alpha error of 0.05, power of 0.8, effect size of 5 and BNP standard deviation of 11 within the group. 30 patients with moderate to severe OSA would allow detection of any marker combination that would predict 25% or more of the change in health status. Sequential patients who underwent polysomnography over the enrollment period who were identified with at least moderate OSA (defined as AHI >20) were invited to participate in the study. Patients who did not have an exclusion criterion (clinically apparent heart failure, recent myocardial infarction, structural heart disease, and/or poorly controlled hypertension) were prospectively studied. All study processes were in accordance with the Institutional IRB approved protocol. Twenty-one of 30 subjects enrolled completed both the baseline and the 3 months of CPAP echo as well as paired baseline and follow up blood work for serum analyzes.
Echocardiographic measurements
All patients underwent complete transthoracic echocardiogram studies with a Vivid-7 ultrasound machine (General Electric, Waukesha, WI) using a 1.5-4 MHz phased-array transducer. A standard two-dimensional and Doppler echocardiographic study was performed on all patients at baseline and after approximately 3-months of CPAP use. In addition to the standard exam, apical color tissue Doppler images (TDI) were acquired with separate sectors for the left and right ventricles and optimized for wall alignment and frame rates for subsequent off-line analysis. LV diameter and wall thickness measurements were obtained from parasternal long axis 2D images according to the American Society of Echocardiography (ASE) guidelines [12]. LV mass was calculated by the Devereux-modified ASE formula and indexed for body surface area [12]. LV ejection fraction was determined using the modified Simpson’s method. Left atrial size was estimated by body surface area indexed volume using the area-length method as recommended by ASE [12]. All blood flow Doppler velocities were acquired at quiet held end-expiration, and averaged for 3 samples. These included mitral and tricuspid inflow Early (E) and Late (A) wave velocities, LV and pulmonary outflow tract velocities. Mitral and tricuspid annular e’, a’, and tricuspid annular S’ velocities were measured off-line from acquired color TDI images, with three measurements of each velocity were averaged. RV systolic function was assessed using M-mode based tricuspid annular plane systolic excursion TAPSE and tissue Doppler systolic velocity S’ techniques [26]. Pulmonary artery acceleration time was obtained by pulsed wave Doppler exam, and 3 measurements averaged. The mean pulmonary artery (PA) pressure was calculated using a previously described regression equation [26] where mean PA pressure = 79 – (0.45 x PA acceleration time (ms). Systolic PA pressure was estimated when a complete tricuspid regurgitation envelope could be obtained. The highest Doppler velocity obtained was used in calculating the right ventricular-atrial gradient using the modified Bernoulli equation. The maximal obtained gradient was added to the estimated RA pressure to estimate the PA systolic pressure, presuming no significant pulmonary artery stenosis was present. Right atrial pressure was estimated by the size and the degree of inferior venae cava collapse during a sniff from the subcostal window according to guidelines. Based on measured Doppler data recorded, the left and right ventricular E/A, e’/a’, and E/e’ ratios were computed [26]. All measurements were supervised or performed by a National Board of Echocardiography certified cardiologist.
Serum marker measurements
Blood samples were collected at baseline and after 3 months of therapy with CPAP. The samples were analyzed immediately as per routine clinical reporting at our hospital laboratory for BNP and uric acid levels. Serum uric acid levels were analyzed using the uricase method (reference values of 2.4-5.7 mg/dl in women and 3.4-7.0mg/dl in men). BNP was analyzed using an automated direct chemiluminescent assay (ADVIA Centaur System, Siemens Healthcare Diagnostics). This assay employs 9 control levels and has a sensitivity of 2 pg/ml. Additional serum was held in -80°C freezer for later analysis of CRP, fibrinogen and leptin levels. Quality control for all radioimmunoassay (RIA) and enzyme immunoassays (ELISA) are performed to assure stability and reliability. Five pool sera of increasing peptide concentrations are used to evaluate the intra- and interassay coefficients of variance (CVs). Serum leptin concentration and high-sensitivity CRP were determined in the CTSI Core Laboratory. Leptin was determined using an RIA kit from Linco Research, currently EMD Millipore Corp. (Billerica MA). The intraassay CV ranges between 3.4 and 6.6%, and the interassay CV from 7.1 to 9.3%. CRP was analyzed by ELISA from MP Biomedicals (Santa Ana CA). The intraassay CV for the CRP assay ranges between 3-4%, and the interassay CV between 3-5%. Fibrinogen was measured in a single assay at the University of Kentucky CTSI Core Laboratory using the MILLIPLEX MAP Human Cardiovascular Disease (CVD) Panel 2 Fibrinogen kit (EMD Millipore Corp). The intra-assay CV for fibrinogen ranges between 3.7 and 13.4%, and the test has a sensitivity of 80 pg/ml.
CPAP adherence measurement
During the study period, subjects provided their CPAP machines at the 3 month visit for adherence assessment. CPAP manufacturers varied so CPAP adherence was monitored using a combination of machine downloads, hour use meters and prospectively journaled adherence. Hours of use and days of use for the month preceding the visit were recorded for each subject. Good adherence was defined using the Centers of Medicare and Medicaid Services criteria (>4 hrs. per day of CPAP use for >70% of days measured) over the preceding 30 days of use.
Statistical analysis
Descriptive statistics were applied to subject characteristics including age, gender, medical history, blood pressure, height, weight, medications, Epworth sleepiness score, and additional questions for quality of life at the initial visit prior to starting CPAP and at a visit at least 3 months after commencing CPAP therapy. Pre and Post treatment echocardiography measurements for left and right heart function as well as the biomarkers were analyzed using paired T test. Biomarkers were also analyzed using Pearson correlations for post-pre differences in TAPSE and S’ verses the base 2 logarithm of post/per ratios of BNP, UA, and leptin levels.
Results
Twenty one patients completed all study processes and underwent analysis. General demographics (Table 1) for the group including a 3:1 male to female ratio (16:5) and most were Caucasian (65%). The mean age was 47.5 years (±9.9) years. The mean BMI was 38.2 kg/m2 (±8.3). The mean AHI was 61.1 (±32.1) events/hour. At initial evaluation the average blood pressure was systolic 126.0 (SD ± 16.5) and diastolic 78.6 (SD ± 8.9) mmHg. There were no significant changes in blood pressure or BMI of the subjects at the 3- month visit as compared to their initial visit. Mean daily use of CPAP therapy at the 3-month visit was 5.6 hours/night with only 3 of the 21 subjects not meeting the CMS adherence standard (range: 1.1 - 7.6).
Table 1. Study population characteristics
|
Gender
|
|
|
female
|
5 (23.8%)
|
|
male
|
16 (76.2%)
|
|
Age
|
|
|
Mean years ± SD
|
47.5 ± 9.9
|
|
Race
|
|
|
African American
|
5 (25.0%)
|
|
Native American
|
2 (10.0%)
|
|
White
|
14 (65.0%)
|
|
Weight (lbs.)
|
|
|
Mean ± SD
|
255.5 ± 57.6
|
|
BMI (Body Mass Index)
|
|
|
Mean ± SD
|
38.2 ± 8.3
|
|
AHI (Apnea Hypopnea Index)
|
|
|
Mean ± SD
|
61.1 ± 32.5
|
|
Diastolic Blood Pressure
|
|
|
Mean ± SD
|
78.6 ± 8.9
|
|
Systolic Blood Pressure
|
|
|
Mean ± SD
|
126.0 ± 16.5
|
|
Mean Arterial Pressure
|
|
|
Mean ± SD
|
102.3 ± 11.7
|
Echocardiography findings at baseline were within normal limits. Comparisons before and after CPAP of Fractional Shortening, Left Atrial (LA) volume, Left Ventricular (LV) mass, Mitral Valve deceleration time (MV-DECTIME), Mitral Valve Early (E) to late (A) ventricular filling velocities (MV-E/A), S’ TAPSE and Log MV-E/A between visit one and visit two were completed. TAPSE and S’ correlated inversely with OSA severity by AHI. Three months of CPAP use resulted in TAPSE improvement of 2.5 mm (95% CI 1.6-3.4 p=0.0001) and S’ (S-prime) (right ventricular systolic velocity) improvement of 1.44 cm/s (95% CI 0.89-2.00 p=0.0002) (Table 2).
Table 2. Echo comparisons
|
Visit 2 vs. Visit 1
|
N
|
Mean difference
|
SE(difference)
|
95% CI
|
P-value paired t-test
|
|
TAPSE2 - TAPSE1 (cm)
|
21
|
0.25
|
0.05
|
( 0.14, 0.36)
|
0.0001
|
|
S-prime2 – S-prime1
|
21
|
1.44
|
0.32
|
( 0.77, 2.11)
|
0.0002
|
|
logMV-EAratio2 – logMV-EAratio1
|
21
|
-0.07
|
0.10
|
(-0.27, 0.13)
|
0.4592
|
|
MV-DECTIME2 – MV-DECTIME1
|
20
|
0.03
|
0.01
|
(-0.00, 0.06)
|
0.0581
|
|
LVMASS2 - LVMASS1
|
20
|
2.30
|
3.16
|
(-4.32, 8.92)
|
0.4762
|
|
LA_VOLUME2 - LA_VOLUME1
|
18
|
4.17
|
1.54
|
( 0.92, 7.42)
|
0.0150
|
|
MV-E/A2 – MV-E/A1
|
18
|
0.03
|
0.08
|
(-0.14, 0.21)
|
0.6822
|
|
|
|
|
|
|
|
Serum biomarkers measured at baseline were in the normal reported range (Table 3). BNP 12.6 (SD ± 18.2) pg/ml. Uric Acid serum levels 6.6 ± 1.4 mg/dl. Leptin levels 17.5 ± 14.7 ng/ml. Fibrinogen 3477.9 ± 1438.0 micrograms/ml. CRP 8.1 ± 13.1 mg/l. Direct comparison of the biomarkers and blood pressures pre to post yielded no significant changes (Table 3).
Table 3. Serum Marker Measures
|
|
Visit 1 Visit 2
|
|
BNP
|
|
|
|
Mean ± SD
|
12.6 ± 18.2
|
11.9 ± 10.6
|
|
Uric Acid
|
|
|
|
Mean ± SD
|
6.6 ± 1.4
|
6.7 ± 1.6
|
|
Leptin
|
|
|
|
Mean ± SD
|
17.5 ± 14.7
|
20.2 ± 15.9
|
|
Fibrinogen
|
|
|
|
Mean ± SD
|
3477.9 ± 1438.0
|
3778.5 ± 1586.0
|
|
CRP
|
|
|
|
Mean ± SD
|
8.1 ± 13.1
|
6.9 ± 8.8
|
|
Diastolic
|
|
|
|
Mean ± SD
|
78.6 ± 8.9
|
78.2 ± 8.0
|
|
Systolic
|
|
|
|
Mean ± SD
|
126.0 ± 16.5
|
127.4 ± 14.6
|
|
Map
|
|
|
|
Mean ± SD
|
102.3 ± 11.7
|
102.8 ± 9.6
|
Analysis for correlation between the echocardiographic findings and changes seen in the biomarkers were also completed. The Log change analysis revealed a significant correlation between improvement in TAPSE and uric acid log ratio. Uric Acid-Log Ratio vs. TAPSE change 0.54059 (p=0.0169). There was not such as association with BNP and Leptin Log ratios and TAPSE change (Figure 1).
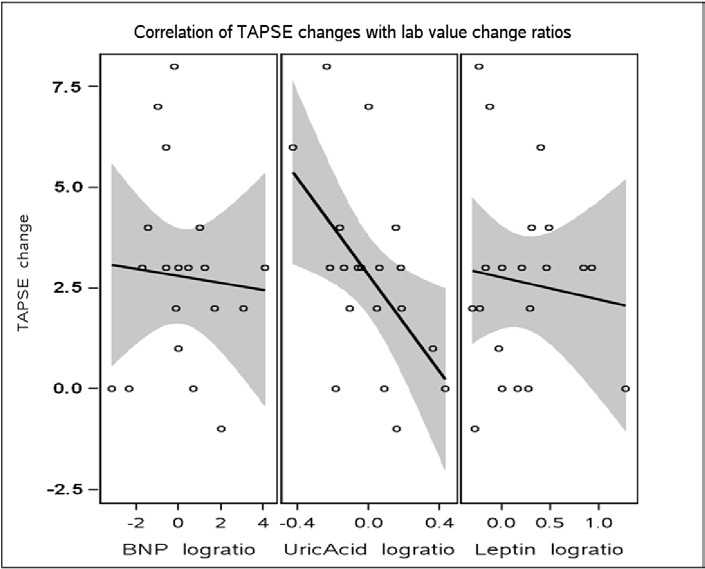
Figure 1. Correlation of TAPSE changes with lab value change ratios
There was also a significant correlation between Echocardiographic S’ changes and leptin log ratio changes (Figure 2). Leptin_log ratio vs. S’ change: -0.52417 (p=0.0177). There was not such an association with Uric acid and BNP log ratios and S’ (S-prime) changes.
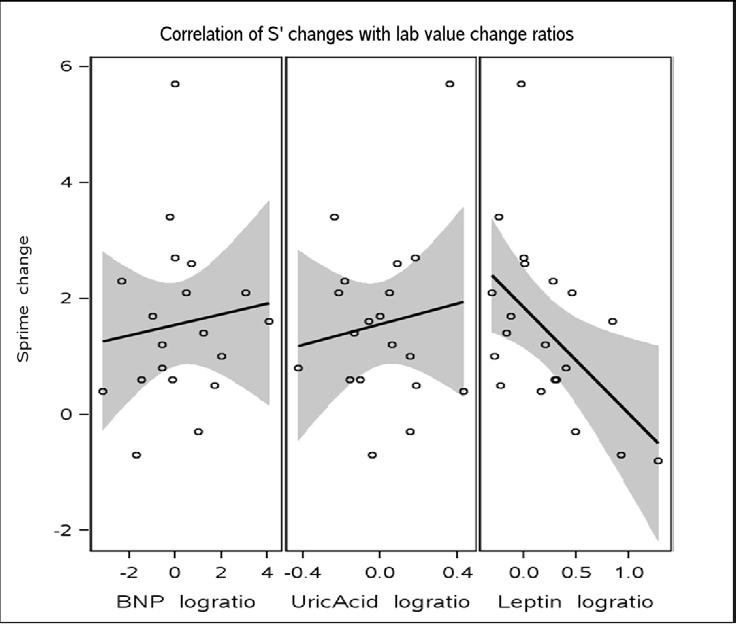
Figure 2. Correlation of S’ changes with lab value change ratios
Discussion
Continuous positive airway pressure is known to maintain upper airway patency during sleep by increasing transmural pressure of upper airways and treatment of OSA by CPAP improves cardiac function and quality of life. Many epidemiologic studies support that cardiovascular morbidity and mortality is positively impacted by CPAP use 7, 24. Beyond CPAP adherence predicting decreased mortality and morbidity for population studies, there are no earlier predictors of long term cardiovascular protection or benefit for individual patients [31,32].
Attempts to find a biomarker or series of biomarkers that can help have met with mixed results. Serum leptin level elevation has been associated with an increased risk of myocardial infarction, hemorrhagic stroke, and abnormal fibrinolysis [33-35]. Serum leptin elevation has been shown as an independent predictor of OSA [33] which is reversible with OSA treatment [35]. Improvement in leptin levels after OSA treatment with CPAP has been reported [36]. ProBNP (the pro peptide) is formed by ventricular myocytes in response to changes in volume and pressure. BNP levels are also increased by hypoxia. However there are conflicting results regarding BNP and its association with OSA [17,21,37]. Limited studies with adequate control of confounding variables demonstrated that in those with OSA, CRP as well as uric acid independently are associated with elevated Odds Ratio (OR) for Metabolic syndrome [9,31]. uric acid: OR: 4.19 (1.70–10.35) and C-reactive protein: OR: 6.10 (2.64–14.11). Significant improvements were measured in the CRP levels with CPAP use for 4 months in a follow up study of this population [8,9]. Increase in level of Uric Acid is seen in models of oxidative stress as well as in populations with high cardiovascular morbidity. Uric Acid is therefore considered a marker of oxidative stress. Increased urinary UA excretion has been shown in adult patients with OSA and return to normal with continuous positive airway pressure therapy [1,4,28,29]. In a study, 19 in 85 adult patients referred for suspected OSA, also found a significant correlation between serum UA levels and the apnea-hypopnea index [33]. Several studies [19,28] in adults with OSA have also shown an overnight increase in urinary UA/creatinine ratio compared to control subjects and/or a decline of this ratio after treatment with continuous positive airway pressure.
Our study did not reach the power needed to demonstrate direct correlations between the CPAP use and changes in these serum markers. Yet, we did see significant changes in the ratios of the leptin and the uric acid with CPAP use when paired with changes in the right heart measures by echocardiography.
In the setting of overt left and right heart dysfunction, several well designed studies using standard echocardiography had documented improvement with CPAP for severe sleep apnea [17,22,38]. Right Heart function can be compromised prior to clinical signs of heart failure in OSA but standard echocardiography is not typically targeted to assess the right heart. Standard echocardiography evaluation and even cardiac magnetic resonance techniques have been applied in assessing for subclinical cardiac dysfunction in the setting of mild to moderate OSA as in the MOSAIC trial (Multicentre Obstructive Sleep Apnea Interventional Cardiovascular trial) without significant improvements by either technique with 6 months of cpap use, regardless of degree of cpap adherence [39]. As new cardiac imaging technologies have been developed improvements in assessing the right heart have also occurred. Recent publications with small cohorts have been able to demonstrate significant improvement in right heart size and function [40]. We were able to detect changes in right heart function as evidenced by improvements in TAPSE and S’ with regular chronic nightly CPAP use supporting a protective effect of CPAP on right heart function. One explanation for this maybe that normative values for both TAPSE and S’ may not be correct. This is supported by the fact that while the baseline values were within the reported normal range, the measurements did improve with 3 months of nightly CPAP use. The improvement maybe the result of correction of nocturnal recurrent desaturations associated with moderate to severe obstructive sleep apnea and the resultant resolution of hypoxic pulmonary vasoconstriction. This may reduce right heart strain/work and CPAP as a form of positive pressure breathing may also indirectly improves both left and right heart function through direct mechanical action offloading the transmural pressures to the heart through the starling mechanism. The improvement in TAPSE and S’ by echo also correlated with improvement in the patient’s log leptin levels and log uric acid levels, the clinical significance of these changes will require more study using a larger population. A small study of systolic heart failure patients with OSA and CPAP’s effect on heart function utilized both standard echocardiography and [13] C-Hydroxyephedrine Positron Emission Tomography to assess cardiovascular function in OSA. While they did not demonstrate significant improvement in left ventricular function by echocardiography, improvement in the presynaptic sympathetic nerve function by the PET technique was seen for those using cpap [16]. It may well be that as these new modalities are applied to OSA study we better understand how similarly designed studies have met with mixed results. The sympathetic nervous system is clearly abnormally stimulated in severe OSA [2,3] even within the first night of the condition. It is the repeated over stimulation of the nervous system and mechanical stressors on the cardiovascular system that are the source of long term morbidity and mortality in this condition [18,31,41].
In our small cohort study the initial echo right heart measures of TAPSE or S’ and biomarkers at enrollment were not abnormal. The significant change in the TAPSE and S’ measured after 3 months of CPAP suggest some off loading of subtle strain on the right heart. Correlation of these changes in right heart strain and the log ratios of leptin and UA as early as 3 months indicate that cardiovascular disease risk reduction in the setting of moderate to severe OSA is more complicated than can be assessed prospectively with either of these modalities.
Our study findings along with other recent studies continue to suggest that echocardiographic measurements of right heart function may play a role in better assessing at risk patients but cannot used as the only modality. Clearly severity of OSA plays an important part in the impact on the cardiovascular and sympathetic nervous system and larger controlled studies may need to also focus on newer techniques and technologies applied in scientific investigation of obstructive sleep apnea. Well designed large clinical trials with multiple modalities to assess cardiovascular health and function including some mentioned above such as PET techniques of sympathetic nervous system function, echocardiographic evaluation of right heart function and left heart function, and serum biomarkers of cardiovascular risk are the next steps [41-55].
2021 Copyright OAT. All rights reserv
Acknowledgement
1UL1RR031973 from the Clinical and Translational Science Award (CTSI) program of the National Center for Research Resources, National Institutes of Health
References
- Berman E, DiBenedetto R, Causey D (1991) Right ventricular hypertrophy detected by echocardiography in patients with newly diagnosed obstructive sleep apnea. CHEST J 100: 347-350. [Crossref]
- Bradley TD, Hall MJ, Ando S, Floras JS (2001) Hemodynamic effects of simulated obstructive apneas in humans with and without heart failure. Chest 119: 1827-1835. [Crossref]
- Bradley TD, Rutherford R, Grossman RF, Lue F, Zamel N, et al. (1985) Role of daytime hypoxemia in the pathogenesis of right heart failure in the obstructive sleep apnea syndrome. Am Rev Respir Dis 131: 835-839. [Crossref]
- Braghiroli A, Sacco C, Erbetta M, Ruga V, Donner CF (1993) Overnight urinary uric acid: creatinine ratio for detection of sleep hypoxemia. Validation study in chronic obstructive pulmonary disease and obstructive sleep apnea before and after treatment with nasal continuous positive airway pressure. Am Rev Respir Dis 148: 173-178. [Crossref]
- Brinker JA, Weiss JL, Lappé DL, Rabson JL, Summer WR, et al. (1980) Leftward septal displacement during right ventricular loading in man. Circulation 61: 626-633. [Crossref]
- Can M, AÃikgÃz S, Mungan G, BayraktaroÄŸlu T, KoÃak E, et al. (2006) Serum cardiovascular risk factors in obstructive sleep apnea. Chest 129: 233-237. [Crossref]
- Cherniack NS (2008) N-terminal pro-B-type naturetic peptide (NTBNP): so much promise and such a disappointment. Sleep Breath 12: 3-5. [Crossref]
- Drager LF, Bortolotto LA, Figueiredo AC, Krieger EM, Lorenzi GF (2007) Effects of continuous positive airway pressure on early signs of atherosclerosis in obstructive sleep apnea. Am J Respir Crit Care Med 176: 706-712. [Crossref]
- Drager LF, Lopes HF, Maki-Nunes C, Trombetta IC, Toschi-Dias E, et al. (2010) The impact of obstructive sleep apnea on metabolic and inflammatory markers in consecutive patients with metabolic syndrome. PLoS One 5: e12065. [Crossref]
- Jelic S, Padeletti M, Kawut SM, Higgins C, Canfield SM, et al. (2008) Inflammation, oxidative stress, and repair capacity of the vascular endothelium in obstructive sleep apnea. Circulation 117: 2270-2278. [Crossref]
- Kasai T, Bradley TD (2011) Obstructive sleep apnea and heart failure: pathophysiologic and therapeutic implications. J Am Coll Cardiol 57: 119-127. [Crossref]
- Lang RM, Bierig M, Devereux RB, (2005) Recommendations for chamber quantification: A report from the american society of echocardiography's guidelines and standards committee & the chamber quantification writing group, developed in conjunction with the european association of echocardiography. J Am Soc Echocardiogr 18: 1440-63.
- Gavina C, Pinho T, Drummon M. (2006) Right ventricular function in patients with moderate to severe obstructive sleep apnea syndrome. Europ J Echocardiography 7(suppl 1): S177-S177.
- Guidry UC1, Mendes LA, Evans JC, Levy D, O'Connor GT, et al. (2001) Echocardiographic features of the right heart in sleep-disordered breathing: the Framingham Heart Study. Am J Respir Crit Care Med 164: 933-938. [Crossref]
- He J, Kryger MH, Zorick FJ, Conway W, Roth T (1988) Mortality and apnea index in obstructive sleep apnea. Experience in 385 male patients. Chest 94: 9-14. [Crossref]
- Hall AB, Ziadi MC, Leech JA, Chen SY, Burwash IG, et al. (2014) Effects of short-term continuous positive airway pressure on myocardial sympathetic nerve function and energetics in patients with heart failure and obstructive sleep apnea: a randomized study. Circulation 130(11): 892-901. [Crossref]
- Maeder MT, Ammann P, Rickli H, Schoch OD, Korte W, et al. (2008) N-terminal pro-B-type natriuretic peptide and functional capacity in patients with obstructive sleep apnea. Sleep Breath 12: 7-16. [Crossref]
- Marin JM, Carrizo SJ, Vicente E, Agusti AG (2005) Long-term cardiovascular outcomes in men with obstructive sleep apnoea-hypopnoea with or without treatment with continuous positive airway pressure: an observational study. Lancet 365: 1046-1053. [Crossref]
- McKeon JL, Saunders NA, Murree-Allen K, Olson LG, Gyulay S, et al. (1990) Urinary uric acid:creatinine ratio, serum erythropoietin, and blood 2,3-diphosphoglycerate in patients with obstructive sleep apnea. Am Rev Respir Dis 142: 8-13. [Crossref]
- Ip MS, Lam KS, Ho C, Tsang KW, Lam W (2000) Serum leptin and vascular risk factors in obstructive sleep apnea. Chest 118: 580-586. [Crossref]
- Moe GW (2006) B-type natriuretic peptide in heart failure. Curr Opin Cardiol 21: 208-214. [Crossref]
- Niroumand M, Kuperstein R, Sasson Z, Hanly PJ (2001) Impact of obstructive sleep apnea on left ventricular mass and diastolic function. Am J Respir Crit Care Med 163: 1632-1636. [Crossref]
- Peker Y, Hedner J, Norum J, Kraiczi H, Carlson J (2002) Increased incidence of cardiovascular disease in middle-aged men with obstructive sleep apnea: a 7-year follow-up. Am J Respir Crit Care Med 166: 159-165. [Crossref]
- Peker Y, Hedner J, Kraiczi H, Löth S (2000) Respiratory disturbance index: an independent predictor of mortality in coronary artery disease. Am J Respir Crit Care Med 162: 81-86. [Crossref]
- Phillips BG, Kato M, Narkiewicz K, Choe I, Somers VK (2000) Increases in leptin levels, sympathetic drive, and weight gain in obstructive sleep apnea. Am J Physiol Heart Circ Physiol 279(1): H264-H237. [Crossref]
- Rudski L (2010) Guidelines for the echocardiographic assessment of the right heart in adults: A report from the american society of echocardiography endorsed by the european association of echocardiography, a registered branch of the european society of cardiology. J Am Soc Echocardiogr 23(7): 685-713. [Crossref]
- Sahebjani H (1998) Changes in urinary uric acid excretion in obstructive sleep apnea before and after therapy with nasal continuous positive airway pressure. Chest 113: 1604-1608. [Crossref]
- Saito H, Nishimura M, Shibuya E, Makita H, Tsujino I, et al. (2002) Tissue hypoxia in sleep apnea syndrome assessed by uric acid and adenosine. Chest 122: 1686-1694. [Crossref]
- Sanner BM, Kollhosser P, Buechner N, Zidek W, Tepel M (2004) Influence of treatment on leptin levels in patients with obstructive sleep apnoea. Eur Respir J 23: 601-604. [Crossref]
- Schäfer H, Pauleit D, Sudhop T, Gouni-Berthold I, Ewig S, et al. (2002) Body fat distribution, serum leptin, and cardiovascular risk factors in men with obstructive sleep apnea. Chest 122: 829-839. [Crossref]
- Lavie P, Herer P, Peled R, Berger I, Yoffe N, et al. (1995) Mortality in sleep apnea patients: a multivariate analysis of risk factors. Sleep 18: 149-157. [Crossref]
- Minoguchi K, Yokoe T, Tazaki T, Minoguchi H, Tanaka A, et al. (2005) Increased carotid intima-media thickness and serum inflammatory markers in obstructive sleep apnea. Am J Respir Crit Care Med 172: 625-630. [Crossref]
- Shamsuzzaman AS, Winnicki M, Lanfranchi P, Wolk R, Kara T, et al. (2002) Elevated C-reactive protein in patients with obstructive sleep apnea. Circulation 105: 2462-2464. [Crossref]
- Shimizu K, Chin K, Nakamura T, Masuzaki H, Ogawa Y, et al. (2002) Plasma leptin levels and cardiac sympathetic function in patients with obstructive sleep apnoea-hypopnoea syndrome. Thorax 57: 429-434. [Crossref]
- Shiomi T, Guilleminault C, Stoohs R, Schnittger I (1991) Leftward shift of the interventricular septum and pulsus paradoxus in obstructive sleep apnea syndrome. Chest 100: 894-902. [Crossref]
- Shivalkar B, Van de Heyning C, Kerremans M, Rinkevich D, Verbraecken J, et al. (2006) Obstructive sleep apnea syndrome: more insights on structural and functional cardiac alterations, and the effects of treatment with continuous positive airway pressure. J Am Coll Cardiol 47: 1433-1439. [Crossref]
- Verhulst SL, Van Hoeck K, Schrauwen N, Haentjens D, Rooman R, et al. (2007) Sleep-disordered breathing and uric acid in overweight and obese children and adolescents. Chest 132: 76-80. [Crossref]
- Tugcu A, Guzel D, Yildirimturk O, Aytekin S (2010) Evaluation of subclinical right ventricular dysfunction in obstructive sleep apnea patients using velocity vector imaging. Circulation 74: 312-319. [Crossref]
- Craig S, Kylintireas I, Kohler M, Nicoll D, Bratton DJ, et al. (2015) Effect of CPAP on Cardiac Function in Minimally Symptomatic Patients with OSA: Results from a Subset of the MOSAIC Randomized Trial. J Clin Sleep Med 11: 967-973. [Crossref]
- Vitarelli A, Terzano C, Saponara M, Gaudio C, Mangieri E, et al. (2015) Assessment of Right Ventricular Function in Obstructive Sleep Apnea Syndrome and Effects of Continuous Positive Airway Pressure Therapy: A Pilot Study. Can J Cardiol 31: 823-831. [Crossref]
- McNicholas WT (2007) Cardiovascular outcomes of CPAP therapy in obstructive sleep apnea syndrome. Am J Physiol-Regul, Inte Comparative Physiol 293: R1666-R1670.
- Söderberg S, Olsson T, Eliasson M, Johnson O, Ahrén B (1999) Plasma leptin levels are associated with abnormal fibrinolysis in men and postmenopausal women. J Intern Med 245: 533-543. [Crossref]
- Steiropoulos P, Kotsianidis I, Nena E, Tsara V, Gounari E, et al. (2009) Long-term effect of continuous positive airway pressure therapy on inflammation markers of patients with obstructive sleep apnea syndrome. Sleep 32: 537-543. [Crossref]
- Stoohs R1, Guilleminault C (1992) Cardiovascular changes associated with obstructive sleep apnea syndrome. J Appl Physiol (1985) 72: 583-589. [Crossref]
- Tatsumi K1, Kasahara Y, Kurosu K, Tanabe N, Takiguchi Y, et al. (2005) Sleep oxygen desaturation and circulating leptin in obstructive sleep apnea-hypopnea syndrome. Chest 127: 716-721. [Crossref]
- Kasai T, Bradley TD (2011) Obstructive sleep apnea and heart failure: pathophysiologic and therapeutic implications. J Am Coll Cardiol 57: 119-127. [Crossref]
- Tavil Y, Kanbay A, Sen N. (2007) Comparison of right ventricular functions by tissue doppler imaging in patients with obstructive sleep apnea syndrome with or without hypertension. Int J Cardiovasc Imaging 23: 312-319. [Crossref]
- Tugcu A, Guzel D, Yildirimturk O, Aytekin S (2010) Evaluation of subclinical right ventricular dysfunction in obstructive sleep apnea patients using velocity vector imaging. Circulation 74: 312-319. [Crossref]
- Usui Y, Tomiyama H, Hasimoto H (2008) Plasma B-bype natriuretic peptide level is associated with left ventricular hypertrophy among obstructive sleep apnoea patients. J Hypertens 26: 117-123. [Crossref]
- Varol E, Akcay S, Ozaydin M, Ozturk O, Cerci SS, et al. (2010) Influence of obstructive sleep apnea on left ventricular mass and global function: sleep apnea and myocardial performance index. Heart Vessels 25: 400-404. [Crossref]
- Vartany E, Imevbore M, O'Malley M, Manfredi C, Pasquarella C, et al. (2006) N-terminal pro-brain natriuretic peptide for detection of cardiovascular stress in patients with obstructive sleep apnea syndrome. J Sleep Res 15: 424-429. [Crossref]
- Vitarelli A, Terzano C, Saponara M, Gaudio C, Mangieri E, et al. (2015) Assessment of Right Ventricular Function in Obstructive Sleep Apnea Syndrome and Effects of Continuous Positive Airway Pressure Therapy: A Pilot Study. Can J Cardiol 31: 823-831. [Crossref]
- Wang H, Parker JD, Newton GE, Floras JS, Mak S, et al. (2007) Influence of obstructive sleep apnea on mortality in patients with heart failure. J Am Coll Cardiol 49: 1625-1631. [Crossref]
- Young T, Finn L, Peppard PE, Szklo-Coxe M, Austin D, et al. (2008) Sleep disordered breathing and mortality: eighteen-year follow-up of the Wisconsin sleep cohort. Sleep 31: 1071-1078. [Crossref]
- Dursunoğlu N, Dursunoğlu D, Kilià M (2005) Impact of obstructive sleep apnea on right ventricular global function: sleep apnea and myocardial performance index. Respiration 72: 278-284. [Crossref]