Artificial sweeteners are commonplace in foods and beverages; perhaps most notably in diet sodas. Some epidemiology data indicate a higher rate of insulin resistance in those who regularly consume artificially-sweetened sodas, possibly due to an insulinogenic response to beverage consumption, despite the lack of calories. The possibility of an acute insulin spike with artificial sweetener consumption is a common topic of discussion in the lay press but scientific evidence is lacking. We compared the glucose and insulin response to acute ingestion of two different artificially sweetened sodas (containing sucralose or aspartame), compared to “regular” sugar-sweetened soda, and carbonated water in 12 healthy men. Blood samples collected before and at 30, 60, 90, and 120 minutes following ingestion of the beverages were analyzed for glucose and insulin. Both glucose (30 min) and insulin (30 and 60 min) were elevated significantly above baseline following intake of the regular soda; however, values remained very stable for all other conditions across time (p>0.05).Artificially sweetened sodas containing sucralose or aspartame do not result in any acute elevation in blood sugar or insulin following a 20 ounce load. There is no reason to suspect that a higher consumption would result in an elevation in these measures. Any noted insulin resistance linked to high intake of artificial sweeteners is likely a function of the excess calories and processed ingredients often included within artificially-sweetened food and beverage products.
Keywords
sucralose, aspartame, sugar, insulin, glucose
Introduction
While sugar-sweetened beverage consumption has fallen somewhat in recent years [1], it remains relatively high [2-4]. During this time, we have seen the rise in the use of artificial, no-calorie sweeteners such as aspartame and sucralose (Splenda®) within beverages, due in part to consumer interest in reducing the caloric load. The overarching thought is that by reducing sugar and calorie intake, body weight/body fat can be reduced, while accompanying health benefits such as a reduction in the risk of type II diabetes and cardiovascular disease can be realized [5,6]. While it is difficult to argue the point that calorie load is reduced when switching from sugar-sweetened soda to artificially-sweetened soda, other issues have been raised related to consumption of the latter.
Aside from concerns related to cancer risk [7-9] and associated problems [10-13], some epidemiology studies suggest that long-term intake of the artificially-sweetened beverages may prove detrimental to metabolic health. For example, Fagherazzi and colleagues noted an increased risk of type II diabetes with intake of artificially-sweetened beverages[14]. In opposition to these findings, others have noted that any associated type II diabetes risk is due mostly to lifestyle factors and not necessarily to the ingestion of artificially-sweetened beverages[15]. The mixed results, coupled with increased consumer interest in the consumption of artificially-sweetened beverages, warrant further investigation.
The possibility that high quantities of the artificially-sweetened drinks may induce an insulin spike is a topic of regular discussion in the lay press, perhaps partly fueled by a 2013 study performed by Jenkins and colleagues. In this work, which was presented in abstract form at FASEB, investigators compared the glucose and insulin response to two artificial sweeteners (sucralose and etythritol) during a 120-minute postprandial period. The authors noted a slight increase in both serum glucose and insulin with sucralose ingestion, despite no calories being consumed (unpublished findings). The present study was designed to extend the work of Jenkins et al. and to compare the effects of artificially- and sugar-sweetened soda consumption on blood glucose and insulin in non-diabetic men.
Materials and Methods
Subjects and screening
Twelve healthy men were enrolled in this study and completed all aspects of this work. Prior to participation, subjects completed a health history and physical activity questionnaire. Subjects were non-smokers and did not have a history of cardiovascular or metabolic disease (including diabetes). Subjects were not using cardiovascular or metabolic drugs of any kind. Subjects’ height and weight was measured, and circumference measures taken. Subjects did not have phenylketonuria, as the conditions used in the study may have contained the amino acid phenylalanine. Resting heart rate and blood pressure were measured. Descriptive characteristics of subjects are presented in Table 1. The study protocol was approved by The University of Memphis Institutional Review Board for Human Subjects Research and subjects provided written informed consent prior to participating.
Table 1. Characteristics of 11 healthy men
Variable |
Data |
Age (yrs) |
26.8 ± 2.2 |
Height (cm) |
182.4 ± 1.4 |
Weight (kg) |
90.1 ± 2.5 |
BMI (kg∙m-2) |
27.1 ± 0.8 |
Waist (cm) |
86.5 ± 1.6 |
Hip (cm) |
105.0 ± 1.4 |
Waist:Hip |
0.8 ± 0.0 |
Resting heart rate (bpm) |
69.1 ± 4.1 |
Resting systolic blood pressure (mmHg) |
126.1 ± 2.8 |
Resting diastolic blood pressure (mmHg) |
77.3 ± 2.3 |
Years anaerobic exercise training |
10.4 ± 3.0 |
Hours per week anaerobic exercise |
3.7 ± 0.4 |
Years aerobic exercise training |
10.8 ± 2.5 |
Hours per week aerobic exercise |
1.7 ± 0.3 |
Data are mean ± SEM |
Independent variable
Subjects were randomly assigned in double-blind manner using a crossover design to one of four conditions. Subjects reported to the lab on four different days (separated by approximately 1 week) and received one of the following conditions on each day. Subjects were provided 20 ounces of the beverage and allowed up to 10 minutes to consume the entire amount; although most subjects consumed the beverage in less than five minutes.
- Carbonated water (which was colored orange using food coloring to match the color of the soda)
- Diet soda (Diet Rite; splenda/sucralose sweetened; 0 calories)
- Diet soda (Sunkist; aspartame sweetened; 0 calories)
- Regular soda (Sunkist; high fructose corn syrup and sugar sweetened; 285 calories)
Aspartame was chosen as one of the artificial sweeteners due to its ubiquitous use in diet sodas. Sucralose was chosen as the second artificial sweetener, as this is gaining popularity and is now available in select diet sodas, as well as other diet beverages. Each of the above beverages was provided at 20 ounces in “orange” flavor and poured into a cup by a research assistant. The volume provided a sugar content (for the regular soda; 70 grams) similar to a typical oral glucose tolerance test. No other food or beverages were allowed during the two-hour study period.
Test visit procedures
Subjects reported to the lab a total of four times during the morning hours. Testing begin at approximately 6:00-7:00 am. Subjects reported in an overnight fasted state, without having consumed alcohol or caffeine within the past 24 hours. Subjects were instructed to obtain at least seven hours of sleep during the night prior to testing. Subjects should not have performed strenuous physical exercise within the past 24 hours.
Upon arrival at each visit, subjects rested quietly for 20 minutes and then had a baseline blood sample collected. Then they received their assigned beverage and consumed the entire 20 ounces. They rested quietly for the next two hours and had additional blood samples taken at 30, 60, 90, and 120 minutes (the clock began when they initiated consumption of the beverage). Blood pressure and heart rate were measured at the times above using an automated unit. Subjects rated their overall appetite using a numeric (0 [no appetite at all] -10 [extreme appetite]) scale at each collection time, as some evidence suggests that artificial sweeteners may blunt appetite. Subjects relaxed in the lab and watched TV, used the computer, listened to music, or read during the time period.
Blood collection
Blood was collected from subjects’ forearm vein using a needle and Vacutainer containing no additive. Approximately 7 mL of blood was collected at each time (pre, 30 min, 60 min, 90 min, 120 min post beverage ingestion). The collected samples were allowed to clot for 30 minutes at room temperature and then processed in a refrigerated centrifuge to obtain serum. The serum was stored in multiple aliquots at -70 degrees Celsius until analyzed for glucose and insulin within two months of collection. Glucose was determined using standard enzymatic procedures as described by the reagent manufacturer (Thermo Fisher Scientific; Waltham, MA). Insulin was determined using a solid phase enzyme linked immunosorbent assay (ELISA) kit following the instructions of the manufacturer (Calbiotech; Spring Valley, CA). All assays were performed in duplicate on first thaw. The coefficient of variation for the glucose and insulin assays was 8.1% and 5.4%, respectively.
Dietary intake and records
All subjects were instructed to consume their usual diet throughout the study period and to record all food and drink consumed during the 24 hours prior to each test day. During the day prior to test days 2, 3, and 4 subjects were instructed to replicate the intake they reported during the day prior to test day 1. Hence, dietary intake should have been very similar during the days prior to each test day. Diet records were analyzed for nutrient intake using Food Processor Pro (ESHA Research, Salem, OR) computer software.
Statistical analysis
Data were analyzed using a (4) condition x (5) time repeated measures analysis of variance. Post hoc testing was performed as necessary. Data are presented as mean ± standard error of the mean. All analyses were performed using JMP statistical software (version 4.0.3, SAS Institute, Cary, NC). Statistical significance was set at P ≤ 0.05.
Results
All subjects successfully completed all four test sessions. However, following analysis of blood samples, one subject’s data were removed from the analysis due to invalid measures. It was suspected that the subject ate prior to reporting to the lab and this caused his baseline values for glucose and insulin to be elevated. Hence, only data for 11 subjects are included in the results.
Regarding dietary data, no differences were noted between conditions for any measured variable (p>0.05; Table 2). Regarding heart rate, no effects were observed (p>0.05). For systolic blood pressure, a condition effect was noted (p=0.006), with regular soda higher than club soda. For diastolic blood pressure, a condition effect was noted (p=0.0004), with regular and aspartame sweetened soda higher than club and sucralose sweetened soda). A time effect was also noted for diastolic blood pressure (p=0.01), with values at 30 min and 120 min higher than baseline (0 min). A time effect was also noted for appetite (p<0.0001), with values at 120 min higher than values at 0, 30, and 60 min. Data are presented in Table 3.
Table 2. Dietary data of healthy men during the 24-hour period before each test day
Variable |
Club |
Regular |
Aspartame |
Sucralose |
Kilocalories |
2820.3 ± 377.8 |
2852.1 ± 353.8 |
2850.5 ± 223.5 |
2726.6 ± 265.9 |
Protein (g) |
136.3 ± 18.6 |
144.4 ± 14.6 |
133.5 ± 12.5 |
143.5 ± 13.5 |
Carbohydrate (g) |
292.3 ± 44.9 |
306.3 ± 34.3 |
296.1 ± 24.8 |
279.8 ± 33.8 |
Fiber (g) |
27.0 ± 5.5 |
28.0 ± 5.2 |
30.7 ± 5.4 |
25.4 ± 5.7 |
Sugar (g) |
90.4 ± 18.1 |
91.6 ± 16.0 |
86.9 ± 13.3 |
108.8 ± 18.9 |
Fat (g) |
120.0 ± 22.6 |
117.1 ± 22.9 |
125.6 ± 15.7 |
115.4 ± 18.9 |
Vitamin C (mg) |
58.3 ± 19.8 |
125.2 ± 79.5 |
58.1 ± 23.3 |
86.0 ± 46.1 |
Vitamin E (mg) |
5.8 ± 2.2 |
6.8 ± 2.5 |
8.5 ± 2.7 |
5.3 ± 1.5 |
Vitamin A (RE) |
602.7 ± 200.9 |
658.0 ± 169.0 |
666.1 ± 214.8 |
779.9 ± 267.5 |
Data are mean ± SEM. No statistically significant differences noted for any variable (p>0.05) |
Table 3. Heart rate, blood pressure, and appetite in healthy men before and following ingestion of four different beverages
|
Pre |
30 min |
60 min |
90 min |
120 min |
HR
Club |
60.6 ± 2.9 |
55.2 ± 3.4 |
55.5 ± 3.0 |
56.8 ± 3.3 |
55.5 ± 3.6 |
HR
Regular |
61.8 ± 3.8 |
56.0 ± 3.0 |
60.3 ± 3.9 |
61.1 ± 3.0 |
59.0 ± 3.4 |
HR
Aspartame |
61.9 ± 3.5 |
56.4 ± 3.0 |
57.3 ± 3.1 |
56.8 ± 2.5 |
56.7 ± 3.1 |
HR
Sucralose |
64.5 ± 4.3 |
57.3 ± 3.5 |
58.5 ± 3.6 |
56.4 ± 3.0 |
57.6 ± 2.8 |
SBP*
Club |
113.5 ± 3.6 |
119.7 ± 1.1 |
117.6 ± 2.3 |
116.8 ± 1.5 |
121.4 ± 2.0 |
SBP
Regular |
121.7 ± 3.8 |
123.8 ± 3.0 |
124.5 ± 3.9 |
124.1 ± 3.0 |
126.1 ± 3.4 |
SBP
Aspartame |
116.7 ± 3.1 |
124.3 ± 3.8 |
124.3 ± 1.9 |
121.3 ± 3.1 |
122.6 ± 2.0 |
SBP
Sucralose |
64.5 ± 4.0 |
57.3 ± 3.6 |
58.5 ± 3.8 |
56.4 ± 3.6 |
57.6 ± 2.8 |
DBP* **
Club |
70.7 ± 2.9 |
78.1 ± 2.2 |
73.5 ± 2.4 |
75.0 ± 2.0 |
75.9 ± 2.5 |
DBP
Regular |
75.1 ± 2.7
|
77.5 ± 2.5 |
76.9 ± 2.1 |
77.9 ± 3.7 |
81.2 ± 3.7 |
DBP
Aspartame |
74.9 ± 2.3 |
78.8 ± 1.7 |
79.4 ± 2.1 |
78.3 ± 2.1 |
78.5 ± 2.8 |
DBP
Sucralose |
70.5 ± 1.9 |
76.2 ± 1.6 |
72.6 ± 2.1 |
72.0 ± 2.3 |
75.0 ± 1.6 |
Appetite**
Club |
5.4 ± 0.9 |
5.4 ± 0.9 |
6.6 ± 0.7 |
7.4 ± 0.7 |
7.9 ± 0.6 |
Appetite
Regular |
5.1 ± 0.8 |
5.2 ± 0.7 |
5.6 ± 0.7 |
6.2 ± 0.8 |
7.0 ± 0.7 |
Appetite
Aspartame |
5.7 ± 0.7 |
5.6 ± 0.8 |
6.4 ± 0.7 |
6.8 ± 0.7 |
7.8 ± 0.5 |
Appetite
Sucralose |
6.0 ± 0.6 |
5.8 ± 0.6 |
6.3 ± 0.6 |
7.2 ± 0.5 |
8.0 ± 0.4 |
Data are mean ± SEM.
Heart Rate: No effects noted (p>0.05)
Systolic Blood Pressure: *Condition (p=0.006)
Diastolic Blood Pressure: *Condition (p=0.0004); **Time (p=0.01)
Appetite: **Time (p<0.0001) |
For serum glucose, both an interaction effect (p<0.0001) and a time effect (p<0.0001) were noted, with values increasing at 30 min post ingestion for the regular soda only. The condition effect failed to reach significance (p=0.07). Data for glucose are provided in Figure 1. For serum insulin, both an interaction effect (p<0.0001) and a time effect (p<0.0001) were noted, with values increasing at 30 min and 60 post ingestion for the regular soda only. The condition effect was also of significance (p<0.0001), with values higher for regular soda compared to all others. Data for insulin are provided in Figure 2.
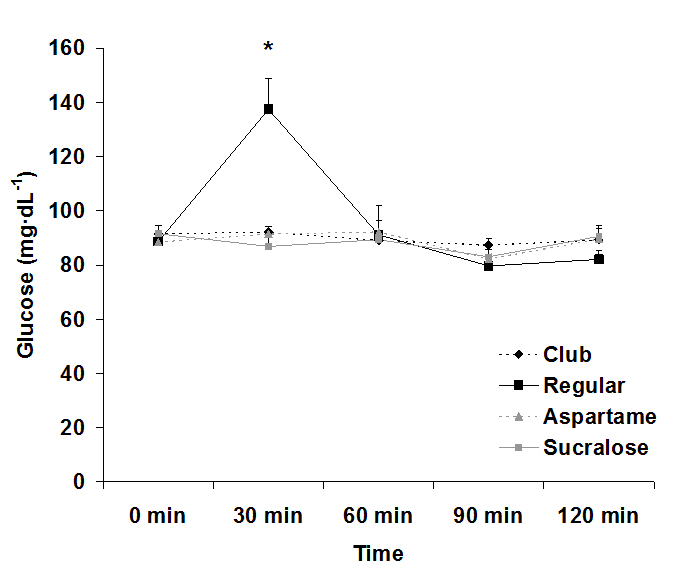
Figure 1. Serum glucose before and following ingestion of four different beverages.
Data are mean ± SEM. Condition: p=0.07, Time: p<0.0001, Condition x Time: p<0.0001
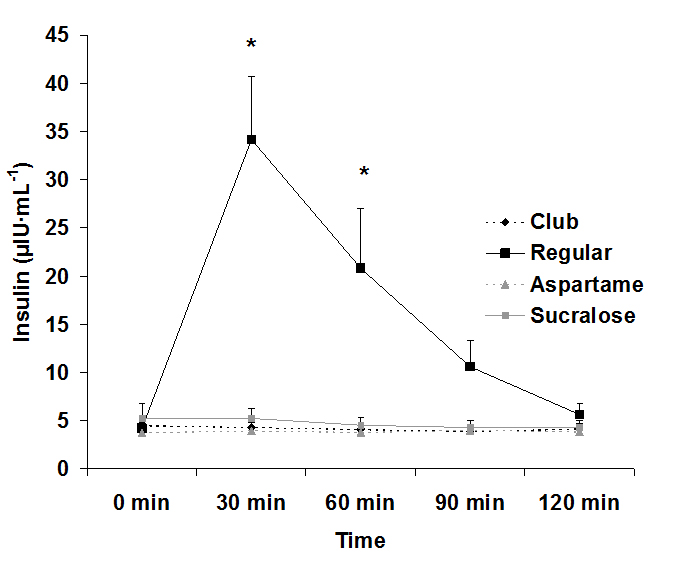
Figure 2. Serum insulin before and following ingestion of four different beverages, Data are mean ± SEM, Condition: p<0.0001, Time: p<0.0001, Condition x Time: p<0.0001
Discussion
Data from the present study confirm two items of importance: First, ingestion of a sugar-rich beverage results in a massive rise in insulin that can persist for approximately 60-90 minutes following consumption. Second, consumption of 20 ounces of artificially-sweetened sodas containing sucralose or aspartame does not result in any acute elevation in blood sugar or insulin during a two-hour postprandial period. Based on these findings, there is no reason to believe that ingestion of artificially-sweetened beverages is responsible for promoting insulin resistance over time. Any such change in insulin sensitivity linked to high intake of artificial sweeteners is likely a function of the excess calories and processed ingredients often included within artificially-sweetened food products.
The rise in glucose and insulin levels after consuming regular, sugar-sweetened soda was expected and agrees with prior studies involving ingestion of glucose loads[16]. These sugar-sweetened sodas contain large amounts of quickly absorbable “simple” carbohydrates and are typically ingested in large quantities in relatively short period of time[17]. These factors are concomitant with increased blood glucose levels[17], which result in increased secretion of insulin. Insulin lowers blood glucose by increasing glucose uptake into skeletal muscle and fat, while also decreasing glucose production by the liver[18]. However, frequent and prolonged spikes in glucose and insulin can be detrimental to metabolic health-which may be the case if consumers are ingesting these sugar-sweetened sodas frequently throughout the day.
Intermittent spikes in blood glucose appear more detrimental than chronically stable high glucose levels[19-22]. These fluctuations cause increased oxidative stress and apoptosis of various cells, particularly pancreatic islet β-cells[19-23]. β-cells produce and secrete insulin in response to elevated glucose levels and repeated fluctuations of glucose can lead to β-cells dysfunction and apoptosis[22,23].Altered and inhibited β-cells fail to regulate the excess blood glucose, ultimately leading to hyperglycemia and hyperinsulinemia[24-26]. Thus, β-cell dysfunction becomes one of the main mechanisms for an individual to develop Type II diabetes[24].
Disruptions in glucose and insulin levels also affect other metabolic pathways, specifically fatty acid mobilization. Hormone sensitive lipase (HSL) plays a major role in the mobilization of stored fatty acids and overall energy homeostasis[27,28]. In a postprandial state, however, elevated insulin prevents the activation of HSL, therefore disrupting the mobilization of fatty acids from triglyceride stores[29]. This may negatively impact the ability to use fats as a fuel source in an attempt to decrease body fat. HSL is also expressed in β-cells, which coupled with the complications β-cells experience due to fluctuations of high glucose levels, could also lead to decreased insulin sensitivity. Our findings demonstrate that ingestion of regular sugar-sweetened soda leads to elevated insulin for a period of up to 90 minutes post ingestion. Considering that individuals may consume regular soda frequently throughout the day, this practice may prove highly problematic to metabolic health if maintained over time.
Our study demonstrates clearly that from a metabolic standpoint, artificially-sweetened soda is a better choice than regular sugar-sweetened soda. Both glucose and insulin were essentially unaffected by intake of the artificially-sweetened soda, confirming that consumption of these beverages should not be of concern with regards to metabolic health or the development of insulin resistance. Therefore, individuals who are looking for a better alternative to regular sugar-sweetened soda may consider soda that is sweetened with either aspartame or sucralose. Even when consumed at a volume of 20 ounces, there is no increase in blood glucose and ensuing insulin. Moreover, based on our findings, there appears no reason to believe that a higher volume of artificially-sweetened soda would lead to elevated glucose or insulin. Our findings are in reference to young, healthy men. Future study is needed to extend these findings to women and to those who may be metabolically compromised, in order to determine if similar findings are observed.
Competing interests
No external funding was available for this study. The authors declare no competing interests.
Authors’ contributions
2021 Copyright OAT. All rights reserv
RJB was responsible for the study design, biochemical work, statistical analyses, and manuscript preparation. SAP, RGM, and JJM were responsible for subject recruitment, data collection, blood collection and processing, data entry, and assistance with manuscript preparation. All authors read and approved of the final manuscript.
Acknowledgments
Funding for this work was provided by The University of Memphis.
References
- Kit BK, Fakhouri TH, Park S, Nielsen SJ, Ogden CL (2013) Trends in sugar-sweetened beverage consumption among youth and adults in the United States: 1999-2010. Am J Clin Nutr 98: 180-188. [Crossref]
- Bleich SN, Wang YC, Wang Y, Gortmaker SL (2009) Increasing consumption of sugar-sweetened beverages among US adults: 1988-1994 to 1999-2004. Am J Clin Nutr 89: 372-381. [Crossref]
- Han E, Powell LM (2013) Consumption patterns of sugar-sweetened beverages in the United States. J Acad Nutr Diet 113: 43-53. [Crossref]
- Kumar GS, Pan L, Park S, Lee-Kwan SH, Onufrak S, et al. (2014) Sugar-sweetened beverage consumption among adults -- 18 states, 2012. MMWR Morb Mortal Wkly Rep 63: 686-690. [Crossref]
- Bray GA, Popkin BM (2014) Dietary sugar and body weight: have we reached a crisis in the epidemic of obesity and diabetes?: health be damned! Pour on the sugar. Diabetes Care 37: 950-956. [Crossref]
- Hu F (2013) Resolved: There is sufficient scientific evidence that decreasing sugar-sweetened beverage consumption will reduce the prevalence of obesity and obesity-related diseases. Obesity Reviews 14: 606-619.
- Schernhammer ES, Bertrand KA, Birmann BM, Sampson L, Willett WC, et al. (2012) Consumption of artificial sweetener- and sugar-containing soda and risk of lymphoma and leukemia in men and women. Am J Clin Nutr 96: 1419-1428. [Crossref]
- Soffritti M, Belpoggi F, Esposti DD, Lambertini L, Tibaldi E, et al. (2006) First experimental demonstration of the multipotential carcinogenic effects of aspartame administered in the feed to sprague-dawley rats. Environ Health Perspect 379-385.
- Soffritti M, Belpoggi F, Tibaldi E, Esposti DD, Lauriola M (2007) Life-span exposure to low doses of aspartame beginning during prenatal life increases cancer effects in rats. Environ Health Perspect 115: 1293-1297. [Crossref]
- Nettleton JA, Lutsey PL, Wang Y, Lima JA, Michos ED, et al. (2009) Diet soda intake and risk of incident metabolic syndrome and type 2 diabetes in the Multi-Ethnic Study of Atherosclerosis (MESA). Diabetes Care 32: 688-694. [Crossref]
- Jacob SE, Stechschulte S (2008) Formaldehyde, aspartame, and migraines: a possible connection. Dermatitis 19: E10-11. [Crossref]
- Newman LC, Lipton RB (2001) Migraine MLT-down: an unusual presentation of migraine in patients with aspartame-triggered headaches. Headache 41: 899-901. [Crossref]
- Halldorsson TI, Strøm M, Petersen SB, Olsen SF (2010) Intake of artificially sweetened soft drinks and risk of preterm delivery: a prospective cohort study in 59,334 Danish pregnant women. Am J Clin Nutr 92: 626-633. [Crossref]
- Fagherazzi G, Vilier A, Saes Sartorelli D, Lajous M, Balkau B, et al. (2013) Consumption of artificially and sugar-sweetened beverages and incident type 2 diabetes in the etude epidemiologique aupres des femmes de la mutuelle generale de l'education nationale-european prospective investigation into cancer and nutrition cohort. Am J Clin Nutr 97: 517-523.
- de Koning L, Malik VS, Rimm EB, Willett WC, Hu FB (2011) Sugar-sweetened and artificially sweetened beverage consumption and risk of type 2 diabetes in men. Am J Clin Nutr 93: 1321-1327. [Crossref]
- Harrington S (2008) The role of sugar-sweetened beverage consumption in adolescent obesity: a review of the literature. J Sch Nurs 24: 3-12. [Crossref]
- Schulze MB, Liu S, Rimm EB, Manson JE, Willett WC, et al. (2004) Glycemic index, glycemic load, and dietary fiber intake and incidence of type 2 diabetes in younger and middle-aged women. Am J Clin Nutr 80: 348-356. [Crossref]
- Kahn BB, Flier JS (2000) Obesity and insulin resistance. J Clin Invest 106: 473-481. [Crossref]
- Ceriello A, Esposito K, Piconi L, Ihnat MA, Thorpe JE, et al. (2008) Oscillating glucose is more deleterious to endothelial function and oxidative stress than mean glucose in normal and type 2 diabetic patients. Diabetes 57: 1349-1354. [Crossref]
- Del Guerra S, Grupillo M, Masini M, Lupi R, Bugliani M, et al. (2007) Gliclazide protects human islet beta-cells from apoptosis induced by intermittent high glucose. Diabetes Metab Res Rev 23: 234-238. [Crossref]
- Monnier L, Mas E, Ginet C, Michel F, Villon L, et al. (2006) Activation of oxidative stress by acute glucose fluctuations compared with sustained chronic hyperglycemia in patients with type 2 diabetes. JAMA 295: 1681-1687. [Crossref]
- Shi XL, Ren YZ, Wu J (2011) Intermittent high glucose enhances apoptosis in INS-1 cells. Exp Diabetes Res 2011: 754673. [Crossref]
- Miyazaki Y, Kawano H, Yoshida T, Miyamoto S, Hokamaki J, et al. (2007) Pancreatic B-cell function is altered by oxidative stress induced by acute hyperglycaemia. Diabet Med 24: 154-160. [Crossref]
- Prentki M, Nolan CJ (2006) Islet beta cell failure in type 2 diabetes. J Clin Invest 116: 1802-1812. [Crossref]
- Kahn SE, Hull RL, Utzschneider KM (2006) Mechanisms linking obesity to insulin resistance and type 2 diabetes. Nature 444: 840-846. [Crossref]
- Holm C, Kirchgessner TG, Svenson KL, Fredrikson G, Nilsson S, et al. (1988) Hormone-sensitive lipase: sequence, expression, and chromosomal localization to 19 cent-q13.3. Science 241: 1503-1506. [Crossref]
- Jocken J, Langin D, Smit E (2007) Adipose triglyceride lipase and hormone-sensitive lipase protein expression is decreased in the obese insulin-resistant state. J Clin Endocrinol Metab. 92: 2292-2299.
- Mulder H, Sorhede-Winzell M, Contreras JA (2003) Hormone-sensitive lipase null mice exhibit signs of impaired insulin sensitivity whereas insulin secretion is intact. J Biol Chem. 278: 36380-36388.
- Tuomilehto J, Lindström J, Eriksson JG, Valle TT, Hämäläinen H, et al. (2001) Prevention of type 2 diabetes mellitus by changes in lifestyle among subjects with impaired glucose tolerance. N Engl J Med 344: 1343-1350. [Crossref]