Abstract
Gene-expression testing data of a new dipeptide, N-Decanoyl-L-glutaminyl-L-glutamine amide (DGGA) are presented, which indicate its application as a topical anti-senescence agent to treat skin aging.
Key words
peptide, antiaging, cellular senescence, skin aging, rosacea, acne, wrinkles
Introduction
Preventing skin aging by targeting multiple causes by a single bullet is of primal scientific and consumer interest. Treatments based on cellular anti-senescence now offer this single solution to multiple skin ailments including skin aging!
Senescence is the change in the biology of an organism as it ages after its maturity, which range from those affecting its cells and their function to that of the whole organism. Senescence is not universal, and senescence is not observed in single-celled organisms that reproduce through the process of cellular mitosis. Cellular senescence in humans causes the cells to stop replicating themselves through the process of mitosis, thus resulting in cellular degradation over a period of time. Cells are the fundamental structure composing our bodies, and cellular decline thus contributes to the aging process.
Water is a key element for life. However, some organisms have evolved an amazing adaptation that allows them to survive under complete dehydration conditions (anhydrobiosis) for prolonged periods of time, until water is present again, at which time they resume their metabolism and growth.
Cells must maintain an optimal balance of water to stay plump and healthy. Imagine a face drawn on a balloon and filled with water. The face will look plump and youthful as the water keeps pressure on the balloon’s inside surface. But if the water were to slowly leak (osmosis) out of the balloon, the drawn face would increasingly look wrinkled, tired, saggy, and aged.
Hyper-osmolarity has been shown to induce inflammation. The link between hyperosmolarity and inflammation has been established by assessing osmolarity values in vivo during inflammation and compared the inflammatory potential of different osmotic agents and studied the long-term consequences of hyperosmolarity on cell fate. The exposure of cells to the different compounds, whatever their molecular weight, has no effect on the secretion of cytokines as long as the osmolarity is below a threshold of 300 mOsm. Higher osmolarities result in the secretion of pro-inflammatory cytokines (Interleukin-8, Interleukin-6, Interleukin-1beta and Tumor Necrosis factor-alpha) [1].
It has been reported that hyperosmolarity can induce pro-inflammatory cytokine responses. Inflammation appears to be the simple consequence of a shift of methylation of Protein Phosphatase 2A, which in turn activates Nuclear factor-kappa B (NF-kappaB). The production of inflammatory cytokines causes the acceleration of aging process [2].
The agents that are known to provide osmoprotection in non-mammalian organisms and plants include trehalose, maltose, sucrose, palatinose, cellobiose, gentiobiose, turanose, sorbitol, calcium chloride, certain amino acids (such as proline and alpha-glutamate), alpha-D-mannopyranosyl-(1→2)-alpha-D-glucopyranosyl-(1→2)-glycerate, Di-myo-inositol 1,1'-phosphate, N(gamma)-acetyl-2,4-diaminobutyrate, ectoine, glycine betaine, carnitine, pipecolic acid, dimethylsulfoniopropionate, dimethylsulfonioacetate, peptones, taurine, and taltrimide [3].
Additionally, sucrose, trehalose, maltose, cellobiose, gentiobiose, turanose and palatinose are reported as very unusual osmoprotectants for Sinorhizobium meliloti, because these compounds, unlike other bacterial osmoprotectants, do not accumulate as cytosolic osmolytes in salt-stressed S. meliloti cells. Rather, these compounds were catabolized during early exponential growth, and contributed to enhance the cytosolic levels of the two endogenously synthesized osmolytes: glutamate and the dipeptide N-acetylglutaminylglutamine amide [4].
Recently, the dipeptide N-acetylglutaminylglutamine amide was discovered in the bacterium Sinorhizobium meliloti grown at high osmolarity, and subsequently shown to be synthesized and accumulated by osmotically challenged bacteria. This recent research has suggested that the above metabolite dipeptides may be useful for treating human skin aging [5]. Both glutaminylglutamine amide and N-acetylglutaminylglutamine amide reportedly had poor stability in typical water-based topical formulations.
A new dipeptide derivative of glutaminylglutamine amide, N-Decanoyl-L-glutaminyl-L-glutamine amide (N2-Decanoyl-L-glutaminyl-L-glutamamide; DGGA, Formula I,), has recently been reported as an anti-senescence agent to treat skin aging [6]. Gene-expression testing [7] of this new compound has revealed new potential applications in the topical treatment of skin aging via its efficacy as an osmoprotectant and cellular antisenescence agent (Figure 1).
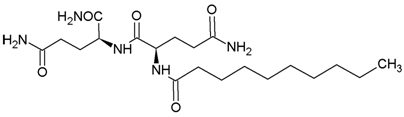
Figure 1. DGGA, Formula I
Materials and methods
A gene-expression testing was performed on DGGA vis-a-vis a control (Genemarkers LLC (2013) to evaluate possible skin beneficial attributes of this novel biomimetic peptide for topical applications.
Study summary
The objective of the study was to understand how a topical material influences gene expression in the skin. The current study was conducted using a full thickness in vitro skin culture model (MatTek, Epiderm EFT-400). 10 pi Test Material (0.1% DGGA dissolved in 100% DMSO) was applied to the surface of each test culture; cultures were returned to the incubator and collected 24 hours post-application. Tissues were collected in RNAlater for gene expression analysis. Gene expression was analyzed using validated Taqman gene expression assays in Taqman Low Density Array (TLDA) format. Analysis was carried out using the Genemarkers Standard Skin Panel, which contains assays for 92 target genes and four endogenous control genes. Each gene was assayed in duplicate.
The standard skin panel test includes comparison of test material to an untreated control group. However, based on previous information obtained by Genemarkers, results are "cleaner" when treatment groups are compared to an appropriate vehicle control group. Genemarkers has historical data regarding the gene expression profile of 100% DMSO. For this study, qPCR data was analyzed in two ways:
1. Treatment group versus untreated control group (included in skin panel test).
2. Treatment group versus historical DMSO control group (provided at no additional charge).
Experimental procedures summary
Dilution of test material: Test material "DGGA" was received at Genemarkers as solid granules. A 100X stock solution was prepared by dissolving 16 mg of test material in 160 [IL DMSO] at 50°C. The 100X stock solution was further diluted with 100% DMSO to create a lx working solution. The 1X working solution was stored at room temperature.
Treatment of cultures: 10 µL of the lx working solution was applied to the center of each EFT-400 culture using a calibrated pipette and spread across the surface using a sterile glass spreader. Each culture was visually inspected to ensure even distribution of test material, Cultures were maintained at 37°C with 5% CO2 and collected after 24 hours.
RNA isolation: RNA was isolated from EFT-400 cultures using a Qiagen RNeasy isolation kit according to manufacturer's instructions for fibrous tissues. RNA concentration and purity were determined using a NanoDrop 2000 spectrophotometer (Thermo Scientific). High quality RNA was isolated from all tissue samples (Table 1).
Gene Identity |
Gene Name |
Fold Change (FC) Values |
Gene Function |
Skin Benefit |
|
|
FC |
Regulation |
|
|
BMP2 |
bone morphogenetic protein 2 |
-3.98 |
Down |
Melanogenesis |
Skin whitening |
SPINK5 |
Serine protease inhibitor Kazal-type 5 |
-3.44 |
Down |
(Excessive) desquamation |
Protection of stratum corneum |
FLG |
Epidermal filaggrin |
-2.49 |
Down |
Aggregates keratin filaments in epidermis |
Ichthyosis, Atopic Dermatitis |
TNF |
Tumor necrosis factor alpha |
-2.19 |
Down |
Inflammatory response
Extracellular matrix breakdown |
Anti-inflammatory |
COL3A1 |
Collagen alpha-1(III) chain |
-2.17 |
Down |
Extracellular matrix |
Collagen fibrils of the dermis |
ELN |
Elastin |
2.14 |
Up |
Elastin production |
Skin antiaging |
KRT4 |
Keratin, type II cytoskeletal 4 |
2.38 |
Up |
Production of Keratin 4 protein |
Fibrous proteins that form the structural framework of epithelial cells |
ICAM1 |
Intercellular adhesion molecule 1 |
2.41 |
Up |
Immune-mediated inflammatory processes |
Anti-inflammatory |
MKI67 |
FHA domain-interacting nucleolar phosphoprotein |
2.54 |
Up |
Mitosis and cell cycle progression |
Maintaining cell proliferation |
GSTT1 |
Glutathione S-transferase theta1 |
2.55 |
Up |
Oxidative protection |
Cellular antioxidant |
CALML5 |
Calmodulin-like skin protein |
2.91 |
Up |
Differentiating keratinocytes in epidermis |
Development of epidermis |
AQP3 |
Aquaporin 3 |
3.13 |
Up |
Regulates stratum corneum and epidermal glycerol content |
Skin hydration |
FMOD |
Fibromodulin |
3.23 |
UP |
Assembly of extracellular matrix |
Collagen fibrillogenesis |
MT1A |
Metallothionein 1A |
4.57 |
Up |
Binds various heavy metals |
Heavy metal detoxification |
CDKN2A |
Cyclin-Dependent Kinase Inhibitor 2A |
6.86 |
Up |
Regulation of autophagy and caspase-independent cell death |
Skin antiaging, Anti-senescence |
GPX1 |
Glutathione peroxidase 1 |
7.19 |
Up |
Detoxification of hydrogen peroxide |
Potent antioxidant |
Table 1. Gene expression of n-decanoyl-l-glutaminyl-l-glutamine amide for skin benefits.
cDNA synthesis: cDNA was generated for each sample using a High Capacity cDNA Reverse Transcription Kit (Applied Biosystems) according to manufacturer's instructions.
qPCR processing: PCR reactions were run using an Applied Biosystems 7900HT instrument. 92 target genes were assayed using Applied Biosystems validated gene expression assays in TLDA format. All genes were assayed in duplicate.
Data analysis: Raw data was imported into RealTime StatMiner software v4.2 (Integromics) for analysis using the relative quantitation (RQ) method. In the first step of an RQ analysis, the CT value of the target gene is normalized to the CT value of an endogenous control gene for each sample to generate the delta CT (dCT). dCT values are calculated in order to normalize/control for variability between the samples that may occur during the experimental procedures. Three algorithms were used to confirm the choice of endogenous control gene; details on the method used to determine the most suitable control gene are outlined in the "Endogenous Control Gene Selection" section below. Unpaired t-tests were used to compare the treatment groups against the appropriate vehicle control group. Statistically significant changes in gene expression (p<0.05, N=4) are reported.
Data reporting: Differences in gene expression are reported by StatMiner software as logioRQ values, where positive values indicate increased gene expression and negative values indicate decreased gene expression. A logioRQ value of 1.0 is equivalent to a 10-fold change in gene expression. A logioRQ value of 0.3 is equivalent to a linear fold change of 2.0. The logioRQ values from StatMiner have been converted to linear fold-change values to simplify data interpretation in the tables and figures of this report (see the attached Excel file, "024-001-DATA-21NOV2012" for all logioRQ values). Linear fold-change values of 2.0 or greater are typically considered biologically relevant.
Results and discussion
Summary of results
0.1% DGGA compared to untreated control: Changes in gene expression are reported as linear fold change differences between the treated and vehicle control groups. Positive values indicate increased gene expression; negative values indicate decreased gene expression (Table 2).
Gene |
24 hour FC |
Direction of Regulation with Treatment |
MMP9 |
-4.19 |
Down |
AQP3 |
-2.30 |
Down |
KRT1 |
-2.08 |
Down
Up |
BMP2 |
2.00 |
Up |
LCE3D |
2.12 |
Up |
PTGS2 |
2.22 |
Up |
IL1B |
2.26 |
Up |
AGER |
2.93 |
Up |
118 |
3.33 |
Up |
LIF |
4.88 |
Up |
Table 2. 0.1% DGGA compared to untreated control
Gene |
24 hour FC |
Direction of Regulation with Treatment |
BMP2 |
-3.98 |
Down |
SPINKS |
-3.44 |
Down |
FLG |
-2.49 |
Down |
TNF |
-2.19 |
Down |
COL3A1 |
-2.17 |
Down |
PTGS2 |
2.08 |
Up |
TP73 |
2.16 |
Up |
CDSN |
2.21 |
Up |
ELN |
2.24 |
Up |
KRT4 |
2.38 |
Up |
ICAM1 |
2.41 |
Up |
MKI67 |
2.54 |
Up |
GSTT1 |
2.55 |
Up |
CALML5 |
2.91 |
Up |
AQP3 |
3.13 |
Up |
FMOD |
3.23 |
Up |
MT1A |
4.57 |
Up |
CDKN2A |
6.86 |
Up |
GPX1 |
7.19 |
Up |
Table 3. 0.1% DGGA compared to 100% DMSO vehicle control
0.1% DGGA compared to 100% DMSO vehicle control: Changes in gene expression are reported as linear fold change differences between the treated and vehicle control groups. Positive values indicate increased gene expression; negative values indicate decreased gene expression (Table 3).
Fold change values of 2.0 or greater are typically considered biologically relevant, but in the personal care industry, fold-change values of 1.5 are often seen in marketing materials. A summary of DGGA gene expression testing data, as they relate to their targeted skin care benefits, is provided in the Table 1.
Exceptional resultsThe gene-expression data (Table) clearly indicate DGGA provides a topical method of treating, reducing the occurrence of, or improving the symptoms associated with melanogenesis, oxidative damage, inflammation, skin irritation from inflammation, loss of cell adhesion, loss of desquamation, extra-cellular including connective tissue matrix breakdown and skin tone loss thereof, loss of keratinization, cellular senescence, skin aging from cellular senescence, loss of skin whiteness, loss of skin barrier function, loss of skin firmness, inflammation from rosacea, skin disfigurements and skin discoloration from rosacea, inflammation from acne, skin wrinkles and fine lines from cellular senescence, cellular oxidation, loss of skin collagen, and topical wounds.
Conclusion
DGGA offers a new approach for topical skin care via the management of a variety of biological pathways that include melanogenesis, cellular inflammation, free radical and other oxidative damages, senescence, and skin aging.
References
- Schwartz L, Guais A, Pooya M, Abolhassani M (2009) Is inflammation a consequence of extracellular hyperosmolarity? J Inflamm (Lond) 6: 21. [Crossref]
- Abolhassani M1, Wertz X, Pooya M, Chaumet-Riffaud P, Guais A, et al. (2008) Hyperosmolarity causes inflammation through the methylation of protein phosphatase 2A. Inflamm Res 57: 419-429. [Crossref]
- D'souza-Ault M, Smith L, Smith G (1993) Roles of N-Acetylglutaminylglutamine Amide and Glycine Betaine in Adaptation of Pseudomonas aeruginosa to Osmotic Stress. Appl Environ Microbiol 59: 473-478. [Crossref]
- Gouffi K, Blanco C (2000) Is the accumulation of osmoprotectant the unique mechanism involved in bacterial osmoprotection? Int J Food Microbiol 55: 1-3. [Crossref]
- Sagot B1, Gaysinski M, Mehiri M, Guigonis JM, Le Rudulier D, et al (2010). Osmotically induced synthesis of the dipeptide N-acetylglutaminylglutamine amide is mediated by a new pathway conserved among bacteria. Proc Natl Acad Sci USA 107: 12652-12657. [Crossref]
- Gupta S, Walker L (2012) Prevention of Cellular Senescence in Mammals by Natural Peptide Complexes, U.S. Pats. 8,212,876 (July 3, 2012); 8,258,343 (September 4, 2012); 8,293,943 (October 23, 2012).
- Genemarkers LLC (2013) Gene Expression Analysis of Full Thickness in vitro Skin Cultures Treated with Test Materials for 24 Hours. Project Report 024-001 (November 21, 2012). Genemarkers, 126 E. South Street, Kalamazoo, Michigan, USA.