Abstract
The design (software control) guidelines are presented for medical laser systems based on the analysis of the tissue temperature response to various lasers at both cw and pulsed modes. By solving the laser volume-heating diffusion equation, we analyze the roles of various laser and tissue (or water) parameters on the laser-heated solution temperature profiles, including laser intensity, pulse-width, on-off ratio, absorption and thermal constants of the solution or tissues. Two experimental setups are designed to measure the real-time temperature profiles change under laser interactions with results compared to the computer simulations. One experiment uses nano-gold solution which is heated by a diode laser at 808 nm and temperature increases on the surface and inside the solution are monitored for feedback controlled laser on-off time. The other experiment uses water as the solution and heated by a diode laser at 1450 nm. Our new finding includes the optimal control of the laser on-off time and the adjustment of absorption coefficient by off-resonance excitation. The finding and novel features are analyzed theoretically.
Keywords
clinical procedures, laser thermal effects, heat diffusion, diode lasers, temperature profiles.
Introduction
Lasers have been used for various medical procedures such as dermatology and plastic surgery [1-4] wound healings [5], nerve stimulation [6], dentistry [7] and many other therapeutic procedures. Combining the nanoparticles, diode lasers have been also used for cancer therapy [8], bio-sensing, bio-imaging, drug delivery and diagnostics of cancer cell [9-13]. Lasers in the near infrared (IR), wavelength of 750-1200 nm, have deeper tissue penetration depths than that of visible lasers. Therefore, near IR lasers are good candidates for procedures which need deep penetrations such as hair removal and nano-gold mediated cancer therapy. On the other hand, visible lasers (430-680 nm) with strong absorption in blood and color-dyes have been used for phototherapy of oral cancer, retina deceases and tattoo removal. Mid-IR lasers (1.9 -3.0 um and 9.3 -10.6 um) with strong absorption in water and tissue have been used for super surface procedures or ablative type procedures such as soft and hard tissue ablation. Other IR lasers (1.3-1.6 um) have been used for so called minimally invasive procedures such as resurfacing due to their smaller tissue absorption than that of mid-IR lasers.
Laser-tissue interaction, in general, could be categorized into three processes: (a) pure thermal, (b) non-thermal, and (c) combined thermal and non-thermal effects. These processes are governed by not only the tissues optical properties but also the laser parameters such as its wavelength, energy, intensity, pulse-width, repetition rate and the operation modes (cw or pulsed). For example, an ablative Er:YAG laser operated at short pulse could become a thermal laser when it is operated at low power and/or long pulse; whereas a thermal laser at 1540-nm operated at long pulse could become an ablative, non-thermal laser when it is operated at very short pulse, say less than 10 picoseconds.
Overheating of the laser targeted surface areas is always an issue in laser thermal processes such as hair removal and acne treatment. Therefore, cryogen spurts are commonly used in these laser procedures [1]. Alternative method was also proposed by Lin et al using on-off laser pulse-train to avoid surface overheating and deeper laser energy penetration [8]. In multiple laser pulses procedures, the laser-interaction dynamics is much more complex than that of cw or single pulse situation. Therefore, optimal control of the laser parameters and operation modes are required for best clinical outcomes.
This article will provide certain key design (software control) guidelines for medical laser system based on the analysis of the tissue temperature response after laser irradiation. By solving the laser volume-heating diffusion equation, we will analyze the roles of various laser and solution parameters on the laser-heated solution temperature profiles, including laser intensity, pulse-width, on-off ratio, absorption and thermal constants of the tissues. Two experimental setups are designed to measure the real temperature profiles change under laser interactions (at wavelength of 810-nm and 1450-nm) with results compared to the computer simulations. New experimental findings and features will be analyzed theoretically. These features are valuable for laser system designs to meet specific clinical procedures such as selective cancer cell/tumor killing and skin rejuvenation.
document is a template. An electronic copy can be downloaded from the conference website. For questions on paper guidelines, please contact the conference publications committee as indicated on the conference website. Information about final paper submission is available from the conference website.
Experiments
We introduce two experimental setups as follows. The first one uses a near IR diode laser system (custom-made by New Vision Inc., www.nvi-laser.com, Taiwan) with three wavelengths at 808, 852 and 915 nm, fiber-coupled, bundled and coupled to one single external fiber connected to a hand piece. Using a convex lens, we obtained a collimated output beam having a spot size of 8.0 mm. The to be studied system is a container filled with gold nanorods (GNRs) mixed with distilled water and has a diameter of about 9.0 mm comparable to the laser spot size such that the whole area is illuminated uniformly. The GNRs (manufactured by ITRI, Taiwan) has an aspect ratio (length/width) of 4.0, corresponding to an absorption peak around 810 nm [8].
Two T-type thermal couples (Omega Engineering Inc., US) were inserted into the GNRs solution at a position (depth) of z=1.5 and 5.0 mm to measure the temperature near the surface (defined as surface-temperature) and inside the GNRs solution (defined as volume-temperature). These temperature profiles are real-time monitored and recorded by NI-DAQ device (made by National Instrument, US). Custom-designed Labview software was used for feedback controlling the laser on/off times such that a preset surface-temperature is achieved and kept within a bandwidth of about 0.25°C. The on/off pulsed-train technique allows the surface-temperature of the GNRs solution to remain at a preset value without over-heating, whereas the volume-temperature significantly increases comparing to that of a single-pulse operation. Using the above described experimental setup, the roles of absorption coefficient (A) and laser intensity(F) on the surface and volume temperature profiles are measured and will be analyzed by our theory to be presented in the next section. In addition, our experimental new findings will be shown to be consistent with and actually predictable by our theory.
The second experimental setup (as shown in Figure 1) consists of a container similar to the first setup but filled with distilled water only. A diode laser (at 1450 nm, power up to 5.0 W) is used to cause the temperature increase of the solution. An IR camera is used for real time monitoring of the solution surface temperature. The Absorption coefficient of the water solution is measured to be about 30 cm-1 at 1450 nm. The IR camera used in this experiment has a response time about 150 ms.
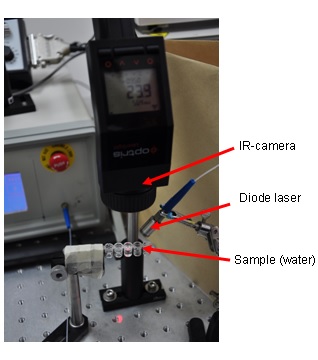
Figure 1: Experimental setup for diode laser heated water sample with surface temperature monitored y an IR camera.
Theory
The temperature profile of the laser irradiated solutions measured by our two experimental setups may be described by a heat diffusion equation as follows [14,15]
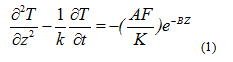
where z is the laser propagation direction along the depth of the GNRs solution, k and K are, respectively, the thermal conductivity and diffusivity of the solution, F is the laser intensity, B is the extinction coefficient, which can be expressed by B=[A(A+2S)]1/2, where A and S are the absorption and scattering coefficient.15 In this study we will assume that the scattering is much smaller than the absorption, and B=A.
The above heat diffusion equation is solved numerically under the initial and boundary conditions:
T(z,0)=T0, dT/dz(at z=0)=h[T(0,z)-T0]/k,
where h is the heat transport coefficient due to the air convection of the GNRs solution surface. Typical thermal parameters to be used in our calculations are K=0.0045 (WC/cm), k=0.00149 (cm2/s), and h=0.01 (WC/cm2) [16]. We shall use above theory to study and compare with the measured data showing the roles of A and F on the temperature profiles near the surface and inside the GNRs solutions. We shall note that our experimental setups have an open solution container which is not a close system. Therefore, we must use a non-zero heat transport coefficient (h). The role of h-value will be analyzed later.
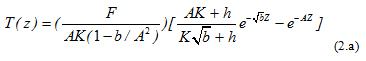
In pulsed laser operation or on-off pulse-train, the light source term of Eq. (1), laser intensity F(t), becomes time dependent and can be characterized by step-function (assumed to be square pulses) defined by the on-off time of the operation. In cw laser operation, the laser-heated solution will reach a steady-state when the irradiation time is much longer than the thermal relaxation time (Tr) given by17 Tr=179/A2 (in pure water) or Tr=251/A2 (in tissue). For examples, in the case of water solution, Tr= (179, 20, 0.8, 0.2) seconds for A = (1,3,15,30) cm-1. One may easily solve Eq. (1) to obtain the steady state solution given by:
And the normalized (by the maximum surface temperature at the end of the laser irradiation) surface maximum temperature is given by,
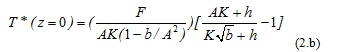
From above equations, we readily see that T* is proportional to the product term (F/K)[1/b1/2 -1/A], when h=0 and it is independent to k. Therefore, larger (AF/K) produces higher T* which can be justified also by the numerical solution of Eq. (1).
Results and Discussion
The Roles of Laser Intensity (F)
We first study the role of laser intensity (F) on the surface-temperature increase. In the first experiment we measured the laser illumination time needed (defined as t, in seconds) for the near-surface (z=1.5 mm) temperature increase of 100 °C, that is from an initial temperature of 250 °C to 350 °C. Using a 808-nm diode laser (having a measured A=3.5 cm-1) for various laser intensity F=0.5 to 4.0 (W/ cm2), as shown in Figure 2 (left), the measured t values are decreasing function of the laser intensity (F). This trend may be well fit by our theory for a heat transport coefficient range of h=0 and 0.05 WC/cm2. As expected from our theory, higher h-value causes a lower surface-temperature due to air convection of the GNRs container. Also, shown in Figure 2 (right), we calculated laser illumination time needed for various A values indicating that larger (AF) values have a shorter time needed to reach a specific temperature increase. These numerical results can be also realized by the steady-state analytic solution, Eq (3.b).
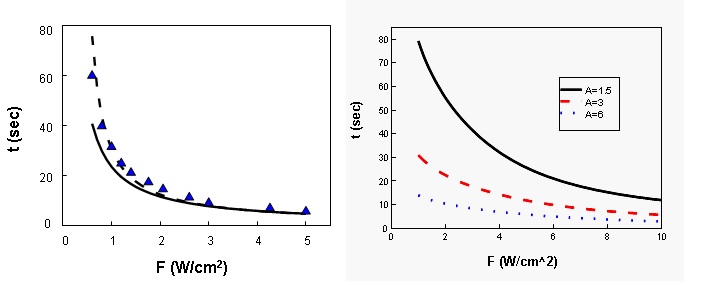
Figure 2: Laser illumination time needed (defined as t, in seconds) for the near-surface (z=1.5 mm) temperature increase of 100C using a 808-nm diode laser (having a measured A=3.5 cm-1) for various laser intensity (F). Triangles are measured data; dash and solid curves are theory-fit for heat transport coefficients h=0 and 0.05 (WC/cm2). (right) Calculated laser illumination time needed (same as Figure2), but for fixed h=0.050(WC/cm2) and for various A= (1.5, 3.0 6.0) cm-1.
Pulsed Train Technique
In the pulsed train technique, custom-designed Labview software was used for feedback controlling the laser on/off times such that a preset surface-temperature is achieved. We analyze the roles of A and F on the temperature increase profiles (dT) in three categories as follows:
Case (a): fixed A and change F
Figure 3 shows the measured surface- and volume-temperature increase profiles (dT) of the first experiment described earlier, at positions z=1.5 and 5.0 mm, respectively, for a diluted GNRs solution (with A=1.33 cm-1) heated by various laser intensity of F= (1.0, 2.0, 2.9) W/cm2. In these measurements, we controlled the surface-dT to be about 100C (with a bandwidth about 0.250C) by the pulsed train on-off technique such that the volume-dT (at z=5.0 mm) reaches about 80C, which cannot be achieved in cw mode operation without overheating the solution surface. In addition, larger F shows faster surface-dT rising profile and higher volume-dT inside the solution. The on-off ratio is about 1 to 3 in these measured data.
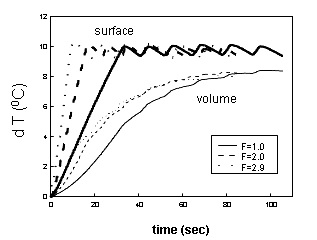
Figure 3: Measured temperature increase profiles (dT) of GNRs solution (with A=1.33 cm-1) heated by pulsed-train laser intensity F=(1.0, 2.0, 2.9)W/cm2, represented by solid, dash and dotted curves, for near-surface (at z=1.5 mm) and volume (at z=5.0 mm).
Case (b): fixed AF, change A and F
As shown in Figure 4, measured temperature increase profile (dT) due to a diode laser at 808 nm (with A=2.9 cm-1) and at 852 nm (with A=2.0 cm-1) for a fixed AF=2.9 (W/cm3). These data show that smaller A (with larger F) has a faster rising surface-dT profiles and higher volume temperature. These measured trends are also predicted by our theory, as shown in Figure 5, with fit parameters of K=0.0045 (WC/cm), k=0.00149 (cm2/s), and h=0.05 (WC/cm2), where the measured laser on-off ratio (about 1 to 3) is used in the computer simulation. These features could also be realized by observing the laser heating term of Eq. (1),  , which indicates that the temperature increase profile (dT) is proportional to the combined factor of (AF/K). However larger A-value will cause a lower dT due to the stronger exponential absorbing (decaying) term
  . This non-linear competing behavior of A on the profiles of dT shown by the heat diffusion equation is demonstrated by our measured results as shown in Figure 4.
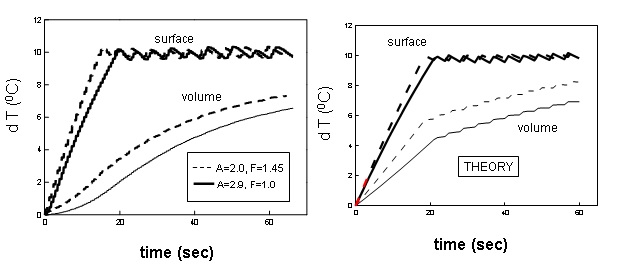
Figure 4: Measured surface and volume dT profiles for a fixed AF=2.9 (W/cm3) and A=2.9 (solid curves) and 2.0 cm-1 (dash curve), where the smaller A has higher volume temperature. (Right) theoretical results associate to the measured data.
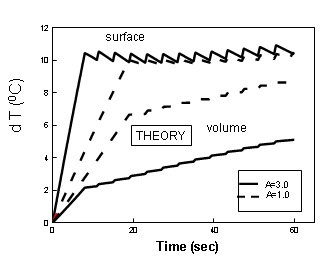
Figure 5: Theoretical curves associate to measured data [7].
Case (c): fixed F, change A
Figure 6 (Left) shows the effects of A=1.0 and 3.0 cm-1 (with a fixed F=2.8 W/cm2) on the measured dT profiles using laser wavelength at 915 nm and 808 nm (having A=1.0, 2.0 and 3.0 cm-1, respectively). The rather surprising results show that (for a fixed F) smaller A achieves higher volume-dT, same trend as that of case (b), but the lower surface-dT has an opposite surface-dT trend of case (b) shown by Figure 5 (with fixed A but changing F). These novel measured features are predictable by our theory shown in Figure 6 (Right).
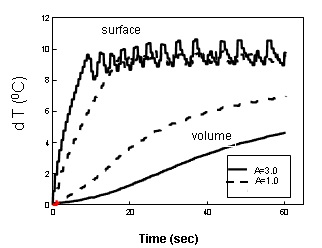
Figure 6: Measured dT profiles for fixed F=2.8 (W/cm2) and for A=3.0(solid curves) and 1.0 cm-1 (dash curve), where the smaller A has higher volume temperature.
We should note that the pulsed-train on-off method along cannot increase the volume-dT to the desired value. One shall also require an optimal A value (say about 1.0m to 1.5 cm-1) which may be controlled either by the GNRs concentration or by using specific off-resonance laser wavelengths. It should be noted that the A-value cannot be too small (say <0.5 cm-1) which will require a longer time needed (say >60 seconds) for a surface-dT about 100C .
The novel features demonstrated in the above described cases (b) and (c) also imply that cancer tumor having a dimension of 10x10mm can be treated using the pulsed train method presented in this paper, but not by the conventional single pulse method. For example, as shown by the 2 solid curves of Figure 9, the volume-dT is lower than 70°C when the surface-dT reaches 100 °C at its first pulsed train. Any cancer tumor with size over 5.0 mm cannot be treated via conventional single pulse method, unless the surface is overheated.
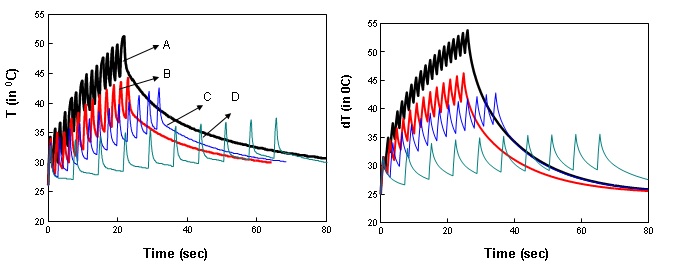
Figure 7: (Left) Measured surface temperature profiles in water using a diode laser at 1450 nm for laser intensity F=2.5 (W/cm2 ) and laser on-time of 0.8 sec with various off-time of (0.6, 1.2, 2.2, 6.4) seconds, represented by curves (A,B,C,D), respectively. (Right) Computer simulation based on Eq. (1) associate to Figure7 (Left).
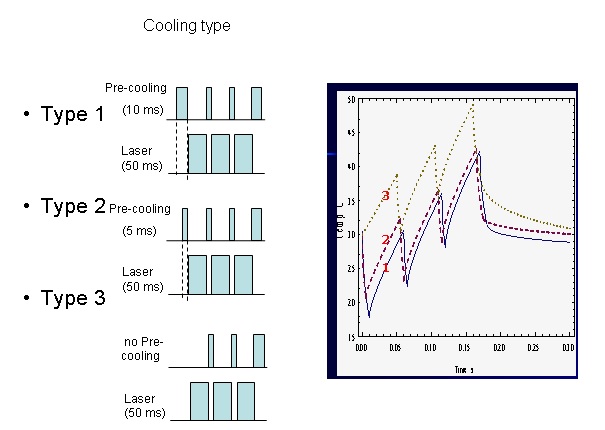
Figure 8: Four types of cooling and laser heating combinations. (Right) Computer simulated temperature profiles for various conditions defined in Figure8 (Left).
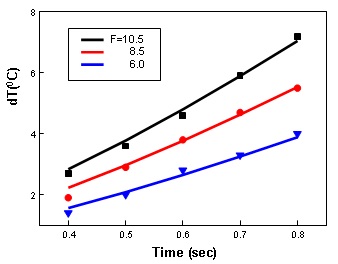
Figure 9: shows the effects of absorption coefficient (A) and laser intensity (F) on dT. As we expected, dT is almost linearly proportional to F and the slopes are increasing function of A.
In the above examples, we have clearly demonstrated both experimentally and theoretically that the volume dT could be significantly increased to treat large size tumors using the combined techniques of: (a) the pulsed train operation, and (b) the optimal control of the laser intensity and the absorption coefficients for a given GNRs aspect ratio and concentration. This study provides us a general guidance that for clinically optimized condition of 10 to 40 seconds laser irradiation time to kill the cancer tumor with size of 0.5 to 1.5 cm diameter, one should use a laser intensity about (1.0-3.0) (W/cm2) and control the A values about (0.8-2.0) cm-1. Furthermore, the pulsed-train (on-off) technique is required to avoid surface overheating.
We should note that the in vivo situation in animal and/or human cancer therapy will be much more complex than the in vitro, simplified conditions described in this paper. These complexities shall include the non-uniform GNRs concentration in the tumor, the multi-layer normal-cancer tissue medium with multiple thermal parameters, and the blood flowing of the laser-targeted areas. This study with simplified conditions defined by uniform GNRs solution and controlled thermal parameters, however, still provides meaningful guidance based on vitro experimental measurements which are also consistent with theory. In addition, the design of multiple-wavelengths laser system shall partially overcome the issues of GNRs non-uniform and multiple thermal medium for a 3-dimensional-therapy, in which various absorption penetration depths are available via the fiber-coupled multiple-wavelength laser simultaneously targeting the cancer tumors, Finally, the novel techniques and the laser system with auto-temperature control introduced in this paper should provide useful tool for animal studies which are in progress in our lab, where a faster temperature response time (about 150 ms) given by an IR camera will be integrated to our existing system for real-time surface temperature monitoring.
The Role of Laser On-off Ratio
We shall now present the roles of laser on-off ratios on the surface temperature profiles T(t) which are measured by our second experimental setup using a diode laser at 1450 nm propagating in water solution. The measured data are shown in Figure 7 (Left) for laser intensity F=2.5 (W/cm2) and laser on-time of 0.8 sec with various off-time of (0.6, 1.2, 2.2, 6.4) sec. One may readily see that larger off/on ratio produces lower T(t) as one should expected. This feature may be used in laser related clinical procedures which requires a preset increase of the surface and volume temperatures without overheating the laser heated surface, such as human skin. Examples include laser hair removal, acne and retina coagulation currently used in many commercial systems. Figure 7 (Right) is the computer simulation based on Eq. (1) which shows the high similarity to the trend of the measured profiles.
Laser Heating plus Surface Cooling
We shall analyze yet another multiple laser pulses situation, in which cryogen spurs are used to avoid tissue surface overheating.1 Figure 11 shows four types of cooling and laser pulsing combinations which have been used in commercial lasers for hair removal and acne treatment,1 where the laser pulse is fixed at 50 ms, but the cooling periods are varying. The computer simulated curves (shown in Figure 8) show the similar trend as the measured data of Zhang et al [1].
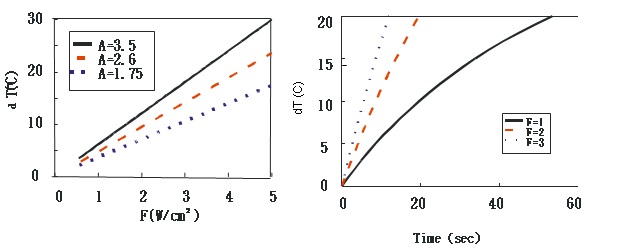
Figure 10: The effects of laser intensity (F) on the surface-temperature increase (dT), where F in the unit of (W/cm2). (Right) Calculated temperature profiles T(z) at a given laser irradiation time (10 seconds) for diode laser heated water at 1450 nm (or A=30 cm-1, with a fixed F=10 W/cm2).
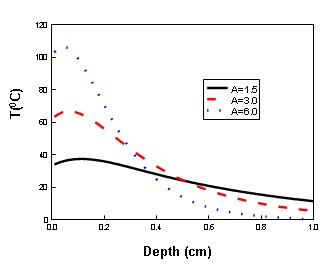
Figure 11: Calculated temperature profiles T(z) at a given laser irradiation time (10 seconds) for diode laser heated water at 1450 nm (or A=30 cm-1, with a fixed F=10 W/cm2).
The roles of A and F
We shall analyze the roles of the tissue thermal constants and laser parameters on the temperature increases for the case of cw operation. Figure 9 shows the theory fit (solid curves) to the measured data for the surface temperature increase dT(z=0, t=10 sec) caused by 10 seconds irradiation of 1450-nm diode laser in water.
Figure 10 shows the effects of absorption coefficient (A) and laser intensity (F) on dT. As we expected, dT is almost linearly proportional to F and the slopes are increasing function of A. Another example is shown in Figure 11, where larger F has a faster raising curve of dT.
Temperature Spatial Profile
Figure 11 shows the roles of A on the temperature spatial (in the depth direction) profiles T(z) at a given laser irradiation time (10 seconds) for diode laser heated water at 1450 nm and for h=0.05 (WC/cm2) and k=0.00149 (cm2/s). We note that the surface temperatures (at z=0) are lower than the volume temperature (around z=0.1 cm) due to the air convection of the laser-heated solution defined by the heat transport coefficient (h). The effects of A and F are shown by Figure 12, where AF is fixed at 24 (WC/cm2) and varying A and F, where the cw-mode laser irradiation time is 5 seconds. We note that smaller A (or larger F) produce higher T(z, t=10 sec). Finally, we show the roles of thermal conductivity (k) and diffusivity (K) of the laser-heated solution on the surface temperature profiles dT(z=0, t) and surface temperature increase dT (0,t=10 sec), respectively. As seen in Figures 13 and 14 that larger thermal conductivity (k) produces higher dT and faster rising slope, in contrast to the reverse trend of diffusivity (K). These features may also be realized by Eq. (1) and (2.c).
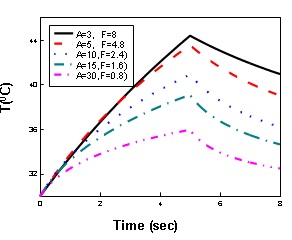
Figure 12: Surface temperature profiles T(0,t) for fixed AF =24 (WC/cm2) and varying A and F.
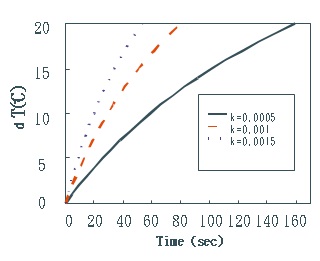
Figure 13: Surface temperature profiles dT (z=0, t) for various thermal conductivity (k) in unit of (cm2/s).
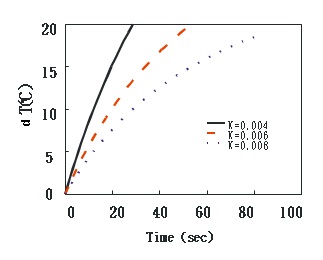
Figure 14: Surface temperature profiles dT (z=0, t) for various diffusivity (K) in unit of (WC/cm).
Conclusion
This paper provides certain key design guidelines for medical laser system based on the tissue temperature response after laser irradiation. By solving the laser volume-heating diffusion equation, we analyze the roles of various laser and tissue parameters on the tissue temperature profiles, including laser fluence, pulse-width, on-off ratio, absorption and thermal constants of the tissues. New experimental finding consistent with theoretical calculations are valuable for the designs of laser medical procedures, in which optimal laser operation for the surface and volume heating was achieved by a novel pulsed-train technique.
Acknowledgment
This work is partially supported by the internal grant of New Vision Inc. and grant from Xiamen-200 program (Xiamen Science & Technology Bureau, China). The author thanks Yu-Lin Hong for the assistance in experiments and drawings.
References
- Zhang H, Ramirez-SJ, Choi H, Jia W, Aguilar G, et al. (2006) Thermal responses of ex vivo human skin during multiple cryogen spurts and 1,450 nm laser pulses, Lasers Surg Med 38: 137-141.
- Tieny E, Hanke CW (2009) Randomized controlled trial: comparative efficientcy for the treatment of facial telagiectasias with 532 nm versus 940 nm diode laser. Lasers Surg Med 41: 555-562.
- Tark KC, Jung JE, Song SY (2009) Superior lipolytic effect of the 1,444 nm Nd:YAG laser: comparison with the 1,064 nm Nd:YAG laser. Lasers Surg Med 41: 721-727. [crossref]
- Thongsima S, Zurakowski D, Manstein D (2010) Histological comparison of two different fractional photothermolysis devices operated at 1,550 nm. Lasers Surg Med 42: 32-37.
- Dai T, Tegos GP, Zhiyentayev T, Mylonakis E, Hamblin MR (2010) Photodynamic therapy for methicillin-resistant Staphylococcus aureus infection in a mouse skin abrasion model. Lasers Surg Med 42: 38-44. [crossref]
- McCaughey RG, Chlebicki C, Wong BJ (2010) Novel wavelengths for laser nerve stimulation. Lasers Surg Med 42: 69-75. [crossref]
- Fan K, Bell P, Fried D (2006) Rapid and conservative ablation and modification of enamel, dentin, and alveolar bone using a high repetition rate transverse excited atmospheric pressure CO2 laser operating at 9.3 um. J Bio Opt 11: 064008-1 – 06008-11.
- Lin JT, Hong YL, Chang CL (2010) Selective cancer therapy via IR-laser-excited gold nanorods, Proc. SPIE 7562, 75620R.
- Murday JS, Siegel RW, Stein J, Wright JF (2009) Translational nanomedicine: status assessment and opportunities, J Nanomedicine 5: 251-273.
- Huang XH, El-Sayed IH, Qian W, El-Sayed MA (2009) Cancer cells assemble and align gold nanorods conjugated to antibodies to produce highly enhanced, sharp, and polarized surface Raman spectra: a potential cancer diagnostic marker, Nano Lett 7: 1591-1597.
- Chen PC, Mwakwari SC, Oyelere AK (2008) Gold nanoparticles: From nanomedicine to nanosensing. Nanotechnol Sci Appl 1: 45-65. [crossref]
- Tong L, Wei G, Cheng JX (2009) Gold nanorods as contrast agents for biological Imaging: optical properties, surface conjugation and photothermal effects. Photochem and Photobiol 85: 21-32.
- West JL, Halas NJ (2003) Engineered nanomaterials for biophotonics applications: improving sensing, imaging, and therapeutics. Annu Rev Biomed Eng 5: 285-292. [crossref]
- Carslaw HS, Jaeger JC (1959) Conduction of Heat in Solids. Oxford University Press: New York.
- Martin GT, Bowman HF (1990) Proc. SPIE 1202: 305-316.
- Springer TA, Welch AJ (1993) Temperature control during laser vessel welding. Appl Opt 32: 517-525. [crossref]
- Niemz MH (2004) Laser-tissue interactions: Fundamentals and applications(Springer-Verlag: Heidelberg,, 2004).