Abstract
Mass spectrometry-based clinical proteomic analysis, combined with collection of taegeted cancerous cells laser-microdissected (LMD) from formalin-fixed paraffin-embedded (FFPE) tissues, has been promising to unveil both proteins expressed and their functional networks in lung cancer subtypes. Among lung cancer subtypes, both large cell neuroendocrine carcinoma (LCNEC) of the lung and small cell lung carcinoma (SCLC) are now classified to neuroendocrine tumor (NET) but pre-therapeutic histological distinction between LCNEC and SCLC has so far been problematic, leading to adverse clinical outcome. Protein biomarker candidates for LCNEC were found to be interestingly known as cancer stem cell (CSC) markers including aldehyde dehydrogenase 1 family member A1 (ALDH1A1), and those for SCLC included novel NET marker candidates, brain acid soluble protein 1 (BASP1) and secretagogin (SEGN), and a known NET marker, neural cell adhesion molecule (CD56). For three types of lung adenocarcinomas (ACs), which are adenocarcinoma in situ (AIS), minimally invasive adenocarcinoma (MIA), and lepidic predominant invasive asenocarcinoma (LEP), their preliminary clinical proteomic analyses revealed protein expression profiles characterizing those lung cancer subtypes. The STRING protein-protein interaction (PPI) network analysis followed by gene set enrichment (GSE) for proteins expressed significantly to the three lung AC subtypes manifested characteristic associations of cancer-related pathways, which might play consertedly important roles in progression of disease mechanisms, and which would be quite useful to understand carcinogenic processes of lung adenocarcinom. Thus outcomes from clinical proteomic analysis reveal not only biomarker protein candidates expressed significantly to a disease but also serve to elucidate disease-oriented protein-protein interaction (PPI) networks including functional networks predicted from experimentally obtained proteome datasets.
Key words
lung cancer. laser microdissection
Abbreviations
LCNEC: Large-Cell Neuroendocrine Lung Carcinoma, OLC: Other Large-Cell Lung Cancer, SCLC: Small-Cell Lungcancer, GGO: Focal Ground-Glass Opacity, AIS: Adenocarcinoma In Situ, MIA: Minimally Invasive Adenocarcinoma, LEP: Lepidic Predominant Invasive Adenocarcinoma, FFPE: Formalin-Fixed and Paraffin-Embedded tissue sections, MS: Mass Spectrometry, PPI: Comparative Proteomics, Protein-Protein Interaction
Introduction
Lung cancer is the leading cause of cancer-related mortality worldwide [1]. In Japan, annual deaths from lung cancer have been increasing and reached about 70,000 [2], and in the United States reached 160,000 even with a recent decreasing trend [3]. Recent advances in chest high-resolution computed tomography (HRCT) scanning technology have enabled to find small lung adenocarcinomas showing increasing trend worldwide [4] at an earlier and potentially more curable stage than was previously possible [5]. There are 90 million current and ex-smokers in the United States who are at increased risk of lung cancer. The published data from the National Lung Screening Trial (NLST) suggest that yearly screening with low-dose thoracic CT scan in heavy smokers can reduce lung cancer mortality by 20% and all-cause mortality by 7% [6].
Lung cancer subtypes
Large-cell lung cancer (LCC) is one of the subtypes that cancerous large cells grow without any distinctive tissue construct. Small-cell lung cancer (SCLC) is the subtype of an aggressive neuroendocrine tumor consisting of small bare nuclei cells. Travis et al. [7] proposed a new subtype of large-cell lung carcinoma, named large cell neuroendocrine carcinoma (LCNEC) in 1991. SCLC is the subtype of an aggressive neuroendocrine tumor consisting of small bare nuclei cells. Currently, both LCNEC and SCLC belong to neuroendocrine tumors (NET) of the lung in the 2015 WHO classification [8]. LCNEC exhibits morphology similar to other LCC (OLC), but neuroendocrine differentiation like SCLC that could be judged by expression of at least one of three representative neuroendocrine proteins; neural cell adhesion molecule (NCAM1 which is known as CD56), synaptophysin (Syn) and chromogranin A (CGA). Developmental history of the tissue origin is currently unknown for these three types of lung cancers. LCNEC has a poor prognosis similarly as small-cell lung carcinoma (SCLC), and survival rate is just 18% in IA-stage only by resection [9,10]. Currently similarly to non small-cell lung carcinoma (NSCLC) its resection is first choice, and followed adjuvant therapy is selected as for SCLC. Surgical resection of LCNEC in many series has been described with 5-year actuarial survival that is far worse than that reported for other histological variants of non-small-cell lung cancer (NSCLC). There have been considerable debates on whether these tumors should be classified and treated as NSCLC or SCLC. The large-scale epidemiologic study has compared the presenting and prognostic characteristics of patients with LCNEC with those of patients with SCLC or other large cell carcinomas (OLCs) with respect to overall survival (OS) and lung cancer-specific survival (LCSS) rates for patients undergoing definitive resection without radiotherapy (S-NoRT), and they have concluded that LCNEC should continue to be classified and treated as a large cell carcinoma because the clinical, histopathologic, and biologic features of LCNEC are more similar to OLC than to SCLC [11,12].
Lung adenocarcinoma classification
In 2011, new pathologic classification of lung adenocarcinoma was proposed by the International Association for the Study of Lung Cancer (IASLC), the American Thoracic Society (ATS) and the European Respiratory Society (ERS) [13]. In the new classification, concept of adenocarcinoma in situ (AIS) and minimally invasive adenocarcinoma (MIA) were newly introduced and the term bronchioloalveolar carcinoma (BAC) was abolished. Additionally, invasive adenocarcinomas were categorized into 6 subtypes, lepidic, acinar, papillary, micropapillary, solid, and variants, according to the predominant histologic pattern. Both AIS and MIA were defined tumors ≤ 3 cm in size. AIS is a preinvasive lesion showing pure lepidic growth without invasion. MIA is also lepidic predominant tumor but with ≤ 5 mm invasion. Lepidic predominant invasive adenocarcinoma (LEP) is an invasive adenocarcinoma showing former nonmucinous BAC pattern with > 5 mm invasion. These 3 lepidic type adenocarcinomas are speculated to show step-wise progression from AIS, MIA, to LEP. After complete resection of AIS or MIA, usually 100% of recurrence-free 5-year survival can be obtained [13], while some recurrent cases are found after resection of LEP [14-16]. Since postoperative prognoses between the AIS plus MIA group and LEP are different, differential protein expressions associated with invasiveness of cancer cells in each subtype should play important roles to determine local recurrences and survivals.
Recent advancements in shotgun sequencing and quantitative mass spectrometry (MS) could make proteomics amenable to unveil proteins significantly expressed in clinical specimens of a disease [17,18]. Figure 1 illustrates a workflow of clinical proteomic analysis utilizing a variety of formalin fixed paraffin embedded (FFPE) cancer tissues archived, from which laser microdissection (LMD) made it possible to collect target cells to be investigated [19-26]. This paper describes clinical proteomic analysis that can profile proteins expressed in cancerous cells derived from lung cancer subtypes, from which proteomic datasets obtained are utilized importantly to elucidate biomarker candidates and further acquire a knowledge of dynamic protein-protein interactions (PPI) networks linked tightly to a disease mechanism.
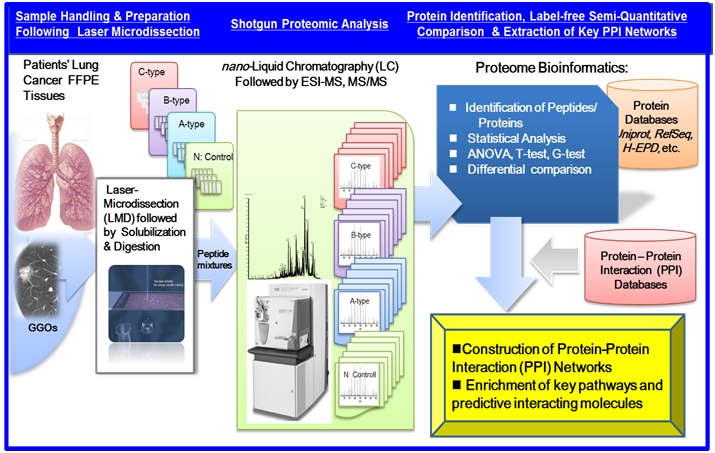
Figure 1. A workflow of MS-based proteomic analysis of target cells laser-microdissected (LMD) from a variety of formalin fixed paraffin embedded (FFPE), followed by analysis of protein-protein interaction (PPI) networks and associated cellular pathways.
Clinical proteomic analysis
Millions of clinical samples are obtained every day for use in diagnostic tests that support clinical decision making. Clinical samples (tissues, biopsies, blood, etc.) can also be archived into repositories for use in future studies investigating the etiology of diseases using omics approaches. Therefore, infrastructure buildup of standardized biobanking is increasingly needed within the clinical omics community because the samples themselves have intrinsic values in the determination of outcomes of clinical trials [27-32]. The samples can be retrieved from pathology laboratories with the approval from ethical committees of medical institutes and hospitals. Many types of disease specimens exist, such as frozen and FFPE tissues; biopsies; and body fluids including blood, serum, plasma, and urine; interstitial fluid; cyst material; ascites fluid; and pancreatic juice.
Laser microdisection and protein solubilization
In hospitals and medical institutes, tumor tissues obtained by surgical resection are typically fixed in 4% paraformaldehyde and routinely processed for paraffin sectioning. Cancerous lesions can be identified on serial tissue sections stained with hematoxylin and eosin (HE). Figure 2 shows (A) focal ground-glass opacity (GGO) on chest HRCT, which lesions are identified as AIS, MIA, or LEP and (B) a representative HE-stained image of LEP. Laser microdissection (LMD) makes it possible to collect target cells from a variety of FFPE cancer tissues. For shotgun proteomic analysis, 10-μm sections prepared from the same tissue block are attached onto DIRECTOR™ slides (OncoPlexDx, Rockville, MD, USA), de-paraffinized twice with xylene for 5 min, rehydrated with graded ethanol solutions and distilled water, and stained by hematoxylin [33-37]. Slides are air dried and subjected to LMD with a Leica LMD7000 (Leica Micro-systems GmbH, Ernst-Leitz-Strasse, Wetzlar, Germany). Typically, ca. 30,000 cells (ca. 8 mm2) per tissue sample are transferred directly to a 1.5-mL low-binding plastic tube. Figure 3 exemplifies the hematoxylin-stained LEP tissue before and after LMD (C-1 and C-2, respectively).
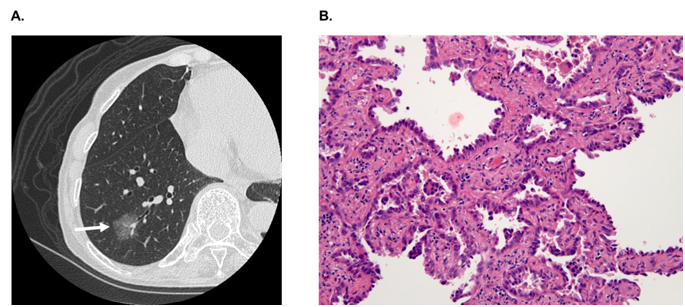
Figure 2. A) A focal ground-glass opacity (GGO) on chest HRCT, which lesions are identified as AIS, MIA or LEP, and B) a representative HE-stained image of LEP.
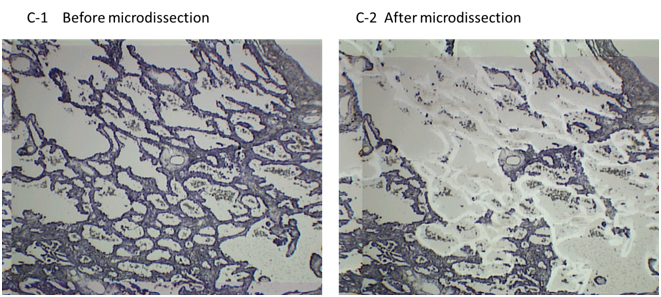
Figure 3. The hematoxylin-stained LEP tissue before and after LMD (C-1 and C-2, respectively). The DIRECTOR® slide is similar to a standard glass (uncharged) microscope slide, but has an energy transfer coating on one side of the slide. Tissue sections are mounted on top of the energy transfer coating, and when the slide is turned over, the tissue faces down under the microdissection system. Targeting cells or tissue areas of interest is carried out on computer display. The laser energy is converted to kinetic energy upon striking the coating, vaporizing it and instantly propelling selected tissue features into the collection tube.
Proteins/peptides from dissected cells can be extracted by following several protocols [33,35]. For example, according to the protocol of a Liquid Tissue™ MS Protein Prep kit (OncoPlexDx, Rockville, MD, USA) [33], the cellular material, suspended in the liquid tissue buffer, is incubated at 95°C for 90 min, cooled on ice (3 min), and subsequently enzymatically digested, followed by reduction and alkylation. The liquid tissue digests can be stored at −20°C until proteomic analysis.
Recent advances in mass spectrometry (MS) could make proteomics amenable to in-depth exploratory and targeted quantitative analysis of proteins expressed in a complex clinical specimen [38,39]. MS is greatly advantageous due to its extremely high capability of capturing/identifying/sequencing of proteins/peptides expressed in a complex clinical specimen, with high sensitivity and high precision, unlike others [18].
Exploratory ShotGun proteomic analysis
An exploratory proteomic analysis typically comprises extraction and/or direct tryptic digestion of all expressed proteins in a complex biological sample, and then the peptide mixture obtained is subjected to liquid chromatography (LC) /electrospray ionization-tandem MS analytical platform so as to sequence these by searching against protein sequence databases, which is referred as ShotGun proteomic analysis. Protein identification in shotgun proteomic approaches (bottom-up) can be now performed by four peptide sequencing strategies using MS/MS spectra: (A) database search, (B) spectral library matching, (C) hybrid approaches using sequence-tag determination followed by database search, and (D) de novo sequencing as illustrated in figure 4. Several hundreds to several thousands (more than 10,000 in some cases) different protein species can typically be identified in such exploratory clinical proteomic studies [39-46], in which label-free semi-quantitative comparison with statistical evaluation is mainly performed to elucidate proteins specifically relevant to a disease subtype.
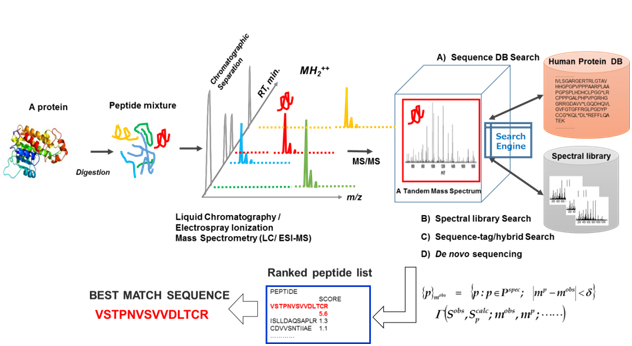
Figure 4. An illustration of exploratory MS-based proteomic analysis: All expressed proteins in a complex biological sample are extracted and/or are subjected to direct tryptic digestion, and then peptide mixture obtained are subjected to a liquid chromatography/electrospray ionization (ESI) -tandem mass spectrometry (LC/ESI-MS/MS) "ShotGun” analytical platform to sequence them by searching against protein sequence databases.
Targeted protein detection and quantitation
In order to detect and quantify targeted peptides/proteins, selected-reaction monitoring (SRM) mass spectrometric assays are often utilized in tandem mass spectrometry, in which a targeted ion of a particular mass, usually a doubly-charged peptide ion, is selected in the first stage of a tandem mass spectrometer and a singly-charged product of a fragmentation reaction of the doubly-charged precursor ion is selected in the second mass spectrometer stage for detection, which is referred as the SRM transition. The SRM technology complements the discovery capabilities of ShotGun proteomic strategies by its reliable quantification of peptides/proteins of low abundance in a complex clinical sample [19,21].
Biomarker candidates for lung cancer subtypes
In the preliminary proteomic study conducted for three lung cancer subtypes of OLC (n=5), SCLC (n=5) and LCNEC (n=4), in which n denotes the number of patients, proteins up-regulated in LCNEC were representatively aldehyde dehydrogenase 1 family member A1 (ALDH1A1), aldo-keto reductase family 1 members C1 (AK1C1) and C3 (AK1C3) and CD44 [37]. On the other hand, those in SCLC were brain acid soluble protein 1 (BASP1), secretagogin (SEGN), and neural cell adhesion molecule (CD56). BASP1 is a newly reported NET marker candidate, which is known as a cofactor of WT1 (the Wilms’ tumor suppressor) that suppresses the transcriptional activation function of WT1 [47]. BASP1 is a significant regulator of WT1 that is recruited to WT1-binding sites and suppresses WT1-mediated transcriptional activation at several WT1 target genes, and it has been reported that WT1 and BASP1 cooperate to induce the differentiation of K562 cells to a neuronal-like morphology [48,49]. Thus, BASP1 might be related to transcriptional reprogramming and morphological changes to a neuroendocrine phenotype in lung cancer.
Discovery of Biomarker candidates is carried out by semi-quantitative comparisons based on spectral counting and G-statistics [20-26]. G-values were obtained in pairwise group-comparison of spectral counts of a protein, in which the spectral count is the number of MS/MS spectra assigned to a protein. The G-score > 3.84 is equal to the significance p-value less than 0.05. Figure 5 illustrates a 3D scatter plot with an X axis indicating G-statistic values (G-values) for LCNEC vs. OLC analysis, a Y axis for OLC vs. SCLC, and a Z axis for LCNEC vs. SCLC. The proteins expressed specifically to LCNEC will therefore be present in the region (X > 3.84, Z > 3.84 corresponding to p < 0.05 each) on the X-Z plane, those in SCLC in the region (y > 3.84, z > 3.84) on the Y-Z plane and those in OLC in the region (X > 3.84, Y > 3.84). This resulted in identifying four proteins ALDH1A1, AK1C1 AK1C3 and CD44 that were expressed in LCNEC more than in SCLC and OLC with high probabilities. These proteomic findings using the limited scale of patients were confirmed by routine immunohistochemitry with additional patients [37]. CD44 is a cell-surface glycoprotein which relates to cell-cell interactions including adhesion and migration, and thus to tumor growth and progression [50]. Those proteins, ALDH1A1 [51,52], AK1C1 [53], AK1C3 [54] and CD44 [55], were proposed to be the markers of cancer stem cells. Their expression in tumor cells could correlate with their aggressive biological behavior, drug resistance and poor prognosis, which are common characteristics of LCNEC and SCLC. Previous studies suggested that these redox enzymes were present in a variety of malignant tumor cells. In particular, AK1C1, and AK1C3 are reported in human non-small cell lung carcinoma (A549) cells [56], and a high expression of ALDH1A1 in lung cancer cell lines, especially in AC cell lines compared to OLC and SCLC cell lines [57-59].
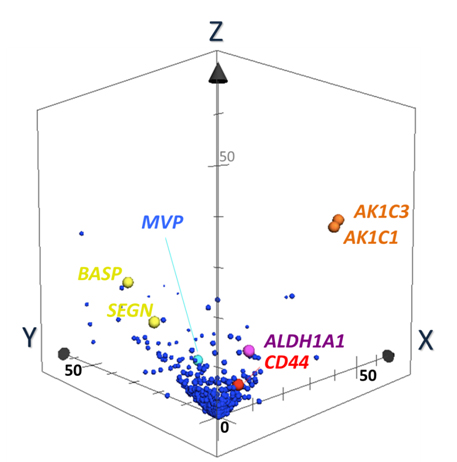
Figure 5. The 3-dimensional (D) scatter plot for evaluation of biomarker candidates by pairwise G statistics. X, Y, Z-axis shows G-values (X: LCNEC vs. LCC; Y: LCC vs. SCLC; Z: LCNEC vs. SCLC). Data point sets from 1,918 proteins were plotted with circles. AK1C1 and AK1C3 (orange), ALDH1A1 (purple) and CD44 (red) Proteins being located very near or on X-Z plane are isolated as candidates of specific LCNEC markers. SEGN (yellow) were located on Y-Z plane, which was already known as one of SCLC-specific markers [37].
Semi-quantitations of ALDH1A1 by utilizing the selected-reaction monitoring (SRM) mass spectrometric method has been examined in comparison with its antibody-based %-immuno staining measurements, where both data were obtained from FFPE tissue specimens belonging to a corresponding patient. Figure 6 shows the plot of SRM AUCs against antibody-based % -values of immunostaining on ALDH1A1 for 14 cases throughout the three subtypes: LCNEC (n=4), OLC (n=5), and SCLC (n=5). Therein, all tissues of SCLC group showed zero-% values of ALDH1A1 antibody immunostainng although the LCNEC group gave %-antibody immunostaining higher than 30%. Moreover, the reasonably good correlation (R2 > 0.87) observed between those two different assays confirmed that ALDH1A1 is a promising candidate characteristic to LCNEC.
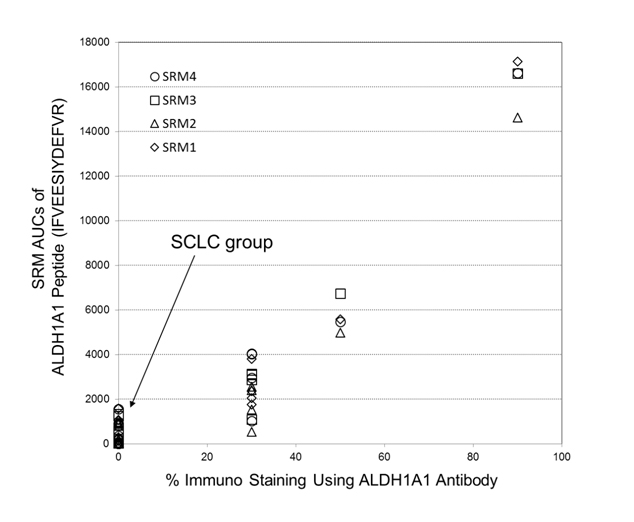
Figure 6. A plot of SRM AUCs for ALDH1A1 against its % -values of immunostaining (14 cases: LCNEC, n = 4; LCC, n = 5; SCLC, n = 5). Herein, four SRM transitions for its peptide, IFVEESIYDEFVR, (SRM transistion 1: m/z 823.4 (2+) → m/z 1028.5 (1+); SRM transition 2: m/z 823.4 (2+) → m/z 1157.5 (1+); SRM transition 3: m/z 823.4 (2+)→ m/z 1286.6 (1+); SRM transition 4: m/z 823.4 (2+) → m/z 1385.7 (1+)) were used.
BASP1, a biomarker candidate for SCLC, is a potential tumor suppressor [60] suggests that different mechanisms of tumor growth could operate between LCNEC and SCLC. Another SCLC-specific SEGN is a novel neuroendocrine marker that has a distinct expression pattern with being negative in LCNEC, and with the reported rate for positive staining in SCLC [61]. It is recently reported that ALDH1A1 plays an important role in Notch pathway [62]. Though there has been no effective chemotherapy to LCNEC, Sorafenib, a tyrosine kinase inhibitor in the MAP kinase pathway, is effective to malignant tumor cells with ALDH1A [63].
Protein-protein interaction networks in lung adenocarcinoma subtypes
As described in “Introducion”, lepidic type adenocarcinomas (ACs) are constituted by three subtypes; adenocarcinoma in situ (AIS), minimally invasive adenocarcinoma (MIA) and lepidic predominant invasive adenocarcinoma (LEP). Although these subtypes are speculated to show sequential progression from preinvasive lesion to invasive lung cancer, changes of protein expressions during these processes have not been fully studied yet. From cancerous cells laser-microdissected from FFPE AC tissues a total of 840 proteins were identified by proteomic analysis. Spectral counting-based semi-quantitative comparisons of all identified proteins through AIS to LEP have revealed that the protein expression profile of LEP was significantly differentiated from other subtypes. LEP-type marker candidates included HPX, CTTN, CDH1, EGFR, and MUC1. Protein candidates for MIA-type marker included CRABP2, and those for AIS-type marker included LTA4H and SOD2 [64].
The most important information is how proteins expressed significantly in disease subtype interplay with other key proteins and pathways to evaluate biomarker candidates and therapeutic targets. Several open PPI databases are available; current versions include Reactome [65] and BioGRID [66], and PPI network analysis can be performed by designated network construction algorithms, using, for example, the Search Tool for the Retrieval of Interacting Genes/Proteins (STRING) database [67] and the Cytoscape, a software environment for integrated models of biomolecular interaction networks [68]. PPI networks elucidated so far consist of nodes and edges, where nodes are proteins experimentally identified, and edges are the predicted functional associations based on primary databases comprising the Kyoto Encyclopedia of Genes and Genomes (KEGG) and gene ontology (GO) [69], the primary literature, and so on. Thus, it has become possible to elucidate protein networks relevant to a disease subtype using its proteomic datasets. The concept of biomarkers has been changing from conventional biomarkers—single proteins—to specific protein networks or dynamically varying networks [70], since diseases can be regarded also as dynamic network disorders. PPI networks dynamically activated or deactivated in a disease subtype of interest would be directly associated with its responsible molecular mechanisms, which would lead to discovery of therapeutic and druggable targets.
The STRING gene set enrichment (GSE) resulted from the PPI network analysis suggested that AIS was rather associated with pathways of focal adhesion, adherens junction, tight junction and leukocyte transendothelial migration, that MIA had a strong association predominantly with pathways of proteoglycans in cancer and with PI3K-Akt. In contrast, LEP was associated broadly with numerous tumor-progression pathways including ErbB, Ras, Rap1 and HIF-1 signalings.
Figure 7 shows the STRING PPI networks for A) MIA and B) LEP developed from the respective proteome datasets obtained [64]. Proteoglycans are known to be important molecular effectors of cell surface and pericellular microenvironments and to have multiple functions in cancer and angiogenesis by interacting with both ligands and receptors that regulate neoplastic growth and neovascularization [71]. Molecules participating in the proteoglycan-related cancer pathway were denoted by red circles in figure 7A. The ErbB signaling pathway is associated with several cancer pathways. The ErbB family represents epidermal growth factor receptors, which play an important role in tumor growth. Overexpression of EGFR occurs in around 60% NSCLCs, with patients with AC having the highest frequency [72]. Hypoxia-inducible factors (HIFs) regulate the transcription of genes that mediate the response to hypoxia (reduced O2 availability) [73]. Diverse products of HIF-1 action such as induction of the Met protein, hepatocyte growth factor, followed by Met receptor activation, may result in the poor prognosis associated with hypoxic tumors, which are indeed more aggressive than their well-oxygenated counterparts. Molecules participating in the ErbB and HIF-1 signaling pathways are denoted by orange and red circles in Figure 7B, respectively [64]. Figure 7C illustrates the results of the STRING gene set enrichments for LEP, MIA, and AIS obtained for the 24 cancer-related KEGG pathways, which were elucidated with their significance rank p < 0.05 after correction by false discovery rate (FDR) [64]. It was revealed how functional participation of expressed proteins alters dramatically throughout disease stages, reflecting the mechanisms of disease progression.
Figure 7. The STRING PPI networks elucidated for A) MIA and B) LEP from the respective proteome datasets, which were obtained from the clinical proteomic analytical study of the cancerous cells laser-microdissected (LMD) from lung cancer FFPE-tissue specimens, and C) results of the STRING gene set enrichments (GSEs) for LEP, MIA, and AIS obtained against the 24 cancer-related KEGG pathways (significance rank p < 0.05 after correction by FDR), which revealed how functional participations of expressed proteins alter dramatically throughout disease stages, which reflected mechanisms of disease progression [64].
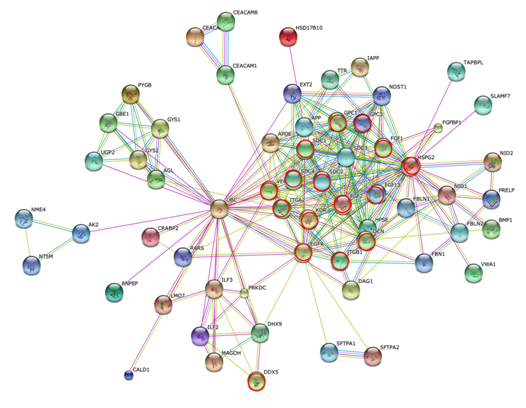
Figure 7A).
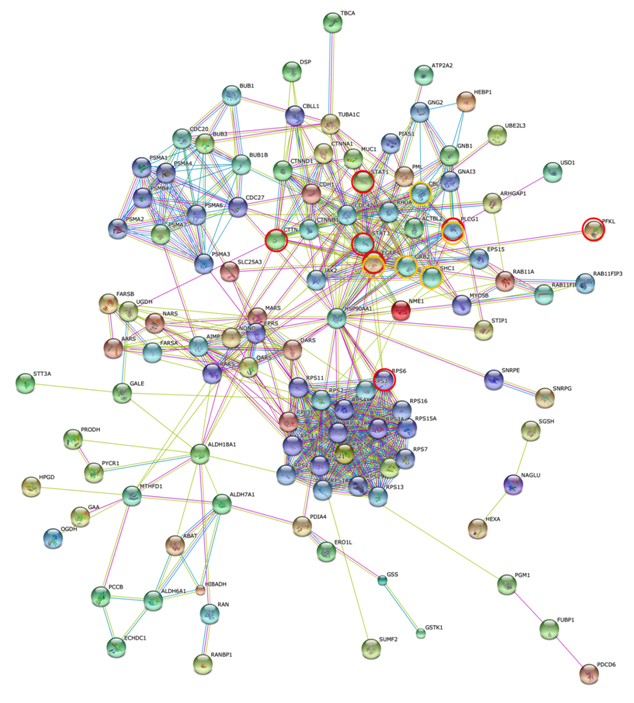
Figure 7B).
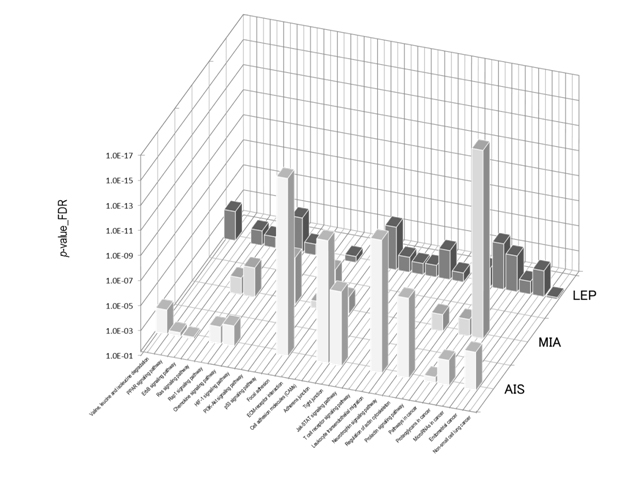
Figure 7C).
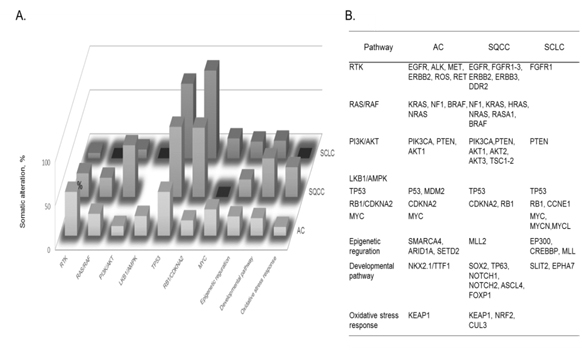
Figure 8. A) Cellular pathways affected by somatic alterations, and B) genes involved in each type of lung cancer are listed in order of the frequency of alterations found: adenocarcinoma, AC; squamous cell carcinoma, SQCC; small-cell lung carcinoma, SCLC [72].
Somatic mutations and cellular pathways
The identification of recurrent mutations in EGFR and fusions involving ALK and other receptor tyrosine kinases has greatly transformed the standard of treatment of patients with lung ACs. Current guidelines recommended the molecular genotyping of ACs to routinely include the EGFR and ALK status, alterations which are found to exist in ca. 25% of patients with AC who benefit more from approved targeted inhibitor therapies than from conventional chemotherapy. Such somatic alterations, mutations, and fusions in lung cancers frequently affect cellular pathway activities involved in lung cancer subtypes. Fig. 8 summarizes cellular pathways, the activities of which are affected by somatic alterations in lung cancer subtypes, namely AC, squamous cell carcinoma, and SCLC [72]. It should be noted that both somatic mutations and cellular pathways in disease subtypes are mutually intrinsically connected, and so both are needed to be unveiled to understand molecular mechanisms of a disease subtype. In lung cancer, numerous genes acquire mutations which frequently involve EGFR and KRAS, and unavailability of drugs or resistance to the available drugs is the major problem. For an instance, it is an attractive strategy that SCLC cells accompanied by mutated EGF receptors and become addicted to AKT/PKB signals can be fell into apoptosis by depriving these signals.
Summary and perspectives
The clinical proteomic analysis of lung cancer subtypes demonstrated its feasible technology to reveal their characteristic protein expressions, among which ALDH1A1, AK1C1, AK1C3, and CD44 would be characteristic to the LCNEC phenotype whereas BASP1, SEGN and CD56 would be for SCLC. They would be useful targets to immunohistochemically distinguish LCNEC from SCLC and OLC. Reagarding to lung ACs subtypes, the molecular biological background predisposing the worse prognosis of LEP compared with AIS and MIA may be in part due to the forms of altered protein expressions found. Proteins appearing in the step from AIS to MIA are probably important at the initial step of microinvasion. As LEP prepares characteristics of matured lung cancer, it is reasonable that LEP expresses a variety of proteins associated with cancer invasion. Some of these proteins would be candidates for molecular target therapy to suppress local invasion or distant metastases. In the new adenocarcinoma subtyping, prognoses of solid or micropapillary predominant invasive adenocarcinomas were reported to be apparently worse than these of other subtypes including lepidic type adenocarcinomas [16,74,75]. Clinical proteomic analyses will contribute to elucidate protein expressions determining malignant grade of various lung adenocarcinoma subtypes, which will further provide important knowledge to understand the carcinogenetic process and tumor lineages of lung adenocarcinomas for the benefit of patients with more efficient diagnosis and treatment of these tumors.
In this decade drug has been frequently found to indicate its efficacy different by races and patients’s groups, and so driver mutations specific to each race and/or patients’ groups have been actively investigated. Both protein–protein interaction (PPI) networks and cellular pathways affected by key somatic mutations should be investigated in relation to a subgroup of lung cancer patients with acquired resistance. Thus, the MS-based proteomic approach utilizing clinical specimens would make it possible to reveal molecular networks relevant to a disease subgroup, drug responders or nonresponders, good or poor prognosis, drug resistance, and which will provide a powerful solution in stratification of patients and target discovery. In Japan, clinical specimens with detailed clinical and pathological information and in high quality have been archived for many years within medical institutes and hospitals owing to the national healthcare system, and include even early stage lung cancers. When a distinct clinical study design using the valuable clinical samples, so as to say national assets, is established and conducted by partnering scrupulously with clinicians, an innovative treatment and target/drug discovery for lung cancer can be delivered from Japan.
References
- Jemal A, Bray F, Center MM, Ferlay J, Ward E, et al. (2011) Global cancer statistics. CA Cancer J Clin61: 69-90.[Crossref]
- The data base of Japanese Ministry of Health, Labor and Welfare.[http:// www.mhlw.go.jp/toukei/saikin/hw/jinkou/geppo/nengai09/kekka3.html].
- The data base of National Cancer Institute at the National Institute of Health.[http://www.cancer.gov/cancertopics/types/lung].
- Nakamura H, Saji H (2014) Worldwide trend of increasing primary adenocarcinoma of the lung. SurgToday44: 1004-1012.[Crossref]
- Koike T, Yamato Y, Asamura H, Tsuchiya R, Sohara Y, et al. (2009) Improvements in surgical results for lung cancer from 1989 to 1999 in Japan. J ThoracOncol4: 1364-1369.[Crossref]
- National Lung Screening Trial Research Team, Aberle DR, Adams AM, Berg CD, Black WC, et al. (2011) Reduced lung-cancer mortality with low-dose computed tomographic screening. N Engl J Med365: 395-409.[Crossref]
- Travis WD, Linnoila RI, Tsokos MG, Hitchcock CL, Cutler GB Jr, et al. (1991) Neuroendocrinetumors of the lung with proposed criteria for large-cell neuroendocrine carcinoma. An ultrastructural, immunohistochemical, and flow cytometric study of 35 cases. Am J SurgPathol15:529-553. [Crossref]
- Brambilla E, Ishika2021 Copyright OAT. All rights reservJ, Travis WD. et al. (2015) Large cell neuroendocrine carcinoma.In: Travis WD, Brambilla E, Burke AP, Marx A, Nicholson AG (Eds.). WHO classification of tumours of the lung, pleura, thymus and heart. (4thedn). Lyon: International agency for research on cancer (IARC): 69-72.
- Dresler CM, Ritter JH, Patterson GA, Ross E, Bailey MS, et al. (1997) Clinical-pathologic analysis of 40 patients with large cell neuroendocrine carcinoma of the lung. Ann ThoracSurg63: 180-185.[Crossref]
- Battafarano RJ, Fernandez FG, Ritter J, Meyers BF, Guthrie TJ, et al. (2005) Large cell neuroendocrine carcinoma: an aggressive form of non-small cell lung cancer. J ThoracCardiovascSurg130: 166-172.[Crossref]
- Varlotto JM, Medford-Davis LN, Recht A, Flickinger JC, Schaefer E, et al. (2011) Should large cell neuroendocrine lung carcinoma be classified and treated as a small cell lung cancer or with other large cell carcinomas? J ThoracOncol6: 1050-1058.[Crossref]
- Travis WD (2010) Advances in neuroendocrine lung tumors. Ann Oncol21: vii65-71.[Crossref]
- Travis WD, Brambilla E, Noguchi M, Nicholson AG, Geisinger KR, et al. (2011) International association for the study of lung cancer/american thoracic society/european respiratory society international multidisciplinary classification of lung adenocarcinoma. J Thoracic Oncol6:244-285.[Crossref]
- Yoshizawa A, Motoi N, Riely GJ, Sima CS, Gerald WL, et al. (2011) Impact of proposed IASLC/ATS/ERS classification of lung adenocarcinoma: prognostic subgroups and implications for further revision of staging based on analysis of 514 stage I cases. Mod Pathol24: 653-664.[Crossref]
- Yoshizawa A, Sumiyoshi S, Sonobe M, Kobayashi M, Fujimoto M, et al. (2013) Validation of the IASLC/ATS/ERS lung adenocarcinoma classification for prognosis and association with EGFR and KRAS gene mutations: analysis of 440 Japanese patients. J ThoracOncol8: 52-61.[Crossref]
- Gu J, Lu C, Guo J, Chen L, Chu Y, et al. (2013) Prognostic significance of the IASLC/ ATS/ERS classification in Chinese patients-A single institution retrospective study of 292 lung adenocarcinoma. JSurgOncol107: 474-480.[Crossref]
- Fehniger TE, Marko-Varga G (2010) Proteomics and disease revisited: the challenge of providing proteomic tools into clinical practice. J Proteome Res9: 1191-1192.[Crossref]
- Nishimura T, Tojo H (2014) Mass spectromery-based protein sequencing platforms, Chapter 5.In: Genomics and proteomics for clinical discovery and development. Marko-Varga G, Editor. (Translational bioinformatics 6, Series Editor, Wang X), Dordrecht, Springer: 69-99.
- Lange V, Picotti P, Domon B, Aebersold R (2008) Selected reaction monitoring for quantitative proteomics: a tutorial. MolSystBiol4: 222.[Crossref]
- Kawamura T, Nomura M, Tojo H, Fujii K, Hamasaki H, et al. (2010) Proteomic analysis of laser-microdissected paraffin-embedded tissues: (1) Stage-related protein candidates upon non-metastatic lung adenocarcinoma. J Proteomics73: 1089-1099.[Crossref]
- Nishimura T, Nomura M, Tojo H, Hamasaki H, Fukuda T, et al. (2010) Proteomic analysis of laser-microdissected paraffin-embedded tissues: (2) MRM assay for stage-related proteins upon non-metastatic lung adenocarcinoma. J Proteomics73: 1100-1110.[Crossref]
- Old WM, Meyer-Arendt K, Aveline-Wolf L, Pierce KG, Mendoza A, et al. (2005) Comparison of label-free methods for quantifying human proteins by shotgun proteomics. Mol Cell Proteomics4: 1487-1502.[Crossref]
- Zybailov B, Coleman MK, Florens L, Washburn MP (2005) Correlation of relative abundance ratios derived from peptide ion chromatograms and spectrum counting for quantitative proteomic analysis using stable isotope labeling. Anal Chem77:6218-6224.[Crossref]
- Fu X, Gharib SA, Green PS, Aitken ML, Frazer DA, et al. (2008) Spectral index for assessment of differential protein expression in shotgun proteomics. J Proteome Res7: 845-854.[Crossref]
- Braisted JC, Kuntumalla S, Vogel C, Marcotte EM, Rodrigues AR, et al. (2008) The APEX Quantitative Proteomics Tool: generating protein quantitation estimates from LC-MS/MS proteomics results. BMC Bioinformatics9: 529.[Crossref]
- McIlwain S, Mathews M, Bereman MS, Rubel EW, MacCoss MJ, et al. (2012) Estimating relative abundances of proteins from shotgun proteomics data. BMC Bioinformatics13: 308.[Crossref]
- Végvári Á, Rezeli M, Döme B, Fehniger TE, Marko-Varga G (2011) In: Translation Science for Targeted Personalized Medicine Treatments in Selected presentations from the 2011 Sino-American Symposium on Clinical and Translational Medicine, Science/AAAS. S. Sanders Edn, Washington, DC: 36-37.
- Marko-Varga G (2011) BioBanking - The Holy Grail of novel drug and diagnostic developments? J ClinBioinforma 1: 14.[Crossref]
- Marko-Varga G, Végvári Á, Welinder C, Lindberg H, Rezeli M, et al. (2012) Standardization and utilization of biobank resources in clinical protein science with examples of emerging applications. JProteome Res11: 5124-5134.[Crossref]
- Malm J, Végvári A, Rezeli M, Upton P, Danmyr P, et al. (2012) Large scale biobanking of blood - the importance of high density sample processing procedures. J Proteomics76.[Crossref]
- LaBaer J (2012) Improving international research with clinical specimens: 5 achievable objectives. JProteome Res11: 5592-5601.[Crossref]
- Végvári A, Welinder C, Lindberg H, Fehniger TE, Marko-Varga G (2011) Biobank resources for future patient care: developments, principles and concepts. J ClinBioinforma1: 24.[Crossref]
- Prieto DA, Hood BL, Darfler MM, Guiel TG, Lucas DA, et al. (2005) Liquid Tissue: proteomic profiling of formalin-fixed tissues. Biotechniques: 32-35.[Crossref]
- Hood BL, Darfler MM, Guiel TG, Furusato B, Lucas DA, et al. (2005) Proteomic analysis of formalin-fixed prostate cancer tissue. Mol Cell Proteomics4: 1741-1753.[Crossref]
- Wisniewski JR, Ostasiewicz P, Mann M (2011) High recovery FASP applied to the proteomic analysis of microdissected formalin fixed paraffin embedded cancer tissues retrieves known colon cancer markers. J Proteome Res10: 3040-3049.[Crossref]
- Kawamura T, Nomura M, Tojo H, Fujii K, Hamasaki H, Mikami S et al. (2010) Proteomic analysis of laser-microdissected paraffin-embedded tissues: (1) Stage-related protein candidates upon non-metastatic lung adenocarcinoma. J Proteomics73: 1100-1110.[Crossref]
- Nomura M, Fukuda T, Fujii K, Kawamura T, Tojo H, et al. (2011) Preferential expression of potential markers for cancer stem cells in large cell neuroendocrine carcinoma of the lung. An FFPE proteomic study. J Clin Bioinformatics1: 23.[Crossref]
- Marko-Varga G, Végvári A, Welinder C,Lindberg H,Rezei M, et al. (2012) Standardization and utilization of biobank resources in clinical protein science with examples of emerging applications.JProteome Res11:5124-5134.[Crossref]
- Nakamura K, Nishio K, NishimuraT (2012) Clinical Proteomics (Editor: Kato H), Kanehara& Co., Tokyo.
- Michalski A, Cox J, Mann M (2011) More than 100,000 detectable peptide species elute in single shotgun proteomics runs but the majority is inaccessible to data-dependent LC-MS/MS. J ProteomeRes10: 1785-1793.[Crossref]
- Panchaud A, Jung S, Shaffer SA, Aitchison JD, Goodlett DR (2011) Faster, quantitative, and accurate precursor acquisition independent from ion count. Anal Chem83: 2250-2257.[Crossref]
- Geiger T, Cox J, Mann M (2010) Proteomics on an Orbitrapbenchtop mass spectrometer using all-ion fragmentation. Mol Cell Proteomics9: 2252-2261.[Crossref]
- Gillet LC, Navarro P, Tate S, Röst H, Selevsek N, et al. (2012) Targeted data extraction of the MS/MS spectra generated by data-independent acquisition: A new concept for consistent and accurate proteome analysis. Mol Cell Proteomics11.[Crossref]
- Bern M, Finney G, Hoopmann MR, Merrihew G, Toth MJ, et al. (2010) Deconvolution of mixture spectra from ion-trap data-independent-acquisition tandem mass spectrometry. Anal Chem82: 833-841.[Crossref]
- Barrett T, Suzek TO, Troup DB, Wilhite SE, Ngau WC, et al. (2005) NCBI GEO: mining millions of expression profiles--database and tools. Nucleic Acids Res33: D562-566.[Crossref]
- Gorshkov V, Verano-Braga T, Kjeldsen F (2015) SuperQuant: A Data Processing Approach to Increase Quantitative Proteome Coverage. Anal Chem87: 6319-6327.[Crossref]
- Hartl M, Nist A, Khan MI, Valovka T, Bister K (2009) Inhibition of Myc-induced cell transformation by brain acid-soluble protein 1 (BASP1). ProcNatlAcadSci U S A106: 5604-5609.[Crossref]
- Green LM, Wagner KJ, Campbell HA, Addison K, Roberts SGE (2009) Dynamic interaction between WT1 and BASP1 in transcriptional regulation during differentiation. Nucleic Acids Res37: 431-440.[Crossref]
- Goodfellow SJ, Rebello MR, Toska E, Zeef LA, Rudd SG, et al. (2011) WT1 and its transcriptional cofactor BASP1 redirect the differentiation pathway of an established blood cell line. Biochem J 435: 113-125.[Crossref]
- Aruffo A, Stamenkovic I, Melnick M, Underhill CB, Seed B (1990) CD44 is the principal cell surface receptor for hyaluronate. Cell 61: 1303-1313.[Crossref]
- Jiang F, Qiu Q, Khanna A, Todd NW, Deepak J, et al. (2009) Aldehyde dehydrogenase 1 is a tumor stem cell-associated marker in lung cancer. Mol Cancer Res7: 330-338.[Crossref]
- Deng S, Yang X, Lassus H, Liang S, Kaur S, et al. (2010) Distinct expression levels and patterns of stem cell marker, aldehyde dehydrogenase isoform 1 (ALDH1), in human epithelial cancers. PLoS One5:e10277.[Crossref]
- Seo DC, Sung JM, Cho HJ, Yi H, Seo KH, et al. (2007) Gene expression profiling of cancer stem cell in human lung adenocarcinoma A549 cells. Mol Cancer6: 75.[Crossref]
- Pfeiffer MJ, Smit FP, Sedelaar JP, Schalken JA (2011) Steroidogenic enzymes and stem cell markers are upregulated during androgen deprivation in prostate cancer. Mol Med17: 657-664.[Crossref]
- Rudzki Z, Jothy S (1997) CD44 and the adhesion of neoplastic cells. MolPathol50: 57-71.[Crossref]
- Palackal NT, Lee SH, Harvey RG, Blair IA, Penning TM (2002) Activation of polycyclic aromatic hydrocarbon trans-dihydrodiol proximate carcinogens by human aldo-ketoreductase (AKR1C) enzymes and their functional overexpression in human lung carcinoma (A549) cells. J BiolChem277:24799-24808.[Crossref]
- Sreerama L, Sladek NE (1997) Class 1 and class 3 aldehyde dehydrogenase levels in the human tumor cell lines currently used by the National Cancer Institute to screen for potentially useful antitumor agents. AdvExp Med Biol414:81-94.[Crossref]
- Moreb JS, Zucali JR, Ostmark B, Benson NA (2007) Heterogeneity of aldehyde dehydrogenase expression in lung cancer cell lines is revealed by Aldefluor flow cytometry-based assay. Cytometry BClinCytom72:281-289.[Crossref]
- Patel M, Lu L, Zander DS, Sreerama L, Coco D, et al. (2008) ALDH1A1 and ALDH3A1 expression in lung cancers: correlation with histologic type and potential precursors. Lung Cancer59: 340-349.[Crossref]
- Hartl M, Nist A, Khan MI, Valovka T, Bister K (2009) Inhibition of Myc-induced cell transformation by brain acid-soluble protein 1 (BASP1). ProcNatlAcadSci U S A106: 5604-5609.[Crossref]
- Lai M, Lü B, Xing X, Xu E, Ren G, Huang Q (2006) Secretagogin, a novel neuroendocrine marker, has a distinct expression pattern from chromogranin A. Virchows Arch449:402-409.[Crossref]
- Sullivan JP, Spinola M, Dodge M, Raso MG, Behrens C, et al. (2010) Aldehyde dehydrogenase activity selects for lung adenocarcinoma stem cells dependent on notch signaling. Cancer Res70: 9937-9948.[Crossref]
- Rausch V, Liu L, Kallifatidis G, Baumann B, Mattern J, et al. (2010) Synergistic activity of sorafenib and sulforaphane abolishes pancreatic cancer stem cell characteristics. Cancer Res70: 5004-5013.[Crossref]
- Kato Y, Nakamura H, Tojo H, Nomura M, Nagao T, et al. (2015) A proteomic profiling of laser-microdissected lung adenocarcinoma cells of early lepidic-types. ClinTranslMed4:24. [Crossref]
- Reactome Pathway Database.[www.reactome.org]
- BioGRID-The Biological General Repository for Interaction Datasets.[http://thebiogrid.org]
- STRING-The Search Tool for the Retrieval of Interacting Genes/Proteins database.[http://string-db.org]
- Cytoscape - An open source software platform for visualizing complex networks and integrating these with any type of attribute data.[http://www.cytoscape.org]
- (2016) Kyoto Encyclopedia of Genes and Genomes, KEGG PATHWAY Database.[http://www.genome.jp/kegg/pathway.html]
- Wu X, Fang X, Zhu Z, Wang X (2014) Clinical bioinforatics: A new emerging science of biomarker development.In: Marko-Varga G (Eds.), Genomics and Proteomics for Clinical Discovery and Development, (Translational Bioinformatics 6: Wang X (Series Edit.)), Dordrecht, Springer: 175-191.
- Iozzo RV, Sanderson RD (2011) Proteoglycans in cancer biology, tumour microenvironment and angiogenesis. J Cell Mol Med15: 1013-1031.[Crossref]
- Shtivelman E, Hensing T, Simon GR, Dennis PA, Otterson GA, et al. (2014) Molecular pathways and therapeutic targets in lung cancer. Oncotarget5: 1392-1433.[Crossref]
- Semenza GL (2010) Defining the role of hypoxia-inducible factor 1 in cancer biology and therapeutics. Oncogene29: 625-634.[Crossref]
- Tsuta K, Kawago M, Inoue E, Yoshida A, Takahashi F, et al. (2013) The utility of the proposed IASLC/ATS/ERS lung adenocarcinoma subtypes for disease prognosis and correlation of driver gene alterations. Lung Cancer81: 371-376.[Crossref]
- Song Z, Zhu H, Guo Z, Wu W, Sun W, et al. (2013) Prognostic value of the IASLC/ATS/ERS classification in stage I lung adenocarcinoma patients–based on a hospital study in China. Eur J SurgOncol39:1262-1268.[Crossref]