Body composition (BC) estimations are strongly recommended in nutrition, metabolic and obesity research. It has an advantage over body mass index (BMI) in quantifying the distribution of its components in the body. This investigation was designed to assess the prevalence of overweight/obesity and the risk groups that are associated with excess body fat. Two hundred seventy seven (277), preclinical, 86 male and 191 female age matched students (mean 19.7 ± 1.9 years) were included in the study. BMI, body fat, skeletal muscle mass and their bodily distribution were recorded by using an electronic body composition analyzer. The subjects were divided into undernourished (UN=BMI<18.5 kg/m2), normal (N=BMI>18.5–22.9 kg/m2) and overweight/obese (ow/ob=BMI>23 kg/m2) groups based on BMI cut off values for Asians. The data analyzed showed that 47.7% of the male (mean BMI =26.9 ± 0.5 kg/m2) and 31% of the female (mean BMI =27.1 ± 0.5 kg/m2) were ow/ob. The total body fat was high at 23.9 ± 0.6% and 34.1 ± 0.5% in ow/ob males and females respectively as compared to other groups. The subcutaneous fat was more in the arms and legs than in the trunk area in both males and females. The visceral fat was slightly high in the ow/ob males (mean; 10.6 ± 0.5) whereas ow/ob females had normal levels at 7.1 ± 0.5. The skeletal muscle mass was about 32.5 ± 0.3% in ow/ob males and 24.4 ± 0.2% in ow/ob females which was slightly less than the recommended values. The leg area had more muscle mass than other areas. The data supports the view that ow/ob is increasing as compared to previous reports of 25% for the Malaysian population. The ow/ob male had developed more health risks as observed with higher visceral fat suggesting very strongly that the young subjects follow poor health behavior and life style practices.
overweight, obesity, body fat, visceral fat, body composition, body mass index
Obesity which is now considered as a disease has become pandemic. It is variously referred to as ‘globesity’ by WHO in 2001 to indicate its widespread prevalence; ‘diabesity’ to describe its close relevance to diabetes mellitus and as a mild chronic inflammatory state of the adipose tissue [1,2]. Obesity was considered as one of the most serious health risk factors but it has jumped to position one in the recent years. Obesity threatens the well being of humans as it is responsible for reducing the quality of life with increased incidence of cardiovascular diseases and type 2 diabetes, and some type of cancers resulting in greater burden on the health care cost [3].
Malaysia is ranked sixth among Asian countries with high adult obesity rate and the number one in southeast Asian nations. It was reported that one in every seven Malaysian is obese, and it is more shocking when recent statistics showed that one in every three Malaysian is obese [4]. Furthermore, the NHMS findings are worrying as it revealed that 5.8 million Malaysians suffer from hypertension, 6.2 million have high blood cholesterol and 2.6 million are diabetics that is generally associated with obesity (together termed as metabolic syndrome) which are risk factors for heart failure. These factors have contributed to over 22,000 deaths annually and thus considered as the leading cause of death in Malaysia [5].
Good health is important for all and especially to medical students and healthcare personnel who should be role models in terms of health consciousness and sound life style practices. Obesity is common among the medical students and health care personnel all over the world including Malaysia [6-13]. A variety of factors are implicated as contributing factors [14]. For example, medical students’ life is hectic, strenuous and stressful that would necessitate changes in life style that may lead to the development of obesity and associated co-morbidities [15]. However, most studies in Malaysia have depended exclusively on BMI to evaluate obesity and cardiovascular and other health risks. But the relevance of BMI is strongly questioned in recent years [16,17]. Therefore, in the present study we have, in addition to BMI, evaluated the body fat and their regional distribution in the body since it is well related to the co-morbidities of obesity. Such variables have not been measured in previous studies.
Thus, the aims of the present study are a) to measure body composition, particularly body fat and skeletal muscle mass and their distribution in the body b) to evaluate the current ow/ob prevalence based on BMI standards for Asians and compare with body fat defined ow/ob and c) to address the risk groups that are associated with excess visceral fat since it is associated with metabolic disturbances.
Two hundred and seventy seven (277) {male: 86 and female: 191}, age matched (mean 19.7 ± 1.9 years); preclinical students of UniKL Royal College of Medicine, Perak, Malaysia were recruited for the study. Institute’s research ethical committee approval and the verbal consent from all the participants were obtained prior to the start of the study. Body height of each subject was measured by using a stadiometer nearest to 0.5 cm. Body weight, BMI, body fat, skeletal muscle mass and their distribution in different parts of the body and body age were recorded using Body Composition Monitor – HBF- 362 model (Karada Scan, Omron, Japan) that works on the principle of bioelectrical impedance. A well trained operator recorded the body composition variables of all subjects.
The subjects were divided into undernourished (UN = BMI<18.5 kg/m2), normal (N=BMI>18.5-22.9 kg/m2) and overweight/obese (ow/ob=BMI>23 kg/m2) groups based on BMI cut off points for Asian population [18]. Since we had limited number of overweight and obese subjects, the two were combined as one groups in the present study.
SPSS version 17.0 was used for statistical anlysis of the numerical data. ANOVA was applied for comprison of results from different groups and Student’s t test was employed for analysing the differences between genders. Level of significance was fixed at p<0.05. The results are expressed as Mean ± SEM.
Table 1 represents the frequency of BMI defined (for Asians and International standard) distributionof the subjects along with BMI related body fat%. It also shows the body fat measured by the body composition analyzer and graded from low to very high levels (can be related to UN, N and ow/ob groups)as well as the number of subjects in each category. As per the BMI standards for Asians, of the 86 male subjects, UN were 10, N were 35 and the rest 41 belonged to ow/ob group. Similraly, among the 191 females, 28 were UN, 104 were N and 59 were ow/ob subjects (Table 1). As compared with the international standards of BMI, the subjects distribution was different in each category, particularly in the N and ow/ob groups. Body fat based distribution of subjects also showed quite a variation especially in UN group. The body weight of ow/ob male subjects was 76.9 ± 1.7 kg as compared to 59.0 ± 0.9 kg and 49.2 ± 1.2 kg of N and UN subjects respectively. The body weight of ow/ob female subjects was 66.8 ± 1.4 kg as compared to 50.4 ± 0.5 kg and 43.9 ± 0.8 kg of N and UN subjects respectively. The average BMI of UN, N and ow/obsubjects was about 17.0 kg/m2, 20 kg/m2 and 27.0 kg/m2 respectively (Figure 1). All values were are statistically significant from each other (p<0.05).
Table 1. Asian and International standard BMI related body fat% and body composition analyser (BCA) estimated body fat% in UN, N and ow/ob subjects.
BMI criteria |
Male Mean ± SD |
|
Female Mean ± SD |
|
Asians |
Body fat% |
n |
% |
Body fat% |
n |
% |
<18.5 (UN) |
13.2 ± 4.6 |
10 |
11.6 |
23.5 ± 4.0 |
28 |
14.7 |
18.5 – 22.9 (N) |
15.0 ± 3.7 |
35 |
40.7 |
27.7 ± 3.2 |
104 |
54.4 |
>23 (ow/ob) |
23.7 ± 4.1 |
41 |
47.7 |
33.6 ± 3.8 |
59 |
30.9 |
International |
|
|
|
|
|
|
>18.5 (UN) |
13.2 ± 4.6 |
10 |
11.6 |
23.5 ± 3.9 |
29 |
15.2 |
18.5-25 (N) |
16.8 ± 4.5 |
47 |
54.7 |
28.6 ± 3.4 |
128 |
67.0 |
>25 (ow/ob) |
25.0 ± 3.9 |
29 |
33.7 |
35.8 ± 3.9 |
34 |
17.8 |
BCA Body fat (%) Male Female |
|
|
|
|
|
|
5-10 Low (UN) 5-20 |
9.38 ± 1.0 |
05 |
05.8 |
18.4 ± 1.1 |
08 |
04.2 |
10-20 Normal (N) 20-30 |
14.7 ± 2.8 |
38 |
44.2 |
26.6 ± 2.6 |
104 |
54.4 |
20-25 High (ow/ob) 30-35 |
24.3 ± 3.5 |
43 |
50.0 |
33.6 ± 3.4 |
79 |
41.4 |
25-50 Very high 35-50 (ow/ob) |
- |
- |
|
- |
- |
|
Body fat% was significantly different among the groups (p<0.05).
The results revelaed that 47.7% of the 86 male subjects were ow/ob while the 31% of the 191 females fell in that category with an average BMI of >27 kg/m2. The total body fat as measured by the body composition analyzer was 24.3% in the ow/ob male and 33.6% in the ow/ob female subjects (Figure 1). On the basis of body fat defined grouping, body fat was very high at 28% in the obese males (n:16) and was about 38% in the obese females (n:22) whereas the overweight males had 22% fat (n:27) and overweight females had 32% (n:56). The UN male had about 9% and the normal subjects had about 15% body fat while the female UN had about 18% and the normal had about 26% body fat. In general, the visceral fat was high in ow/ob subjects but slightly higher in ow/ob males (10.6) whereas the other groups had normal levels at <10. (Figure 2). The subcutaneous fat was higher in the females than the males and more in the arms and legs than in the trunk area in both males and females (Figure 3, Table 2). The skeletal muscle mass constituted about 33% in the ow/ob males and 25% in the ow/ob females which was slightly less than the recommended values. Understandably, the UN and N groups had higher skeletal muscle mass% (Figure 4). The leg area had more muscle mass than arm and trunk areas (Table 2). The other details of regional distribution of subcutaneous fat and skeletal muscle are shown in Table 2.
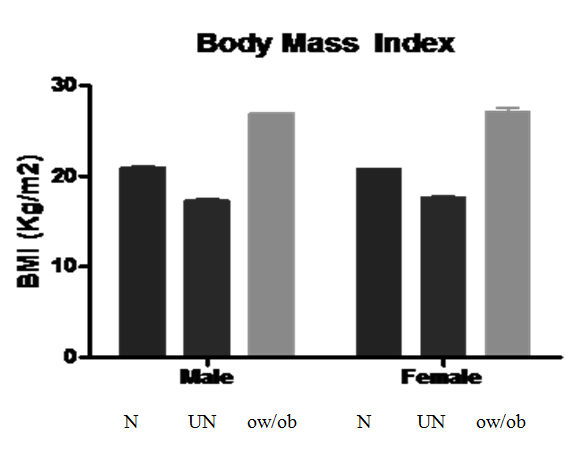
Figure 1. Bodymass index of N, UN and ow/ob subjects
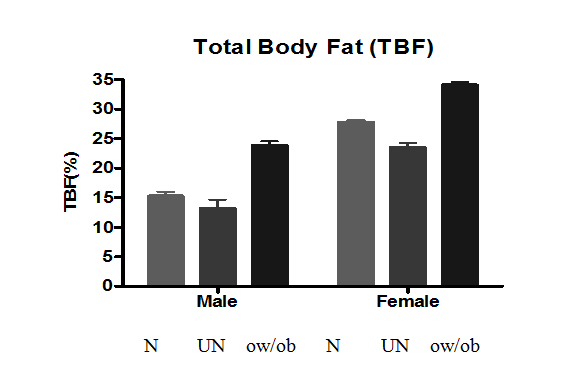
Figure 2. Bodymass index of N, UN and ow/ob subjects
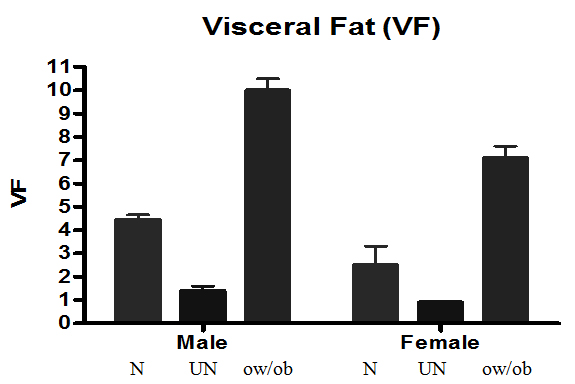
Figure 3. Bodymass index of N, UN and ow/ob subjects
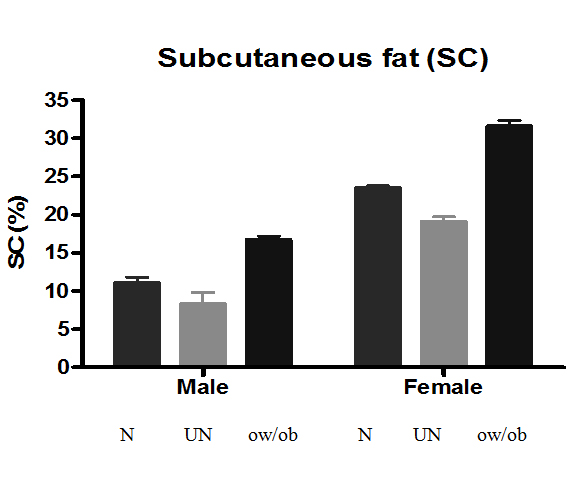
Figure 4. Bodymass index of N, UN and ow/ob subjects
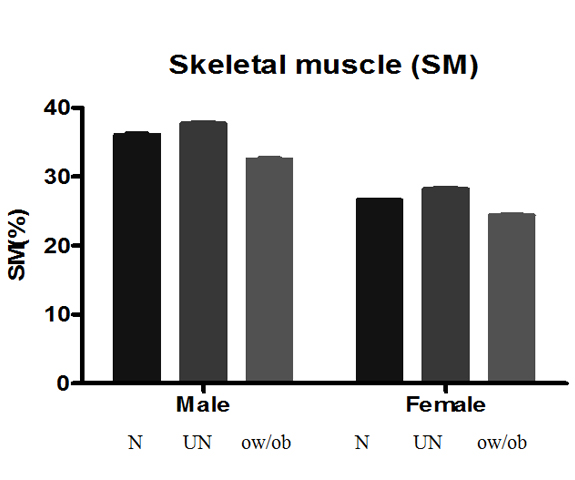
Figure 5. Bodymass index of N, UN and ow/ob subjects
Table 2. Regional distribution of subcutaneous fat and skeletal muscle in N, UN and ow/ob male and female subjects
Variable Subcutaneous fat (SCF) Skeletal muscle (SM) |
|
Male |
|
|
Female |
|
N |
UN |
ow/ob |
N |
UN |
ow/ob |
Trunk SCF |
9.2 ± 0.4 |
7.9 ± 0.8 |
15.5 ± 0.5 |
19.4 ± 0.2 |
14.9 ± 0.5 |
26.8 ± 0.6 |
Leg SCF |
16.2 ± 1.0 |
14.2 ± 2.1 |
23.5 ± 0.7 |
36.1 ± 0.4 |
31.0 ± 0.8 |
45.3 ± 0.9 |
Arm SCF |
17.2 ± 0.9 |
15.4 ± 1.8 |
23.7 ± 0.7 |
40.5 ± 0.5 |
36.0 ± 1.2 |
48.7 ± 0.8 |
Trunk SM |
30.4 ± 0.6 |
32.2 ± 1.0 |
25.6 ± 0.4 |
21.9 ± 0.1 |
23.9 ± 0.3 |
18.5 ± 0.3 |
Leg SM |
53.2 ± 0.4 |
54.6 ± 0.5 |
49.6 ± 0.6 |
38.4 ± 0.2 |
38.4 ± 0.5 |
37.2 ± 0.3 |
Arm SM |
41.7 ± 0.3 |
43.5 ± 0.4 |
38.3 ± 0.3 |
30.4 ± 0.2 |
33.6 ± 0.5 |
23.7 ± 0.6 |
As summary of Figures 1-5,BMI, total body fat, visceral fat, subcutaneous fat and skeletal muscle mass of normal, (N), undernourished (UN) and overweight/obese (ow/ob) male and female subjects. All values were significantly different (p<0.05) within the group and between geeders.
The obesity pandemic has also spread its tentacles to Malaysia and its prevalence is increasing as years pass by. A number of studies and a few timely reviews reported from Malaysia support this view [Mohamud, W.N.W., Musa, K.I., Khir, A.S.M., Ismail, A.A.S., et al. 2011; [20-30].
The Institute for Public Health under the Ministry of Health, Malaysia, conducted the first National Health and Morbidity Survey (NHMS) in 1986 and carries out similar surveys once in every ten years. Based on these reports, the prevalence of BMI defined overweight and obesity in subjects >18 years of age has escalated from 16.6% and 4.4% in 1996, to 29.1% and 14.0% in 2006 [23]. For example, a recent study in 2011 on 4428 adults aged >18 years from 5 different regions of Malaysia reported a prevalence of overweight and obesity to be 33.6% and 19.5% respectively. The study also reported that 22.5% of their female subjects and 14.1% of males were obese. And, more than 43% of the younger subjects in the study below 30 years of age were either overweight (20%) or obese (13.9%). The same group also noted a 3 fold increase in the prevalence diabetes and impaired glucose tolerance and poor blood pressure control [19]. Even the BMI defined prevalence of overweight (34.2%) and obesity (20.4%) in MySoN study was higher than that observed in previous Malaysian studies [27].
Health care profession is a great attraction from different viewpoints. Obesity related studies on medical students are rare but some studies show that obesity is a problem even in this population. For example, a Japanese study has reported an increasing trend in obesity from 1979-1991. Another report from Greece has shown that 4% men and 23% women had BMI >25 kg/m2.The study also revealed that 33% male and 22% female subjects had central obesity [8]. Similarly, a study from Sicily has shown that 13% male 13.6% female subjects were obese [10]. A recent study from Malaysia has recorded 30% ow/ob subjects among their medical students with a BMI over 23 kg/m2 [11]. It was earlier reported that overweight students in Malaysia was about 21% in 2001 which might reach 26.5% in 2015 whose predictions [28] have become true as supported by some recent reports including our study. Though, our findings agree with other studies on the increasing trend in ow/ob it differs with the findings that females had a higher rate of ow/ob than males. Our study points out that the ow/ob males were more in number as compared to females that is in agreement with another report [30]. Data on body age of the ow/ob male and female subjects in our study indicated that metabolic changes had already began at 20 years of age that would have occurred normally around 40 years of age. Such premature changes in metabolic status can probably be ascribed to higher body fat levels.
Though, BMI is considered as a surrogate measure of body fat, it can not predict the metabolic consequences, cardiovascular and other health risks associated with obesity [16]. Secondly, BMI cut-off values are different for Asians. Therefore, by considering the limitations of BMI, there is a need to gradually evolve beyond BMI towards standards based on actual measurements of body fat mass since BC is the final product of life style or health behavior and other related factors [31,32]. Hence, we resorted to study the ow/ob prevalence in our subjects by measuring the body composition, particularly body fat levels, in addition to BMI. Our study has revealed an astonishing level of 47.7% and 31% of ow/ob male and female subjects respectively as defined by BMI for Asians. Though, our data shows a very high prevalence of ow/ob as compared to 30% in Boo et al. study (2010), the figures of 30% overweight and 19% obesity as measured by body composition analyzer is comparable to another recent study [19]. Though, differences may arise because of the different methods of assessing overweight or obesity (BMI alone or body composition analysis), the results of the present study and other obesity related studies from Malaysia have to be given a more serious attention.This is particularly so where reports point out that the prevalence of obesity is higher in developing countries with cardiovascular diseases as the leading cause of death [World Health Organization (WHO)., 2000; [33] contributing to about 30% of deaths among adults in Malaysia [34]. Under the current situation, it is also to be noted that the WHO has estimated that in 2030, Malaysia would have a total number of 2.48 million diabetics compared to 0.94 million in 2000 which is another major risk associated with obesity [35].
These findings clearly reflect that there is an alarming growth of Malaysian adults who are over weight or obese over the years. The reasons that may be ascribed to this condition are rapid industrialization, urbanization, and marked socio-economic advancement in Malaysia over the last two decades that has brought about significant changes in life style and nutrition transition of communities. These include changes in the dietary patterns e.g. an increase in consumption of fats, oils and refined carbohydrates and a decreased intake of complex carbohydrates [36]. One should remember that the positive energy balance required for obesity to develop is just 10 calories per day in excess of what the body requires for weight maintenance will produce one pound (1Kg = 2.2 lbs) weight gain over one year [37]. And, the increase in obesity prevalence has also been related to an increasing sedentary lifestyle with less physical activities which occur not only in affluent countries, but also in developing countries [36]. If the problem can be addressed early and effectively, it not only ensures good health, quality of life for the individuals but also less financial burden on the government and improves the human capital and work force for the nation. The best way to achieve the goal in our experience is to adopt a policy of ‘push-n-pull’ regarding exercise (push oneself to more physical activity) and diet (pull away from calorie rich and junk foods) and any other means that keeps the mind and body healthy.
- Sims EA, Danforth E Jr, Horton ES, Bray GA, Glennon JA, et al. (1973) Endocrine and metabolic effects of experimental obesity in man. Recent Prog Horm Res 29: 457-496. [Crossref]
- Gregor MF, Hotamisligil GS (2011) Inflammatory mechanisms in obesity. Annu Rev Immunol 29: 415-445. [Crossref]
- Haslam DW, James WP (2005) Obesity. Lancet 366: 1197-1209. [Crossref]
- Malnick SD, Knobler H (2006) The medical complications of obesity. QJM 99: 565-579. [Crossref]
- Institute for Public Health (IPH). The Third National Health and Morbidity Survey (NHMS III) 2006, Nutritional Status. Ministry of Health, Malaysia; 2008.
- Kumar A, Ramiah S (2005) Anthropometric studies on students of the Nepal Medical College: elbow breadth. Kathmandu Univ Med J (KUMJ) 3: 345-348. [Crossref]
- Ohe K, Hachiy Y, Takahashi Y, Oda S (1992) The significance of obesity in UOEH medical students--multiple regression analysis of the annual physical checkup data in 1991. JUOEH 14: 279-288. [Crossref]
- Bertsias G, Mammas I, Linardakis M, Kafatos A (2003) Overweight and obesity in relation to cardiovascular disease risk factors among medical students in Crete, Greece. BMC Public Health 3: 3. [Crossref]
- Neser WB, Thomas J, Semenya K, Thomas DJ, Gillum RF (1986) Obesity and hypertension in a longitudinal study of black physicians: the Meharry Cohort Study. J Chronic Dis 39: 105-113. [Crossref]
- Abbate C, Giorgianni C, Munaò F, Beninato G, D'Arrigo G, et al. (2006) Evaluation of obesity in healthcare workers. Med Lav 97: 13-19. [Crossref]
- Boo NY, Chia GJ, Wong LC, Chew RM, Chong W, et al. (2010) The prevalence of obesity among clinical students in a Malaysian medical school. Singapore Med J 51: 126-132. [Crossref]
- Gopalakrishnan S, Ganeshkumar P, Prakash MV, Christopher, Amalraj V (2012) Prevalence of overweight/obesity among the medical students, Malaysia. Med J Malaysia 67: 442-444. [Crossref]
- Goonasegaran AR1, Nabila FN, Shuhada NS (2012) Comparison of the effectiveness of body mass index and body fat percentage in defining body composition. Singapore Med J 53: 403-408. [Crossref]
- Wilborn C, Beckham J, Campbell B, Harvey T (2005) Obesity: Prevalence, Theories, Medical Consequences, Management, and Research Directions. J Int Soc Sports Nutr 2: 34–31. [Crossref]
- Gupta S, Ray TG, Saha I (2009) Overweight, obesity and influence of stress on body weight among undergraduate medical students. Indian J Community Med 34: 255-257. [Crossref]
- Romero-Corral A, Montori VM, Somers VK, Korinek J, Thomas RJ, et al. (2006) Association of bodyweight with total mortality and with cardiovascular events in coronary artery disease: a systematic review of cohort studies. Lancet 368: 666-678. [Crossref]
- Yusuf S, Hawken S, Ounpuu S, Bautista L, Franzosi MG, et al. (2005) Obesity and the risk of myocardial infarction in 27,000 participants from 52 countries: a case-control study. Lancet 366: 1640-1649. [Crossref]
- Ministry of Health Malaysia & Academy of Medicine Malaysia (2003) Clinical Practise Guidelines on Management of Obesity.
- Mohamud WN, Musa KI, Khir AS, Ismail AA, Ismail IS, et al. (2011) Prevalence of overweight and obesity among adult Malaysians: an update. Asia Pac J Clin Nutr 20: 35-41. [Crossref]
- Mohamad WB, Mokhtar N, Mafauzy M, Mustaffa BE, Musalmah M (1996) Prevalance of obesity and overweight in northeastern peninsular Malaysia and their relationship with cardiovascular risk factors. Southeast Asian J Trop Med Public Health 27: 339-342. [Crossref]
2021 Copyright OAT. All rights reserv
- Rampal L, Rampal S, Khor GL, Zain AM, Ooyub SB, et al. (2007) A national study on the prevalence of obesity among 16,127 Malaysians. Asia Pac J Clin Nutr 16: 561-566. [Crossref]
- Ismail MN, Chee SS, Nawawi H, Yusoff K, Lim TO, et al. (2002) Obesity in Malaysia. Obes Rev 3: 203-208. [Crossref]
- Khambalia AZ, Seen LS (2010) Trends in overweight and obese adults in Malaysia (1996-2009): a systematic review. Obes Rev 11: 403-412. [Crossref]
- Chee HL, Kandiah M, Khalid M, Shamsuddin K, Jamaluddin J, et al. (2004) Body mass index and factors related to overweight among women workers in electronic factories in Peninsular Malaysia. Asia Pac J Clin Nutr 13: 248-254. [Crossref]
- Mazapuspavina MY, Daher AM, Nafiza MN, Ramli AS (2012) Overweight and Obesity in Malaysia: An Epidemiology Survey. J Hypertens 30: 220.
- Cheong SM, Kandiah M, Chinna K, Chan YM, Saad HA (2010) Prevalence of obesity and factors associated with it in a worksite setting in Malaysia. J Community Health 35: 698-705. [Crossref]
- Zaki M, Robaayah Z, Chan SP, Vadivale M, Lim TO (2010) Malaysia Shape of the Nation (MySoN): a primary care based study of abdominal obesity in Malaysia. Med J Malaysia 65 Suppl A: 143-149. [Crossref]
- Kee CC Jr, Jamaiyah H, Noor Safiza MN, Khor GL, Suzana S, et al. (2008) Abdominal Obesity in Malaysian Adults: National Health and Morbidity Survey III (NHMS III, 2006). Malays J Nutr 14: 125-135. [Crossref]
- Kasmini K, Idris MN, Fatimah A, Hanafiah S, Iran H, et al. (1997) Prevalence of overweight and obese school children aged between 7 to 16 years amongst the major 3 ethnic groups in Kuala Lumpur, Malaysia. Asia Pac J Clin Nutr 6: 172-174. [Crossref]
- Sidik SM, Ahmad R (2004) Childhood obesity: contributing factors, consequences and intervention. Malays J Nutr 10: 13-22. [Crossref]
- Gallagher D, Heymsfield SB, Heo M, Jebb SA, Murgatroyd PR, et al. (2000) Healthy percentage body fat ranges: an approach for developing guidelines based on body mass index. Am J Clin Nutr 72: 694-701. [Crossref]
- [No authors listed] (2000) Obesity: preventing and managing the global epidemic. Report of a WHO consultation. World Health Organ Tech Rep Ser 894: i-xii, 1-253. [Crossref]
- Hossain P, Kawar B, El Nahas M (2007) Obesity and diabetes in the developing world--a growing challenge. N Engl J Med 356: 213-215. [Crossref]
- Khoo KL, Tan H, Khoo TH (1991) Cardiovascular mortality in Peninsular Malaysia: 1950-1989. Med J Malaysia 46: 7-20. [Crossref]
- Mafauzy M (2006) Diabetes mellitus in Malaysia. Med J Malaysia 61: 397-398. [Crossref]
- Tee E Jr1 (1999) Nutrition of Malaysians: where are we heading ? Malays J Nutr 5: 87-109. [Crossref]
- Segal DG, Sanchez JC (2001) Childhood obesity in the year 2001. The Endocrinologist 11: 296-306.