Abstract
Inflammation is elevated in obese pregnant women and is associated with adverse maternal and neonatal outcomes. Maternal lipid metabolism and its relationships with maternal inflammation, insulin resistance and neonatal metabolic health are poorly understood in obese pregnant women.
18 lean (age: 26.1 ± 5.0 years, pre-pregnancy BMI: 21.5 ± 1.9 kg/m2) and 16 obese (age: 25.0 ± 4.8 years, pre-pregnancy BMI: 36.3 ± 4.3 kg/m2) women participated in this case-control study during the third trimester of pregnancy.Maternal plasma markers of insulin resistance (HOMA-IR) and inflammation (C-reactive protein (CRP)) were measured at rest, and lipid concentration and kinetics (lipid oxidation rate and lipolysis) were measured at rest, during a 30-minute bout of low-intensity (40% VO2peak) exercise, and during a recovery period. Umbilical cord blood was collected for measurement of neonatal plasma insulin sensitivity, inflammation, and lipid concentration. Neonatal body composition was measured via air displacement plethysmography. Pregnant obese women had higher plasma CRP (9.1 ± 4.0 mg/L versus 2.3 ± 1.8 mg/L, p<0.001) and higher HOMA-IR (3.8 ± 1.9 versus 2.3 ± 1.5, p=0.009) compared to pregnant lean women. Obese women had higher lipid oxidation rates during recovery from low-intensity exercise (0.13 ±0.03g/min versus 0.11 ±0.04g/min, p=0.02) that was associated with higher maternal CRP (r=0.55, p=0.001).Maternal CRP was positively associated with maternal HOMA-IR (r=0.40, p<0.02) and systolic blood pressure (r=0.40, p<0.02).Maternal lipid metabolism-associated inflammation may contribute to insulin resistance and higher blood pressure in obese women during pregnancy.
Keywords
free fatty acids, inflammation, insulin resistance, lipid oxidation, obesity
Introduction
Maternal obesity is a significant public health concern in the United States as one in three women enter pregnancy obese [1].Maternal obesity is associated with increased risk of maternal complications including excessive gestational weight gain [2,3], gestational diabetes[4], preeclampsia and other hypertensive disorders [5-8], and long-term maternal cardiovascular morbidity [9].Obesity during pregnancy also contributes to unfavorable offspring metabolic outcomes including excess adiposity [10,11]and insulin resistance[12].
Obese women experience metabolic dysfunction during pregnancy including higher plasma inflammation and lower insulin sensitivity [4,13,14]. Inflammation and insulin resistance are interrelated and associated with adverse pregnancy outcomes [13,15-19].Mechanisms contributing to elevated maternal inflammation during pregnancy in obese women are unclear.Evidence suggests that non-gravid, obese adults have elevated lipid oxidation rates at rest [20]and during low-to-moderate intensity exercise [21,22], and that excessive lipid oxidation is associated with higher inflammation[23]. Elevated maternal lipid oxidation during pregnancy in obese women might contribute to increased maternal inflammation and subsequently altered maternal metabolic health. In addition, alterations in maternal lipid metabolism might impact offspring health as maternal obesity contributes to a lipotoxic placental environment that may be associated with increased in uteromarkers of inflammation and altered fetal development [24,25].However, maternal lipid oxidation and its relationships with maternal and neonatal inflammation and metabolic health have not been previously examined.
The primary purposes of this study were to compare lipid oxidation rate and lipolysis during late pregnancy between obese and lean women, and to examine the relationships between maternal lipid metabolism, inflammation and insulin resistance. This study may identify lipid metabolism as a mechanism contributing to maternal inflammation in obese pregnant women.
Materials and methods
Subjects
Thirty-four women participated in the study (lean: n=18, obese: n=16). Women receiving prenatal care at the Women’s Health Center and Women’s Health Clinic at Barnes Jewish Hospital/Washington University between August 2013 and November 2014 were screened for inclusion. Approximately 350 women were screened, and 50 women who met all criteria with ongoing pregnancies were approached for participation late in their second trimester.Inclusion criteria included women ages 18-44 years, confirmed singleton viable pregnancy with no identified fetal abnormalities (as determined by routine anatomy ultrasound at 18-22 weeks), and pre-pregnancy BMI between 18.0 and 24.9 kg/m2 for the lean group or pre-pregnancy BMI between 30 and 45 kg/m2for the obese group. Exclusion criteria included: 1) multiple gestation pregnancy, 2) inability to provide voluntary informed consent,3) self- reported use of illegal drugs (cocaine, methamphetamine, opiates),4) current smoker who did not consent to cessation, 5) current usage of daily medications by class: corticosteroids, beta-blockers (known to affect lipid metabolism) and anti-psychotics (known to alter insulin resistance and metabolic profiles), 6) diagnosis of gestational diabetes in current pregnancy, history of gestational diabetes, pre-pregnancy diabetes or prior macrosomic (>4500g) infant (each elevate the risk for gestational diabetes in the current pregnancy, or undiagnosed gestational diabetes), 7) history of heart disease, or 8) any other condition that would preclude exercise.
Study procedures
All study procedures were performed at the Washington University School of Medicine Institute for Clinical and Translational Sciences Clinical Research Unit (CRU). All pregnant women participated in two maternal visits between 32 and 37 weeks gestation. Approval for this study was granted by the Institutional Review Board at Washington University (IRB ID: 201306109, NCT: NCT02039414).
Maternal visit 1
Body composition was measured using skinfold anthropometry in order to determine maternal percent body fat. Body fat percentage was determined by pressing folds of the skin at seven sites with a caliper (Harpenden Skinfolds Caliper, Baty International, United Kingdom), recording skin thickness, and entering the data into a standardized equation that accounts for age as previously described[26]. Participants also completed the YMCA submaximal cycle test as previously performed in order to predict cardiorespiratory fitness levels [27].National Institutes of Health’s Dietary History Questionnaire II was completed by each participant to determine potential differences in maternal diet in the month leading up to study visits[28].Previous literature demonstrates that dietary history questionnaires are valid and reproducible among pregnant populations [29].
Maternal visit 2
Approximately one week after Visit 1, subjects were admitted to the CRU the morning after an overnight fast. The night prior, subjects were instructed to consume a standardized meal consisting of 50% carbohydrates, 30% fats, and 20% protein. Upon admission to the CRU, height, weight, and vital signs were obtained. A catheter (IV) was placed in a hand vein and heated to 55°C by using a thermostatically controlled box in order to obtain arterialized blood samples as previously described [30].Participants kept their hand in the box throughout the entire study visit. Participants rested for approximately 30 minutes prior to measuring lipid oxidation rate using indirect calorimetry (True One 2400, Parvomedics, Sandy, UT). Participants laid supine while a canopy was placed over their head for 15 minutes to measure oxygen consumption and carbon dioxide production in order to determine lipid oxidation rate [31].After the initial indirect calorimetry measurement, a baseline blood collection was obtained. Participants then exercised continuously at approximately 40% of their predicted VO2peak(based on the YMCA submaximal cycle test) for 30 minutes. Lipid metabolism was examined via indirect calorimetry and plasma analysis during and after exercise because low-to-moderate intensity exercise increases both adipose tissue breakdown (i.e. lipolysis) and lipid oxidation, and low-to-moderate intensity exercise might mimic their daily activity levels (~3-5 METS, e.g. household chores, caring for other children, walking).Exercise indirect calorimetry was performed and blood was drawn at the 10, 20, and 30 minute time points of submaximal exercise. After exercise termination, participants returned to supine and blood was drawn 10, 30, and 60 minutes-post cessation of exercise (i.e. recovery). Indirect calorimetry was performed 30 minutes post-exercise for 15 minutes as described for the baseline measurement.
Sample analyses and calculations
All samples were immediately placed on ice and plasma was separated by centrifugation within 30 minutes of collection. Plasma samples were stored at -80°C until final analyses were performed. Blood samples for glucose were collected in heparinized tubes and analyzed immediately with an automated glucose analyzer (Yellow Springs Instruments Co, Yellow Springs, OH). Plasma insulin concentration was measured by electrochemiluminescence technology (Elecsys 2010, Roche Diagnostics, Indianapolis, IN). Insulin and glucose levels were used to calculate the homeostatic model assessment-insulin resistance (HOMA-IR)[32]. The HOMA-IR is an index of insulin resistance that reflects fasting glucose concentration measured at the fasting insulin concentration. Inflammation was examined through high-sensitivity C-reactive protein (CRP) and measured by immunoturbidimetric assay (Roach Diagnostics, Indianapolis, IN). Blood samples used to determine plasma free fatty acids were collected in in tubes containing EDTA. Plasma free fatty acid concentrations were determined by enzymatic colorimetric assay (Wako Pure Chemical Industries, Osaka, Japan). Lipolysis was calculated by the area under the curve (AUC) [33,34]for free fatty acids from baseline to the end of the study period. A summary score to represent total lipid oxidation rate throughout the study period was determined by calculating the AUC using lipid oxidation rates from baseline, exercise, and recovery time points. Clinical lipid profiles including triglycerides, total cholesterol, low-density lipoprotein, and high-density lipoprotein were also obtained at the CRU.
Neonatal measurements
At parturition, neonatal birth weight was obtained. In addition, 44 mL of umbilical vein blood was collected, centrifuged within 30 minutes of parturition, and placed in a -80°Cfreezer for further analysis. Umbilical cord blood was used to determine neonatal HOMA-IR (insulin and glucose levels), free fatty acid concentration, and CRP.
Within 48 hours of delivery, neonatal anthropometrics were measured in the CRU. Neonatal length (Pediatric Length Board, Ellard Instrumentation LTD, Monroe, WA) and head circumference (Gulick II Tape Measure, model 67020, Country Technology Inc., Gays Mills, WI) were measured. Body composition (fat and lean mass) was measured by skin fold thickness at four different sites (triceps, subscapular, ilium, and thigh, measured by one recorder) and by air displacement plethysmography (Pea Pod, Life Measurement, Inc., Concord, CA). All neonates were full-term (≥37 weeks gestation) at the time of delivery except for one in the obese group. This neonate’s data were excluded from the analysis.
Statistical analysis
Normality of the distribution for each variable was tested using Kolmogorov-Smirnov tests. Student’s Independent T-Tests for normally distributed variables and Mann-Whitney U tests for non-normally distributed variables were used to compare metabolic outcomes between lean and obese groups. Pearson product-moment correlation coefficients for normally distributed variables or Spearman’s rank-order correlation coefficient for non-normally distributed variables were used to assess the degree of the relationship between variables. Two-way repeated-measures ANOVAs (group x time) were used with Tukey post hoc analyses when comparing baseline, exercise, and recovery conditions. Study data were collected and managed using REDCap electronic data capture tools hosted at Washington University School of Medicine[35]. All data analyses were conducted using IBM SPSS Statistics, Version 22 (Armonk, New York).
Based on previous data comparing lipid metabolism between lean and obese females at rest and during exercise[22],we estimated an effect size of 1.1. Therefore, with an alpha level of 0.05, 16 women per group were required to power the study at β=0.80.
Results
Maternal demographic characteristics
Obese women had significantly higher pre-pregnancy body mass indexes and body fat percentages than the lean group (Table 1). Age, parity, income level, race, and gestation age during study visits were similar between groups (Table 1).
|
Lean (n=18) (Mean ± SD) |
Obese (n=16) (Mean ± SD) |
p-value |
Age (yrs) |
26.1 ± 5.0 |
25.0 ± 4.8 |
0.52 |
Pre-pregnancy BMI (kg/m2)* |
21.5 ± 1.9 |
36.3 ± 4.3 |
<0.001 |
Body fat percentage (%)* |
20.7 ± 4.0 |
37.7 ± 3.5 |
<0.001 |
Gestation age at visit 2 (weeks) |
35.2 ± 1.0 |
34.7 ± 1.4 |
0.25 |
Gestational weight gain (kg) |
14.5 ± 4.5 |
10.3 ± 9.2 |
0.12 |
Heart rate (bpm) |
84.1 ± 9.1 |
90.0 ± 10.8 |
0.08 |
Systolic blood pressure (mmHg) |
107.3 ± 8.1 |
112.0 ± 10.9 |
0.16 |
Diastolic blood pressure (mmHg) |
69.3 ± 7.6 |
71.5 ± 4.3 |
0.31 |
Glucose (mg/dL) |
76.9 ± 5.5 |
80.3 ± 7.9 |
0.24 |
Insulin (uU/mL)* |
12.3 ± 8.2 |
18.7 ± 8.4 |
0.01 |
HOMA-IR* |
2.3 ± 1.5 |
3.8 ± 1.9 |
0.01 |
C-reactive protein (mg/L)* |
2.3 ± 1.8 |
9.1 ± 4.0 |
<0.001 |
Total cholesterol (mg/dL) |
228.4 ± 36.3 |
207.8 ± 35.9 |
0.11 |
HDL (mg/dL) |
67.9 ± 18.2 |
65.1 ± 12.3 |
0.61 |
LDL (mg/dL) |
130.2 ± 35.0 |
110.6 ± 34.0 |
0.24 |
Triglycerides (mg/dL) |
151.8 ± 41.8 |
160.0 ± 60.9 |
0.65 |
Free fatty acids (meq/L) |
0.47 ± 0.12 |
0.49 ± 0.15 |
0.64 |
Resting energy expenditure (kcal/day)* |
1795 ± 225 |
2166 ± 291 |
<0.001 |
|
# of women (%) |
# of women (%) |
p-value (χ²-test) |
Parity |
0.93 |
Nulliparous |
11 (61%) |
10 (63%) |
Multiparous |
7 (39%) |
6 (37%) |
Income |
0.75 |
Low income |
10 (56%) |
8 (56%) |
Mod/high income |
8 (44%) |
8 (43%) |
Race |
0.73 |
Caucasian |
8 (44%) |
5 (31%) |
African-American |
9 (50%) |
10 (63%) |
Other |
1 (6%) |
1 (6%) |
Table 1. Maternal demographic and metabolic characteristics
*p<0.05
Maternal baseline metabolic characteristics
Maternal baseline metabolic characteristics are presented in Table 1. Obese pregnant women had significantly higher plasma insulin concentration than lean pregnant women.HOMA-IR was higher in obese women compared to lean pregnant women. Obese pregnant women had higher plasma CRP concentration compared to lean pregnant women. Maternal systolic blood pressure was higher in obese pregnant women compared to lean pregnant women across all time points (F=3.90, p=0.03). CRP, HOMA-IR, and systolic blood pressure data are shown in Figure 1. Obese pregnant women had significantly higher resting energy expenditure compared to lean pregnant women (Table 1).
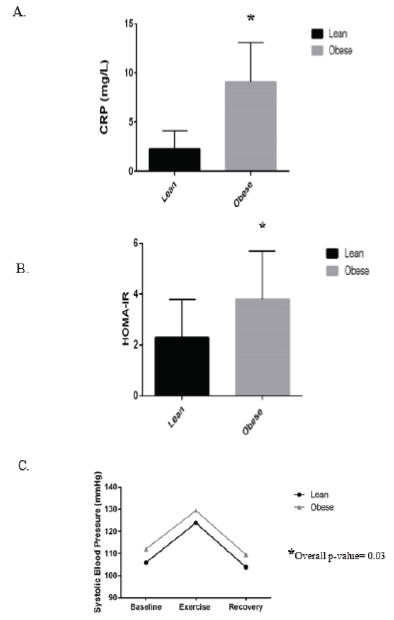
Figure 1.Maternal (A) inflammation (B) insulin resistance (C) systolic blood pressure between lean and obese pregnant women. Obese women have higher plasma CRP concentrations (A), higher insulin resistance (HOMA-IR) (B), and higher systolic blood pressure (C) than lean women during late pregnancy". All data are mean ± SD. *p<0.05
Dietary composition was similar between groups (Table 2). Three women (two lean, one obese) did not complete the dietary survey.
|
Lean (n=16) mean ± SD |
Obese (n=15) mean ± SD |
p-value |
Energy intake (kcal/day) |
2554.7 ± 1574 |
2058.7 ± 845 |
0.29 |
Fat (g) |
94.6 ± 50.5 |
69.1 ± 31.2 |
0.10 |
Carbohydrate (g) |
353.5 ± 256.2 |
295.4 ± 137.3 |
0.44 |
Protein (g) |
84.1 ± 39.0 |
73.3 ± 35.9 |
0.43 |
Table 2. Average maternal daily dietary composition
Maternal lipid metabolism
Pregnant obese women had a higher post-exercise lipid oxidation rate compared to their lean counterparts (Recovery: 0.11 ±0.04g/min vs. 0.13 ±0.03g/min, p=0.02) and tended to have higher lipid oxidation rates during baseline and exercise conditions (baseline- lean: 0.10 ± 0.04g/min vs. obese: 0.12 ± 0.03g/min, p=0.13; exercise- lean: 0.16 ±0.09g/min vs. obese: 0.22 ± 0.09g/min, p=0.09) (Figure 2A). Total lipid oxidation was significantly higher in the obese group (lean: 11.8 ± 5.4g vs. obese: 15.3±4.4g, p=0.05) (Figure 2B). Lipolysis was similar between groups throughout the baseline, exercise, and resting conditions.
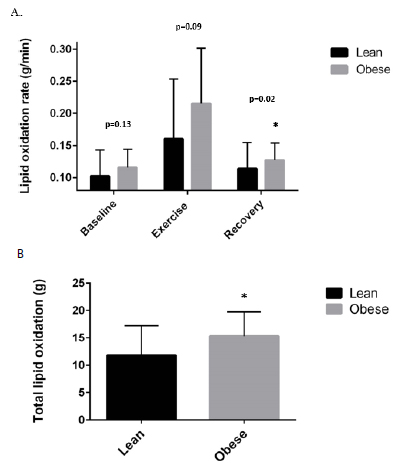
Figure 2. (A) Lipid oxidation rates between lean and obese groups at baseline, during exercise, and during recovery from exercise (B). Total lipid oxidation measured by AUC across all timepoints between lean and obese pregnant women. Lipid oxidation rates are higher in obese pregnant women, particularly during post-exercise recovery (A), and a total lipid oxidation is higher in obese pregnant women compared to lean pregnant women (B). All data are mean ± SD. *p<0.05
Correlations between maternal metabolic characteristics
CRP was positively associated with lipid oxidation rate at baseline (r=0.42, p=0.02) (Figure 3A) and during the 1-hour recovery period (r=.55, p=0.001) (Figure 3B). Maternal CRP was also related to total lipid oxidation (r=0.42, p=0.01) (Figure 3C).Similarly, baseline systolic blood pressure was positively correlated with lipid oxidation rate at baseline (r=0.34, p=0.05) and during the 1-hour recovery period (r=0.39, p=0.02). However, when accounting for CRP, the relationships between lipid oxidation rate and systolic blood pressure did not exist. Maternal CRP was positively correlated with maternal circulating insulin levels (r= 0.44, p=0.01), HOMA-IR (r=0.40, p=0.02) (Figure 4A), and systolic blood pressure (r=0.40, p=0.02) (Figure 4B).
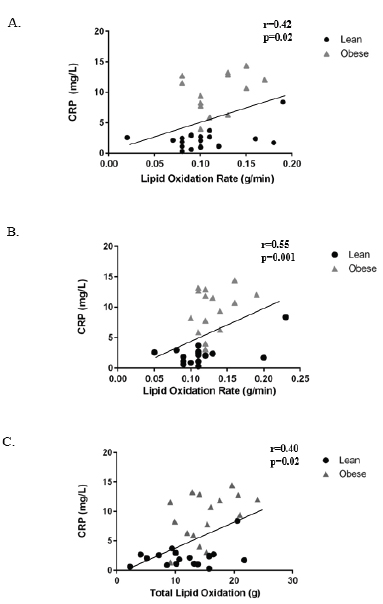
Figure 3. Relationships between CRP and (A) baseline lipid oxidation rate, (B) post-exercise recovery lipid oxidation rate, and (C) total lipid oxidation. Maternal plasma CRP concentration is significantly correlated to lipid oxidation rate at baseline (A), during recovery (B), and to total lipid oxidation (C). *p<0.05
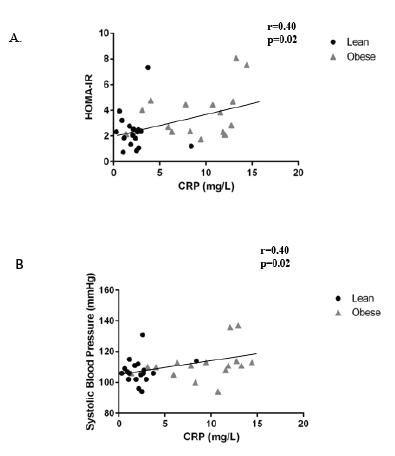
Figure 4.Relationships between baseline maternal inflammation and (A) insulin resistance (B) systolic blood pressure. Maternal plasma CRP concentration is significantly correlated to maternal insulin resistance (A) and maternal systolic blood pressure (B). *p<0.05
Neonatal anthropometric and metabolic outcomes
Air displacement plethysmography was not performed on three neonates due to time of delivery relative to discharge, but all other neonatal anthropometrics were obtained. Cord blood could not be obtained from one lean and two obese participants.Neonatal anthropometrics and metabolic outcomes were similar between groups (Table 3).
Neonatal demographic characteristics |
Lean (n=18) mean ± SD |
Obese (n=16) mean ± SD |
p-value |
Gestational age at delivery (weeks) |
39.1 ± 0.9 |
39.5 ± 1.4 |
0.33 |
Birth weight (g) |
3221.6 ± 377 |
3344 ± 428 |
0.57 |
Length (cm) |
49.5 ± 2.2 |
49.9 ± 2.0 |
0.88 |
Head circumference (cm) |
33.7 ± 1.7 |
34.4 ± 1.2 |
0.22 |
Fat mass (%) |
11.1 ± 4.3 |
11.2 ± 3.6 |
0.98 |
Skinfolds (cm) |
Triceps |
4.9 ± 0.8 |
5.1 ± 1.1 |
0.61 |
Subscapular |
4.4 ± 0.8 |
4.4 ± 0.9 |
0.97 |
Ilium |
4.7 ± 1.3 |
5.2 ± 1.4 |
0.56 |
Thigh |
6.4 ± 1.3 |
6.9 ± 1.9 |
0.45 |
|
# of women (%) |
# of women (%) |
|
Mode of Delivery |
Vaginal |
14 (78%) |
9 (56%) |
0.27 |
Cesarean |
4 (22%) |
7 (44%) |
Gender |
Male |
7 (39%) |
10 (63%) |
0.30 |
Female |
11 (61%) |
6 (37%) |
Neonatal cord blood values |
Lean (n=17) mean ± SD |
Obese (n=14) mean ± SD |
p-value |
Glucose (mg/dL) |
88.4 ± 14.0 |
80.7 ± 12.8 |
0.13 |
Insulin (uU/mL) |
7.9 ± 6.2 |
7.5 ± 4.9 |
0.98 |
HOMA-IR |
1.7 ± 1.5 |
1.6 ± 1.2 |
0.68 |
Free fatty acids (meq/L) |
0.19 ± 0.08 |
0.16 ±0.06 |
0.28 |
C-reactive protein (mg/L) |
0.20 ± 0.10 |
0.24 ± 0.21 |
0.55 |
Table 3. Neonatal anthropometric and metabolic outcomes
*p<0.05
Discussion
Our primary novel findings from the study were: 1) maternal lipid oxidation was higher in obese pregnant women compared to lean pregnant women, particularly following an acute bout of low-intensity exercise, 2) maternal lipid oxidation rate was significantly associated with maternal inflammation, and 3) maternal inflammation was related to maternal insulin resistance and systolic blood pressure. These results suggest that elevated maternal lipid oxidation might contribute to increased inflammation and subsequent reductions in insulin sensitivity during late pregnancy in obese women. Importantly, we believe the finding of elevated lipid oxidation rates in obese pregnant women following a mild bout of physical activity is clinically meaningful as this metabolic environment would be representative of women who recently participated in typical daily physical activities (e.g. running errands, cleaning the house, or taking care of another child). Lipid oxidation rate in non-gravid adults is known to increase over resting values during low-to-moderate physical activity and remained elevated for 2-3 hours post-exercise [36,37].
In the current study, higher rates of maternal lipid oxidation during rest and post-exercise recovery were associated with greater maternal inflammation. In non-gravid adults, lipid oxidation is intricately related to inflammation and insulin resistance [23,38].Specifically, lipid oxidation by-products including reactive oxygen species have been shown to signal pathways that initiate an inflammatory response [23,39,40]. The current study also found that higher maternal inflammation was associated with higher insulin resistance, suggesting that maternal inflammation, possibly the result of increased lipid oxidation by-products, might contribute to higher maternal insulin resistance in obese pregnant women. Our results are consistent with Retnakaran et al. who demonstrated obesity during pregnancy elicits an inflammatory response with possible downstream metabolic sequelae including insulin resistance [41].Similarly, Korkmazer et al. found higher inflammation among insulin resistant pregnant women with and without a classification of gestational diabetes [42].The clinical implications of this could be substantial as the combination of obesity and insulin resistance during pregnancy can lead to gestational diabetes[13]. Consequently, offspring of obese, insulin resistant women are at increased risk of preterm delivery and associated neonatal morbidity, as well as childhood metabolic dysfunction which may potentiate the vicious cycle of obesity and insulin resistance [13]. Taken together, these data suggest a relationship between maternal lipid metabolism, inflammation, and insulin resistance in obese women during pregnancy.
In the current study, lipid profiles were similar between lean and obese pregnant women (triglycerides, total cholesterol, low-density lipoprotein, high-density lipoprotein). While maternal obesity is associated with increased higher plasma concentrations of triglycerides and low-density lipoproteins early in pregnancy[43], lean and obese women reach similar concentrations during late pregnancy[43].Our data, measured during late pregnancy, are reflective of the literature demonstrating similar lipid profiles between lean and obese pregnant women. Similarly, maternal and neonatal free fatty acid concentrations in the current study were consistent with Catalano et al. who reported free fatty acid concentrations in obese women and their fetuses were not different than lean pregnant women [43,44].
Although not a primary focus of the study, we also found a relationship between maternal inflammation and resting systolic blood pressure. Maternal systemic inflammation is a known feature of preeclampsia, a pregnancy-specific condition characterized by high blood pressure[45].In fact, Redman et al. suggest that preeclampsia is ultimately an excessive maternal inflammatory response to pregnancy [46]. High blood pressure disorders during pregnancy, including preeclampsia, are an important cause of morbidity, long-term disability, and even death among pregnant women and their offspring [47]. Inflammation has been identified as a key contributor to pregnancy-specific high blood pressure [46,48]and our findings are consistent with this.
Oxidative stress could provide a link connecting increased maternal lipid oxidation with inflammation and subsequent insulin resistance and hypertension in obese pregnant women. In non-gravid adults, oxidative stress is elevated in obesity [49]and is associated with inflammation, vascular cell wall damage, high blood pressure, cardiovascular disease, poor metabolic function, and insulin resistance [50-58]. It is possible that elevated lipid oxidation rates observed in obese pregnant women generate partially-oxidized byproducts (i.e. reactive oxygen species); however, this is speculative and requires further study. Figure 5 depicts proposed pathway for the role of maternal on lipid metabolism and long-term maternal and neonatal outcomes.
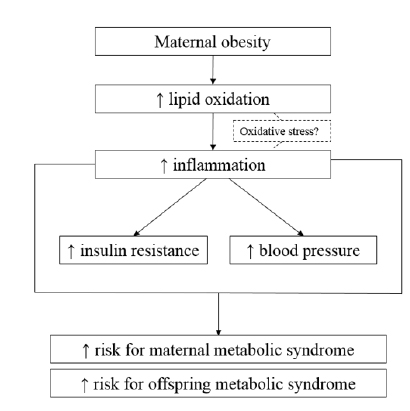
Figure 5. Proposed pathway for maternal lipid metabolism and long-term maternal and neonatal outcomes
Neonates of pregnant obese woman had similar body composition, insulin sensitivity, and inflammatory markers as lean pregnant women. These results suggest that despite the metabolic abnormalities associated with obesity during pregnancy, the fetus may be protected from some of these detrimental effects, at least at 24-48 hours post-parturition. However, the “fetal origins hypothesis” suggests the origins of adult health diseases such as obesity, cardiovascular disease, and diabetes may be caused byin uteroexposures[59,60].Therefore, it is plausible that metabolic abnormalities may be epigenetically programmed, but are not apparent or measurable until later in life. For example, Liebowitz et al. found that offspring of obese women had higher plasma inflammation at 12 years of age [61]. Offspring of obese women with elevated plasma inflammation during pregnancy may develop inflammation as they age as a result of fetal programming; however, these changes may not be detectable at delivery when umbilical cord blood is obtained. Similarly, Whitaker concluded that obesity during pregnancy more than doubles the risk of obesity in the offspring between ages two and four [43,62]. Although neonatal body composition in our study was not different between lean and obese pregnant women, it is possible that differences might emerge during the preschool and childhood years. It is also plausible that our sample size was not large enough to detect a difference in birth weight or body composition as it is well-accepted that obese women have larger babies [10,11].Based on our findings and the current literature, longitudinal studies of offspring born to obese women are needed.
A limitation of the present study was the observational study design, thus, cause-and-effect relationships could not be determined from these data. Our results should be cautiously interpreted as this pilot study was powered based on our primary outcome of lipid oxidation rate. We are not adequately powered to investigate many other maternal and neonatal outcomes. Bias may have been introduced because measurements and assessments were not blinded (it was obvious who was an obese “case” versus a lean “control”), but uniform data collection procedures were followed for all participants to minimize bias.
In conclusion, we found that obese pregnant women have higher lipid oxidation rate, particularly after an acute bout of low-intensity exercise during late pregnancy. In addition, higher maternal lipid oxidation rates were associated with higher maternal inflammation. Maternal inflammation was related to insulin resistance and systolic blood pressure. We did not find any differences in neonatal metabolic outcomes between lean and obese women. Future studies investigating the role of maternal lipid oxidation-produced oxidative stress and interventions targeting lipid metabolism and inflammation to improve maternal and neonatal health in obese pregnant women are warranted.
Acknowledgements
The nursing staff at the Washington University Institute for Clinical and Translational Sciences Clinical Research Unit as well as Barnes-Jewish Hospital’s Labor and Delivery floor should be acknowledged for their hard work and altruism. The funding sources: Clinical and Translational Science Award (CTSA) program of the National Center for Advancing Translational Sciences (NCATS) of the National Institutes of Health (NIH) under Award TL1 TR000449 and the Movement Science Program as part of Washington University School of Medicine’s Program in Physical Therapy should also be acknowledged for their contributions.
Author contributions
RAT and WTC researched data, wrote/edited manuscript. EAS and AGC researched data and reviewed/edited the manuscript. The authors declare no conflicts of interest.
References
- King JC (2006) Maternal obesity, metabolism, and pregnancy outcomes. Annu Rev Nutr 26: 271-291. [Crossref]
- Chasan-Taber L, Schmidt MD, Pekow P, Sternfeld B, Solomon CG, et al. (2008) Predictors of excessive and inadequate gestational weight gain in Hispanic women. Obesity (Silver Spring)16: 1657-1666. [Crossref]
- Althuizen E, van Poppel MN, Seidell JC, van Mechelen W (2009) Correlates of absolute and excessive weight gain during pregnancy. J Womens Health (Larchmt)18: 1559-1566. [Crossref]
- Lain KY, Catalano PM (2006) Factors that affect maternal insulin resistance and modify fetal growth and body composition. Metab Syndr Relat Disord 4: 91-100. [Crossref]
- Weiss JL, Malone FD, Emig D, Ball RH, Nyberg DA, et al. (2004) Obesity, obstetric complications and cesarean delivery rate--a population-based screening study. Am J Obstet Gynecol 190: 1091-1097. [Crossref]
- Miller RS, Thompson ML, Williams MA (2007) Trimester-specific blood pressure levels in relation to maternal pre-pregnancy body mass index. Paediatr Perinat Epidemiol 21: 487-494. [Crossref]
- O'Brien TE, Ray JG, Chan WS (2003) Maternal body mass index and the risk of preeclampsia: a systematic overview. Epidemiology 14: 368-374. [Crossref]
- Walsh SW (2007) Obesity: a risk factor for preeclampsia. Trends Endocrinol Metab 18: 365-370. [Crossref]
- Yaniv-Salem S, Shoham-Vardi I, Kessous R, Pariente G, Sergienko R, et al. (2015) Obesity in pregnancy: what's next? Long-term cardiovascular morbidity in a follow-up period of more than a decade. J Matern Fetal Neonatal Med 26:1-5. [Crossref]
- Catalano PM, Farrel2021 Copyright OAT. All rights reservin P, et al. (2009) Perinatal risk factors for childhood obesity and metabolic dysregulation. Am J Clin Nutr 90: 1303-1313. [Crossref]
- Heerwagen MJ, Miller MR, Barbour LA, Friedman JE (2010) Maternal obesity and fetal metabolic programming: a fertile epigenetic soil. Am J Physiol Regul Integr Comp Physiol 299: R711-722. [Crossref]
- HAPO Study Cooperative Research Group, Metzger BE, Lowe LP, Dyer AR, Trimble ER, et al. (2008) Hyperglycemia and adverse pregnancy outcomes. N Engl J Med 358: 1991-2002. [Crossref]
- Catalano PM (2010) Obesity, insulin resistance, and pregnancy outcome. Reproduction 140: 365-371. [Crossref]
- Christian LM, Porter K (2014) Longitudinal changes in serum proinflammatory markers across pregnancy and postpartum: effects of maternal body mass index. Cytokine 70: 134-140. [Crossref]
- Catalano PM, Presley L, Minium J, Hauguel-de Mouzon S (2009) Fetuses of obese mothers develop insulin resistance in utero. Diabetes Care 32: 1076-1080. [Crossref]
- Tsakalis A, Harizopoulou V, Goulis D, Savopoulos C, Limenopoulos V, et al. (2012) Development of type 2 diabetes after gestational diabetes mellitus. Hippokratia 16: 385. [Crossref]
- Challier JC, Basu S, Bintein T, Minium J, Hotmire K, et al. (2008) Obesity in pregnancy stimulates macrophage accumulation and inflammation in the placenta. Placenta 29: 274-281. [Crossref]
- Volpe L, Di Cianni G, Lencioni C, Cuccuru I, Benzi L, et al. (2007) Gestational diabetes, inflammation, and late vascular disease. J Endocrinol Invest 30: 873-879. [Crossref]
- Shoelson SE, Herrero L, Naaz A (2007) Obesity, inflammation, and insulin resistance. Gastroenterology 132: 2169-2180. [Crossref]
- Nicklas BJ, Goldberg AP, Bunyard LB, Poehlman ET (1995) Visceral adiposity is associated with increased lipid oxidation in obese, postmenopausal women. Am J Clin Nutr 62: 918-922. [Crossref]
- Goodpaster BH, Wolfe RR, Kelley DE (2002) Effects of obesity on substrate utilization during exercise. Obes Res 10: 575-584. [Crossref]
- Jabbour G, O'Loughlin J, Sabiston C, Tremblay A, Mathieu ME (2014) Increased lipid oxidation during exercise in obese pubertal girls: a QUALITY study. Obesity (Silver Spring) 22: E85-90. [Crossref]
- McIntyre TM, Hazen SL (2010) Lipid oxidation and cardiovascular disease: introduction to a review series. Circ Res 107: 1167-1169. [Crossref]
- Herrera E (2002) Lipid metabolism in pregnancy and its consequences in the fetus and newborn. Endocrine 19: 43-55. [Crossref]
- Saben J, Lindsey F, Zhong Y, Thakali K, Badger TM, et al. (2014) Maternal obesity is associated with a lipotoxic placental environment. Placenta 35: 171-177. [Crossref]
- Jackson AS, Pollock ML, Ward A (1980) Generalized equations for predicting body density of women. Med Sci Sports Exerc 12: 175-181. [Crossref]
- Beekley MD, Brechue WF, deHoyos DV, Garzarella L, Werber-Zion G, et al. (2004) Cross-validation of the YMCA submaximal cycle ergometer test to predict VO2max. Res Q Exerc Sport 75: 337-342. [Crossref]
- Subar AF, Thompson FE, Kipnis V, Midthune D, Hurwitz P, et al. (2001) Comparative validation of the Block, Willett, and National Cancer Institute food frequency questionnaires : the Eating at America's Table Study. Am J Epidemiol 154: 1089-1099. [Crossref]
- VioqueJ, Navarrete-Muñoz EM, Gimenez-Monzó D, García-de-la-Hera M, Granado F, et al. (2013) Reproducibility and validity of a food frequency questionnaire among pregnant women in a Mediterranean area. Nutr J 12: 26. [Crossref]
- Zello GA, Smith JM, Pencharz PB, Ball RO (1990) Development of a heating device for sampling arterialized venous blood from a hand vein. Ann Clin Biochem 27: 366-372. [Crossref]
- Frayn KN (1983) Calculation of substrate oxidation rates in vivo from gaseous exchange. J Appl Physiol Respir Environ Exerc Physiol 55: 628-634. [Crossref]
- Cohen O, Epstein GS, Weisz B, Homko CJ, Sivan E (2006) Longitudinal assessment of insulin sensitivity in pregnancy. Validation of the homeostasis model assessment. Clin Endocrinol (Oxf) 64: 640-644. [Crossref]
- Pruessner JC, Kirschbaum C, Meinlschmid G, Hellhammer DH (2003) Two formulas for computation of the area under the curve represent measures of total hormone concentration versus time-dependent change. Psychoneuroendocrinology 28: 916-931. [Crossref]
- Allirot X, Seyssel K, Saulais L, Roth H, Charrié A, et al. (2014) Effects of a breakfast spread out over time on the food intake at lunch and the hormonal responses in obese men. Physiol Behav 127: 37-44. [Crossref]
- Harris PA, Taylor R, Thielke R, Payne J, Gonzalez N, et al. (2009) Research electronic data capture (REDCap)--a metadata-driven methodology and workflow process for providing translational research informatics support. J Biomed Inform 42: 377-381. [Crossref]
- Klein S, Coyle EF, Wolfe RR (1994) Fat metabolism during low-intensity exercise in endurance-trained and untrained men. Am J Physiol 267: E934-940. [Crossref]
- Kuo CC, Fattor JA, Henderson GC, Brooks GA (2005) Lipid oxidation in fit young adults during postexercise recovery. J Appl Physiol (1985) 99: 349-356. [Crossref]
- Magkos F, Fabbrini E, Conte C, Patterson BW, Klein S (2012) Relationship between adipose tissue lipolytic activity and skeletal muscle insulin resistance in nondiabetic women. J Clin Endocrinol Metab 97: E1219-1223. [Crossref]
- Berliner JA, Navab M, Fogelman AM, Frank JS, Demer LL, et al. (1995) Atherosclerosis: basic mechanisms. Oxidation, inflammation, and genetics. Circulation 91: 2488-2496. [Crossref]
- Festa A, D'Agostino R Jr, Howard G, Mykkänen L, Tracy RP, et al. (2000) Chronic subclinical inflammation as part of the insulin resistance syndrome: the Insulin Resistance Atherosclerosis Study (IRAS). Circulation 102: 42-47. [Crossref]
- Retnakaran R, Hanley AJ, Raif N, Connelly PW, Sermer M, et al. (2003) C-reactive protein and gestational diabetes: the central role of maternal obesity. J Clin Endocrinol Metab 88: 3507-3512. [Crossref]
- Korkmazer E, Solak N (2015) Correlation between inflammatory markers and insulin resistance in pregnancy. J Obstet Gynaecol 35: 142-145. [Crossref]
- Catalano P, deMouzon SH1 (2015) Maternal obesity and metabolic risk to the offspring: why lifestyle interventions may have not achieved the desired outcomes. Int J Obes (Lond) 39: 642-649. [Crossref]
- Catalano PM, Hauguel-De Mouzon S (2011) Is it time to revisit the Pedersen hypothesis in the face of the obesity epidemic? Am J Obstet Gynecol 204: 479-487. [Crossref]
- Southcombe JH, Redman CW, Sargent IL, Granne I (2015) Interleukin-1 family cytokines and their regulatory proteins in normal pregnancy and pre-eclampsia. Clin ExpImmunol 181: 480-490. [Crossref]
- Redman CW, Sacks GP, Sargent IL (1999) Preeclampsia: an excessive maternal inflammatory response to pregnancy. Am J Obstet Gynecol 180: 499-506. [Crossref]
- WHO Recommendations for Prevention and Treatment of Pre-Eclampsia and Eclampsia (2011) WHO Guidelines Approved by the Guidelines Review Committee. Geneva.
- Can M, Sancar E, Harma M, Guven B, Mungan G, et al. (2011) Inflammatory markers in preeclamptic patients. Clin Chem Lab Med 49: 1469-1472. [Crossref]
- Marseglia L, Manti S, D'Angelo G, Nicotera A, Parisi E, et al. (2014) Oxidative stress in obesity: a critical component in human diseases. Int J Mol Sci 16: 378-400. [Crossref]
- Abramson JL, Hooper WC, Jones DP, Ashfaq S, Rhodes SD, et al. (2005) Association between novel oxidative stress markers and C-reactive protein among adults without clinical coronary heart disease. Atherosclerosis 178: 115-121. [Crossref]
- Ames BN, Shigenaga MK, Hagen TM (1993) Oxidants, antioxidants, and the degenerative diseases of aging. Proc Natl Acad Sci U S A 90: 7915-7922. [Crossref]
- Davì G, Guagnano MT, Ciabattoni G, Basili S, Falco A, et al. (2002) Platelet activation in obese women: role of inflammation and oxidant stress. JAMA 288: 2008-2014. [Crossref]
- Evans JL, Goldfine ID, Maddux BA, Grodsky GM (2003) Are oxidative stress-activated signaling pathways mediators of insulin resistance and beta-cell dysfunction? Diabetes 52: 1-8. [Crossref]
- Maddux BA, See W, Lawrence JC Jr, Goldfine AL, Goldfine ID, et al. (2001) Protection against oxidative stress-induced insulin resistance in rat L6 muscle cells by mircomolar concentrations of alpha-lipoic acid. Diabetes 50: 404-410. [Crossref]
- Nakazono K, Watanabe N, Matsuno K, Sasaki J, Sato T, et al. (1991) Does superoxide underlie the pathogenesis of hypertension? Proc Natl Acad Sci U S A 88: 10045-10048. [Crossref]
- Shah S, Iqbal M, Karam J, Salifu M, McFarlane SI (2007) Oxidative stress, glucose metabolism, and the prevention of type 2 diabetes: pathophysiological insights. Antioxid Redox Signal 9: 911-929.
- Park EJ, Park K (2009) Oxidative stress and pro-inflammatory responses induced by silica nanoparticles in vivo and in vitro. Toxicol Lett 184: 18-25. [Crossref]
- Yokota T, Kinugawa S, Yamato M, Hirabayashi K, Suga T, et al. (2013) Systemic oxidative stress is associated with lower aerobic capacity and impaired skeletal muscle energy metabolism in patients with metabolic syndrome. Diabetes Care 36: 1341-1346. [Crossref]
- Barker DJ, Eriksson JG, Forsén T, Osmond C (2002) Fetal origins of adult disease: strength of effects and biological basis. Int J Epidemiol 31: 1235-1239. [Crossref]
- Almond D, Currie J1 (2011) Killing Me Softly: The Fetal Origins Hypothesis. J Econ Perspect 25: 153-172. [Crossref]
- Leibowitz KL, Moore RH, Ahima RS, Stunkard AJ, Stallings VA, et al. (2012) Maternal obesity associated with inflammation in their children. World J Pediatr 8: 76-79. [Crossref]
- Whitaker RC (2004) Predicting preschooler obesity at birth: the role of maternal obesity in early pregnancy. Pediatrics 114: e29-36. [Crossref]