Annona muricata L. is belongs to the family Annonacea, which has been used in many traditional medicinal systems. It has many medicinal values such as to cure fever, headaches, cough, asthma and hypertension. Such bioactive chemical compounds identified through characterization compounds analysis. The analysis of bioactive and acetogenins compounds in the crude plant extracts involving the applications of common identification and characterization technique involving non-chromatographic techniques such as phytochemical screening and metabolites quantification, Nuclear Magnetic Resonance (NMR) and Fourier-Transform Infrared (FT-IR) along with chromatographic technique such as High Performance Liquid Chromatography (HPLC) are discussed. The evaluation of cytotoxicity study on normal and cancer cell lines was accessed with no alteration occurred in the normal Periodontal Ligament (PDL) cell line and showed some inhibition in colon cancer (HT-29) cell line. The presence of bioactive compound is confirmed as the valuable medicinal compound likely to cure vast array of disease.
annonacea, acetogenins, chromatographic, non-chromatographic
Plants are the better source of pharmacologically active compounds, and have provided humankind with many medically usually compounds for centuries. Medicinal plants are containing substances which are responsible for healing properties not exactly known until 19th century [1]. Medicinal plants have many phytochemical which are naturally occurring in the leaves, vegetables and roots that have defence mechanism and protect properties [2]. The phytochemicals were non-nutritive plant chemicals that have protective or disease preventive properties. They were non-essential nutrients, meaning that they were not required by the human body for sustaining life. However, it was well-known that plant produced these chemicals to protect themselves and recent research demonstrated that they can also protect humans against diseases. There were more than thousand known phytochemicals and each worked differently. Some of the well-known phytochemicals were alkaloids, terpenoids (stimulation of enzymes), phenolic and flavonoids (antioxidants), phlobatanins, tannins, fatty acids, leucoanthocyanins, coumarins, saponin (interference with DNA replication), and steroids The modern pharmaceutical researches have been intensively tried to found out the active principles in the plants. The active principles differ from plant to plant, even differ in the different organ of the same plant, there are mainly due to their diversity of bioactive compounds in the plant. Since the isolation and separation of compound is very difficult and time consuming, it becomes harder to identify and validated the active compounds in crude extract. To identify and authenticate the compounds in the crude plant extract, some of non-chromatographic and chromatographic techniques can be done. Identification of active principles or known as biologically active maker compound requires their standardization using appropriate chemical procedures such as chromatographic and spectral studies [3]. One of the important herbal plant Annona muricata L. or known as soursop attracts greater attention because it’s high medicinal value both in herbal folklore practices and also the lack of adequate information on the nature of bioactive principle and its therapeutic action. In ancient time, it had been used as herbal remedies in treating diabetes, hypertension, fever, vomiting and against worm [4]. Other than that, it also has been used in treating headaches, cough, asthma and as a sedative [5-7]. The soursop as commonly known, is a medium-sized tree. Prior to its high antioxidant and anticancer compounds, the leaves composition of this plant include polysaccharide, protein, glycosaponin, phenolic, and flavonoid showed medicinal properties as antioxidant agent. The leaves are rich in annonaceous acetogenin, the most potent anticancer compounds. The annonaceous acetogenins compounds are composed of a series of polyketide-derived fatty acid with tetrahydrofuran rings and methylated gamma-lactone bonded together. Present investigation focus on the identification of bioactive compound present in that valuable medicinal plant by HPLC, NMR and FT-IR spectral investigation and the aim of the cytotoxicity study was done to determine the effects induced by the sample on normal and cancer cell line.
Extract
The Annona muricata leaves extract was obtained from the optimization process using soxhlet extractor continuous from previous study [8]. The dried leaves were extracted in a soxhlet by using different ratio of solvent to raw material ratio in the range of 1:1 to 1:6 with different ethanol concentration 0-10% and extraction time 1 to 8 hr. The extracts were filtered using Whatman No. 1 filter paper. The filtrate was then evaporated to dryness using rotary evaporator (Buchi Evaporator, Heidolph, Germany) at 50°C. The dried crude extract was obtained from oven drying method at 40°C (Mermet) and the samples were stored in a freezer of (-20)°C for further analysis. The marker compound from the optimum extract was validated through characterization and identification process.
Identification and characterization
Phytochemical Screening:
Phytochemical screening tests were carried out in the extracts using standard procedure to identify the constituents as described by Trease and Evans [9]. The screening involved detection of alkaloids, terpenoids, flavonoids, coumarins, steroids, fatty acids, phlobatanins, phenolics, tannins, and saponin. The method used in this study were shown in Table 1.
Table 1. Phytochemical screening
Test |
Method |
Indicator |
Alkaloids |
1 mL of extract was added with 2-3 drops of Mayer’s reagent |
The appearance of cream colour precipitate or pale yellow colour precipitate indicated the presence of alkaloids |
Terpenoids |
1 mL of the extract was mixed with 2 mL of chloroform and concentrated H2SO4 (3 mL) was carefully added to form a layer |
A reddish brown colouration of the interface was formed to indicate positive results for the presence of terpenoids |
Flavonoids |
1 mL of extract was dissolved in diluted NaOH and HCl was added |
A yellow solution that turns colourless indicated the presence of flavonoids |
Coumarins |
3 mL of 10 % NaOH was added to 2 mL of aqueous extract |
Formation of yellow colour indicated the presence of coumarins. |
Steroids |
1 mL of the extract was dissolved in 10 mL of chloroform and equal volume of concentrated sulphuric acid was added by sides of the test tube |
The upper layer turns red and sulphuric acid layer showed yellow with green fluorescence. This indicated the presence of steroids. |
Fatty acids |
1 mL of extract was mixed with 10 mL of ether. These extract was allow it for evaporation on filter paper and dried the filter paper |
The appearance of transparency on filter paper indicated the presence of fatty acids.
|
Phlobatanins |
1 mL of extract was dissolved in distilled water and filtered. The filtrate was boiled with 2% HCl solution |
Red precipitate indicated the presence of phlobatanins |
Phenolics and Tannins |
1 mL of extract was dissolved in 2 mL of distilled water. Into this solution, a few drops of 5% ferric chloride solution were added |
The formation of dark green colour indicated the presence of phenolic compounds.
|
Saponin |
1 mL of extract was diluted with distilled water up to 3 mL. The suspension was then shaken in a test tube for 15 min |
Formation of a two layer of foam indicated the presence of saponin.
|
Primary and Secondary Metabolites Quantification:
Primary and secondary metabolites quantification included several antioxidant tests such as total polysaccharide measurement [10], total protein measurement [11-12], total glycosaponins measurement [10] and [13] total phenolic [14] and total flavonoid content [15]. The antioxidant activity also was studied using DPPH Radical Scavenging Activity Assay. All sample were measured by Shimadzu UVmini-1240 of UV-Vis spectrophotometer (Shimadzu Corporation, Kyoto, Japan). The radical scavenging activity of samples was investigated using 2,2, diphenylpicryl-Hydrazyl (DPPH) method as described by Norshazila [16] with slight modification. Each sample was prepared in a twofold series of dilution and was mixed with the DPPH reagent. After 30 minutes of incubation at room temperature in the dark, the absorbance was taken against blank at 517 nm using UV-VIS spectrophotometer. The two commercial antioxidants used as positive control were ascorbic acid (vitamin C) and butylated hydroxyanisole (BHA). At the same time, the negative control was also prepared using solvent extractor mixed with DPPH reagent. At the end of experiment, the result was expressed in mean average and the free radical scavenging activity was calculated according to the following equation below:

where,
A0 = Absorbance reading of the negative control
Ae = Absorbance reading in the presence of sample
High performance liquid chromatography
Acetogenins qualitative screening analysis was carried out using HPLC with operating conditions that matched those reported by Yang [17] with slightly modification. A water HPLC system (Milford, MA, USA) that consisted of double pump and system controller (Model 2695), an auto-sampler and photo-diode array detector (Model 966) was used. The column configuration consisted of a reversed phase column (4.6 × 150 mm, 4 µm; Phenomemex, Torrance, CA, USA). Detection wavelength was set at 220 nm. The mobile phase consisted of A (acetonitirile) and B (deionized water), using a linear gradient: 0-40 min (85%), and 40-60 min (85-95% A). The flow rate was 1.0 ml/min. The column temperature was maintained at 30°C. High Performance of Liquid Chromatography (HPLC) was used for the screening of the acetogenins compounds present in the plant extracts, and also for the assessment of the pharmaceutical properties of the capsules.
Nuclear magnetic resonances (NMR)
Nuclear Magnetic Resonance Spectroscopy was an operation technique used for liquid NMR experiment using a Bruker Avance NMR 400 MHz model. NMR was the final technique for molecular characterization or more specifically molecular determination. The 1H NMR (400 MHz) and 13C NMR (100 MHz) spectra were recorded on Bruker Avance 400 spectrometer. The chemical shifts were reported in ppm relative to tetramethylsilane (TMS) in deuterium oxide (2H2O) as solvents. The infrared spectra were measured using Perkin-Elmer series 1600 spectrophotometer as thin film (NaCl) window for liquid samples or KBr pellet for solid samples. The melting points were measured on a Leica Gallen III Kofter micro melting point apparatus. The optical rotations were measured in CHCl3 with Perkin Elmer 241 polarimeter. The ultraviolet (UV) spectra were recorded on Shimadzu UV 1601PC spectrophotometer. NMR is a powerful tool in identification of molecular structure of the compounds in plant extract.
Fourier-transform infrared (FT-IR)
FT-IR was used to identify the functional group of the active components based on the peak value in the region of infrared radiation. All spectra were obtained with the aid of an OMNI-sampler attenuated total reflectance (ATR) accessory on a FTIR spectrophotometer. A small amount of powdered leaves was placed directly on the germanium piece of the infrared spectrometer with constant pressure applied and data of infrared absorbance, collected over the wave number ranged from 4000 cm–1 to 675 cm–1 and computerized for analyses). The melting points were measured on a Leica Gallen III Kofter micro melting point apparatus. The optical rotations were measured in CHCl3 with Perkin Elmer 241 polarimeter. The ultraviolet (UV) spectra were recorded on Shimadzu UV 1601PC spectrophotometer.
Cell lines and culture
HT-29 cells, colorectal cancer cells were obtained from Kuliyyah of Allied Health Science and preodontal ligament, PDL normal cells from Integrated Centre for Research Animal, Care & Use, IIUM Kuantan. Cells were grown in Dulbecco’s modified eagle medium (DMEM) with 10 %( v/v) fetal bovine serum & 1% (v/v) of penicillin streptomycin. Cells were cultured at 37°C in 5% CO₂ humidified atmosphere. Cells were sub cultured when it reached >80% confluency.
Cytotoxicity
Trypan Blue exclusion method was a cell-based assay used in this study to detect the mechanism of toxicity in cells. Trypan Blue assay was widely used in cytotoxicity test and the cost was inexpensive. It assessed cell metabolic activity and was developed as a non-radioactive alternative for measuring cell proliferation. In Trypan Blue exclusion method, cell viability was determined by counting the unstained cells with a microscope. A cell suspension mixture that contained 50 µL of cell suspension and 50 µL of trypan blue was transfer carefully to the edge of coverslip that was placed on the haemocytometer. Viable cell concentration and viable cell percentage were calculated using following equations:

where,
Cell/ mL = the average count per square × dilution factor × 104
Total cell/ mL = cell/ mL × original volume from which sample is removed
After cell viability was determined, the cells were diluted with the required culture medium to prepare the seeding density of cell. Then, the diluted cells were seeded and incubated at 37°C in 5% CO2 incubator. In this study, an experiment was carried out to evaluate and compare the toxicity induced by optimum soursop leaves extract and spray dried formulation in the same experimental set-up. Tryphan Blue Dye Exclusion method was used to determine cell viability by study the toxicity of both samples against PDL and HT-29 cell lines at different concentrations. This was very important because PDL and HT-29 reacted differently depending on samples concentration. Cells seeded at density of 4 × 10⁴cells/mL in 6 well plates. After 24 hours of incubation, cells were washed and extract at IC50 was added for treated cells. For untreated cells, they were grown in complete growth media only. Cells were incubated in 5% CO₂ 95 % O₂ at 37°C for 24, 48 and 72 hours. Cells were counted at 24, 48 and 72 hours to observe growth pattern of treated and untreated cells. Results were plotted by percentage in graph. Morphological of treated and untreated cells were analysed at same time with cell proliferation assay. Cells were examined for morphological changes at 24, 48 and 72 hours before the cells trypsinised for cell count using inverted phases contrast microscope.
Phytochemicals screening analysis
The extract with optimum condition obtained was further screened with phytochemical analysis test shown in table 2.
Table 2. Phytochemical Screening of the various extracts of the plant leaves
Name of Compound |
Primary and Secondary Metabolites |
Polysaccharide |
21.85 ± 0.001 |
Protein |
19.59 ± 0.000 |
Glycosaponin |
18.87 ± 0.001 |
Phenolic |
24.39 ± 0.001 |
Flavonoid |
21.49 ± 0.001 |
Key: + = Presence of Secondary Metabolite, Content: (+) =Little (++) =Medium
In this qualitative analysis of phytochemical screening, the extract exhibited positive results for nine phytochemical tests included alkaloids, terpenoids, flavonoids, coumarins, steroids, fatty acids, phlobatanins, phenolics, tannins, and saponins were seen to be present in this extract. This finding was in the agreement with other previous studies which have been done on ethanolic and aqueous extract on soursop leaf for antibacterial effect. Based on the results obtained, soursop leaves exhibited positive results for alkaloids, saponins, terpenoids, flavonoids, coumarins and lactones, anthraquinones, tannins, cardiac glycosides, phenols and phytosterols [18-20]. In the study done by Usunomena [21], the soursop leaf contained flavonoids, alkaloids, cardiac glycoside, tannins, triterpenoid, saponin and reducing sugar. In this phytochemical studies, the characterization of bio-active compounds or different chemical groups with reference to the technical was described in the previous journal [9,22,23]. The findings indicated that soursop leaf was a potential source of highly nutritious ingredients and phytomedicine.
Primary and secondary metabolites quantification
The quantification of primary and secondary metabolites was analyzed by spectroscopic method. The primary metabolites test include polysaccharide, protein, and glycosaponin were performed on the extract obtained from the optimum condition to check the quantity of primary metabolites present in it. Prior to this objective, secondary metabolites tests for compounds such as phenolic and flavonoid were also tested on the extract to check the content of antioxidant compounds present in it. The quantitative analysis of primary and secondary metabolites test were reported as shown in Table 3.
Table 3. Percentage total contents of primary and secondary metabolites in soursop leaf
Name of Compound |
Primary and Secondary Metabolites |
Polysaccharide (%) |
21.85 ± 0.001 |
Protein (%) |
19.59 ± 0.000 |
Glycosaponin (%) |
18.87 ± 0.001 |
Phenolic (%) |
24.39 ± 0.001 |
Flavonoid (%) |
21.49 ± 0.001 |
Figure 1 showed the comparison of radical scavenging activity between the positive controls; ascorbic acid (Vit. C), butylated hydroxyanisole (BHA) and sample using 2, 2, diphenylpicryl-Hydrazyl (DPPH) assay method. In this DPPH reaction mixture, ascorbic acid was used as positive control gave the fastest color change from purple to yellow. As for the samples, high concentration of an optimum sample showed bleaching of purple color during eye observation. However, low concentration of soursop leaves extract showed no obvious purple bleaching effect, even though there were decreases in the absorbance readings. Likewise, Figure 1 shows that for positive control, butylated hydroxyanisole (BHA) contained higher radical scavenging activity compared to ascorbic acid (Vitamin C). Meanwhile extract sample also showed the highest percentage of scavenging activity with the IC50 value (0.243 ± 0.001 mg/mL). However, the IC50 value for samples was still nearly the range of both positive controls, where IC50 value for BHA and Vit. C were (0.155 ± 0.001 and 0.232 ± 0.001 mg/ml) respectively (Figure 2,3).
Figure 1. The presence of methyl, methylene, and methine group in H-1 NMR spectrum
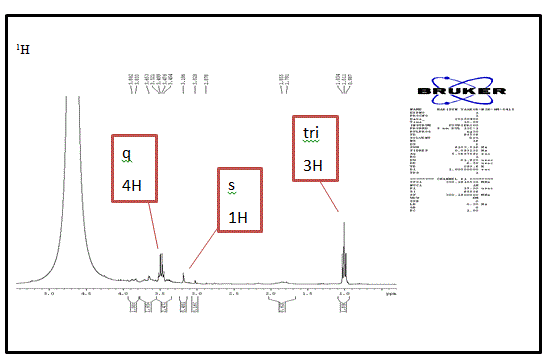
Figure 2. Comparison of radical scavenging activity between the positive controls; ascorbic acid (Vit. C), butylated hydroxyanisole (BHA) and sample. IC50 value (in mg/mL) for each sample was derived from the graph at 50 % radical scavenging activity
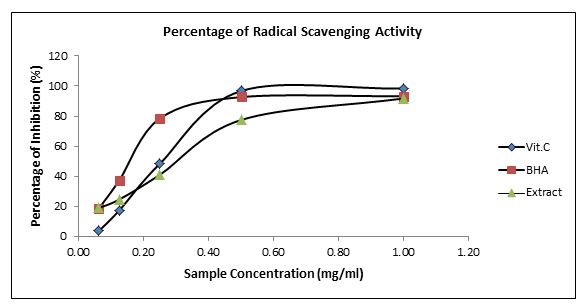
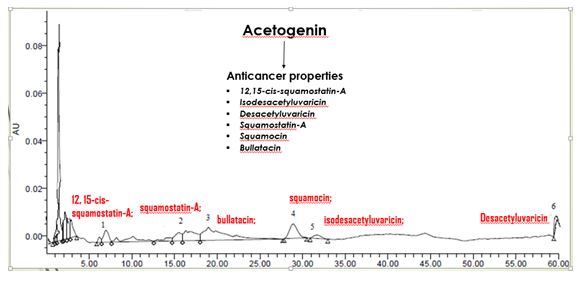
Figure 3. HPLC chromatograms of acetogenins compound was detected in soursop leaf. Peak identification: (1) 12, 15-cis-squamostatin-A; (2) squamostatin-A; (3) bullatacin; (4) Squamocin; (5) Isodesacetyluvaricin; (6) Desacetyluvaricin
High performance liquid chromatography analysis
The optimum extract sample was screened through High Performance Liquid Chromatography (HPLC) according to Yang [24] with slightly modification. Representative chromatograms of the acetogenins analytes for the sample with optimum condition was illustrated in figure 3. The figure displayed that the six acetogenins compound analytes were well separated and detected in HPLC screening process. The resolution between any two compounds in the sample was greater than 1.5. Other compounds in the sample did not interfere with analysis of the six acetogenins compounds analytes.
The chromatographic peaks were identified by comparing their retention time with that of each reference compounds reported from the previous journal [13]. The retention times of the compound in the extract remained the same and the coefficient of variation for retention time was less than 1 % which made a confirmation of the presence of acetogenins in the extract.
Nuclear magnetic resonances analysis
The presence of acetogenin compounds was detected by comparing the chromatographic profile of the extract with previous reported studies. The screening was focused on the first 60 minutes of chromatographic running where the desired compound was eluted. In the meantime, to confirm the presence of acetogenin compounds in this extract, other chromatographic techniques were used in the screening process such as Nuclear Magnetic Resonance (NMR) and Fourier Transform Infrared (FTIR). In this study, 1H, 13C and DEPT experiments were obtained from NMR analysis prior to the HPLC screening to confirm the presence of acetogenins compound in the extract. Proton Nuclear Magnetic Resonance (1H-NMR) spectrum was recorded to determine the number of protons in the molecule particularly in searching of hydroxyl functional group (OH) for this study. All protons in the compound could be accounted from the integration of 1H-NMR spectrum and based on the results obtained in this analysis, there was no hydroxyl peak was found in this extract. The 1H-NMR (Figure 1) resonances revealed the existence of three proton triplet at δ 0.9. The group was slightly deshielded, showing that it resided near a group, like C=C or C=O. One proton singlet was also observed at δ 3.3 followed by four proton quartets at δ 3.4. It was because this signal was a singlet (n + 1 = 1; n = 0), there cannot be any 1 H nuclei on the adjacent carbon. Turning to the low field side of the spectrum, there was a quartet (4 H) at 3.4 ppm. Any quartet signal (n + 1 = 4) indicated that the methylene proton (CH2) must have (n = 3) neighbouring protons that can only be the CH3 group or CH2 and CH groups.
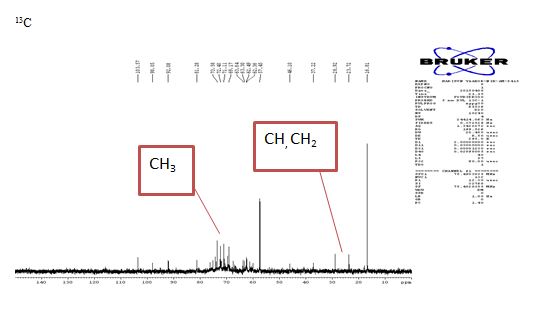
In order to know how the two groups were connected, the NMR spectroscopy must be incorporated with 13C spectrum (Figure 4). The 13C spectrum provided information of total number of carbon atoms in a compound where the number of peaks from the spectrum representing number of carbons. It had few signals and the most obvious signals were shift from 20 to 30 ppm and 25 to 35 ppm which indicated CH3CO- and R3CH group respectively. Meanwhile, the shift from 60 to 65 ppm indicated RCH2OH group and 67 to 82 ppm indicated alkynes group. The shift from 92 ppm indicated the alkynes and RC=CH group and 104 ppm indicated alkene and aromatic group. Here, the combination or relation between CH, CH2, and CH3 from the previous 1H spectrum showed the confirmation of the analysis. This 13C spectrum fully supports the structure derived. The peaks from this 13C spectrum analysis were relatively shorter due to the lower concentration sample preparation but the confirmation of acetogenin compounds can be further confirmed and identified through FT-IR analysis.
Figure 4. The presence of alkynes, alkene, and aromatic group in C-13 NMR spectrum
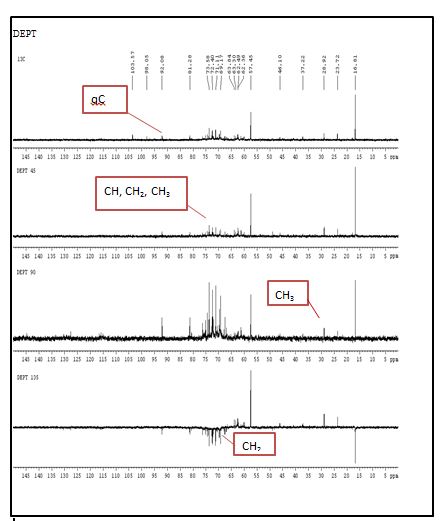
DEPT stands for Distortionless Enhancement by Polarization Transfer which was a polarization transfer technique for the observation of nuclei with a small gyromagnetic ratio which were J-coupled to 1H (most commonly 13C). In other word, DEPT was a spectral editing sequence that was used to generate separate 13C subspectra for methyl (CH3), methylene (CH2), and methine (CH) signals. In figure 5, there were three angles spectrum involved including DEPT 45° sequence which yields spectra with positive CH, CH2, and CH3 signals. DEPT 90° sequence yields spectra with positive CH signals and DEPT 135° yields spectra with positive H and CH3 signals and negative CH2 signals. Based on DEPT spectra, there were few number of peaks absent in DEPT 45° spectrum when compared to 13C spectrum. These peaks represented the quaternary carbons because it did not bound to any protons. The 45° spectrum also showed the existence of CH, CH2, and CH3 peaks. In 90° DEPT, CH signal peaks were appeared on the upper spectrum similar like in 135° DEPT. The existence of CH peak on the upper spectrum accompanied by CH3 peaks can be observed. The spectrum also revealed the existence of CH2 peaks in the down spectrum, a signal negative of the spectrum indicated the uniform result of 1H and 13C spectrum analysis which tallied to each other.
Figure 5. The DEPT analysis shows the existence of methyl, methylene, and methine group in H-1 NMR and in C-13 NMR spectrum
According to Chen [18], NMR spectroscopy can be carried out on crude plant extract without complex isolation and purification. The main problem is that the NMR spectrum provides low sensitivity, and it may be difficult to identify trace substances from the plants. However, with the analysis obtained from FT-IR, the identification of compounds or molecules would be much easier since the functional group present in the extract could be identified wisely.
Fourier-transform infrared spectroscopy analysis
Fourier transform infrared spectrometry is a physico-chemical analytical technique that does not resolve the concentrations of individual metabolites but provides a snapshot of the metabolic composition of a tissue at a given time [19]. In this study, the soursop leaves extract was prepared into liquid and solid form for the test. Both were passed into the FTIR and the functional groups of the components were separated based on its peak ratio. The soursop leaves extract was rich with phytochemical contents as shown in previously test. In this test, the results from the solid soursop leaves extract were compared to the liquid soursop leaves extract to check the confirmation of the functional group present in soursop leaves extract. Broad peak at 3262.75 cm-1 = OH groups (Figure 6a) compared to spectra of liquid form of sample 3327.21 cm-1 = OH groups (Figure 6b), 2936.15 cm-1 = CH2 and CH alkenes groups (Figure 6a), bend peak at 1394.17 cm-1 = CH3 alkane groups (Figure 6a), 1261 cm-1 = COC ester group (6a). As expected, in Figure (6a) the peak for OH groups remaining existed without the presence of solvent (deuterium oxide also known as water) confirming the peaks were from the sample. The IR spectrum revealed the presence of broad and strong adsorption of hydroxyl functional groups at 3262.75 cm-1.
Figure 6. Fourier transform infrared (FTIR) spectra through Attenuated Total Reflectance Infrared (ATR-IR) from KBr analysis of annonaceous acetogenin from Annona muricata leaves for solid (a) and liquid (b) form of the optimized crude extract.
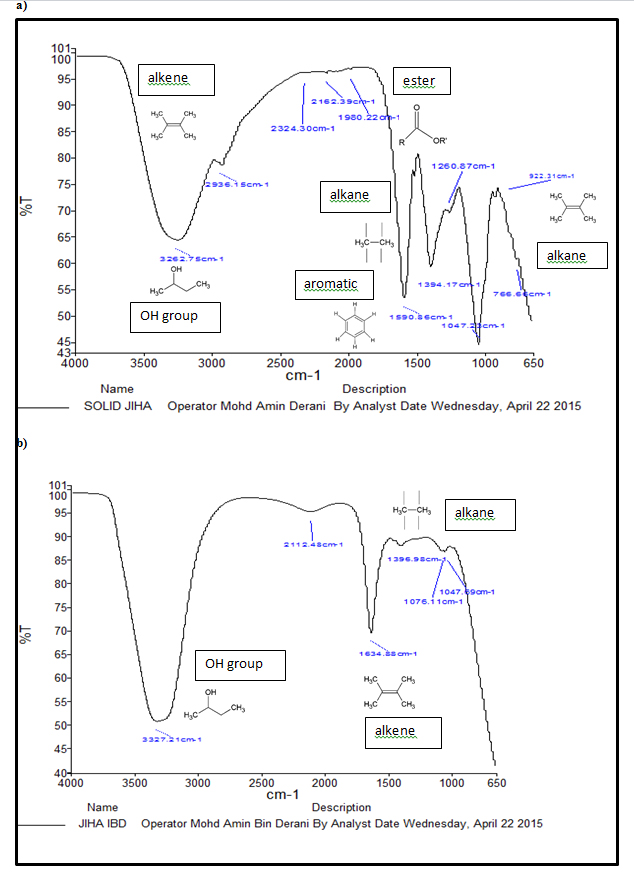
Based on the structure of annonaceous acetogenins from soursop, the presence of alkanes, alkenes, ester, aromatic ring and hydroxyl groups in the extract can be detected through FT-IR analysis. Hence, a potentially broad number of molecular fragments of acetogenins compound can be considered to be functional groups attached to an organic structure or backbone from this soursop leaves extract. However, most of compounds considered to be positive present in this extract including 12, 15-cis-squamostatin-A, squamostatin-A, bullatacin, squamocin, isodesacetyluvaricin, and desacetyluvaricin confirmed the analysis results from HPLC screening.
Tryphan blue dye exclusion viability cell count
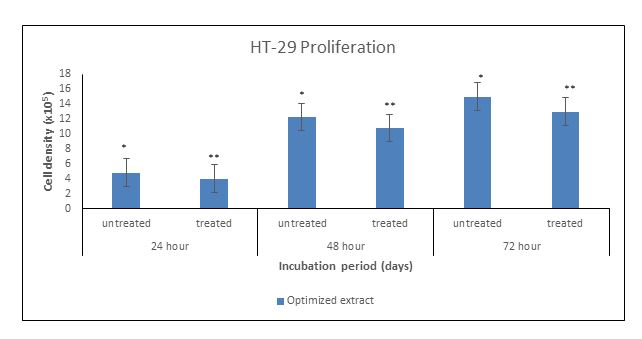
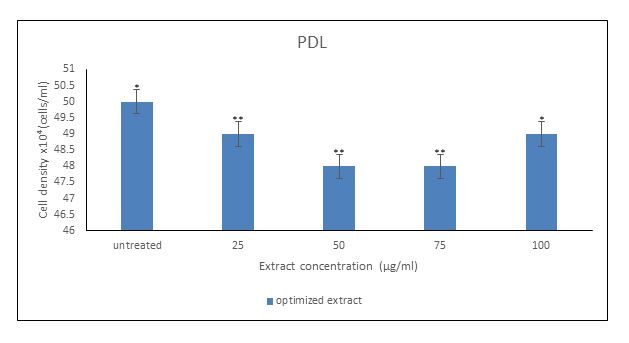
Figure 7 shown the viability of cell of optimum spray dried formulation on HT-29 colorectal cancer cell. It was observed that the percentage of cell inhibition increases with the increase of samples’s concentration. At lower concentration, optimum spray dried anticancer formulation stimulate the growth cell. At concentration from 25 µg/ml, the HT-29 cells started to suppressed significantly with p-value is less than 0.05. Using the trypan blue exclusion method, cells were harvested and viable cells counted using a haemocytometer at days indicated. The cells density of treated cells reduced significantly compared to untreated cells. This showed that both extracts did cause a suppression in proliferation on HT-29 cancer cell lines. The IC50 values for the optimized extract was 0.956 µg/ml showed that the optimized crude extract possess a higher IC50 values. The morphological cells was observed under the microscope before the initial seeding and continued to observe after given the treatment. Based on the Figure 8, there is no alteration or proliferation occurred even at the highest concentration of samples. In figure 8, both samples causes no toxicity or harm on normal PDL cell lines.
Figure 7. Cytotoxic study of optimum crude extract on colon cancer cell, HT-29 cell lines. Results were expressed as mean for triplicate wells + SE (*, p < 0.05; **, p < 0.01).
2021 Copyright OAT. All rights reserv
Figure 8. Cytotoxic study of optimum crude extract on normal PDL cell lines. Results were expressed as mean for triplicate wells ± SE (*, p < 0.05; **, p < 0.01).
Since bioactive compounds occurring in plant material consist of multi-component mixtures, their separation and determination still creates problems. Practically most of them have to be purified by the combination of several chromatographic techniques and various other purification methods to isolate bioactive compounds. However, the identification of the most potent anticancer compound (acetogenins) in A.muricata leaves has successfully determined through HPLC, NMR, and FT-IR techniques. Meanwhile, the cytotoxicity study showed that there is no apparent effect of the extract on normal PDL cell lines since the graph trending was similar among the samples with the untreated cells. Meanwhile in treating the cancer cells, HT29 (colon cancer) cell lines has been used and it was observed that the percentage of cell inhibition increases with the increase of samples’ concentration
- Veeresham C (2012) Natural products derived from plants as a source of drugs. J Adv Pharm Technol Res 3: 200-201. [Crossref]
- Wadood A, Ghufran M, Jamal SB, Naeem M, Khan A, et al. (2013). Phytochemical analysis of medicinal plants occurring in local area of Mardan. Biochem Anal Biochem 2: 1-4.
- Paiva SR, Kaplan DE, Gottlieb OR (1995) An Acad Bras Cienc 67: 461-466.
- Adjanohoun JE, Aboubakar N, Dramane K, Ebot ME, Ekpere JA, et al. (1996) Traditional medicine and pharmacopoeia: Contribution to ethnobotanical and floristic studies in Cameroon. OAU/STRC. 641.
- Taylor L (2002) Graviola. Technical data report for Graviola, Annona Muricata. Sage Press, Austin. 1-18.
- Lans CA (2006) Ethnomedicines used in Trinidad and Tobago for urinary problems and diabetes mellitus. J Ethnobiol Ethnomed 2: 45. [Crossref]
- Berlowski A, Zawada K, Wawer I, Paradowska K (2013) Antioxidant properties of medicinal plants from Peru. Food and Nutrition Sciences 4: 71-77.
- Nik Mat Daud NN, Mohamad Rosdi MN, Ya’akob H, Musa NF (2015) Optimization of soxhlet extraction parameter of Annona muricata leaves using Box-Behnken Design (BBD) expert and antioxidant analysis. Jurnal Teknologi 77: 27-37.
- Trease GE, Evans WC (1987) Pharmacognsy (13th edn). Balliere Tindall. London: 61-62.
- Chen Y, Roan H, Lii C, Huang Y, Wang T (2011) Relationship between antioxidant and antiglycation ability of saponins, polyphenols and polysaccharides in chinese herbal medicines used to treat diabetes. Journal of Medicinal Plants Research 5: 2322-2331.
- Dulekgurgen E (2004) Proteins (Lowry) Protocol. UIUC.
- Malaysian Standard (2010) MS No. 07U001RO, Phytopharmaceutical aspect of freeze dried water extract from Tongkat ali roots – Specification, Department of Standards Malaysia: 1 -13.
- Goel N, Siroshi SK, Dwivedi J (2012) Estimation of total saponins and evaluate their effect on in vitro methanogenesis and rumen fermentation pattern in wheat straw based diet. Journal of Advanced Veterinary Research 2: 120-126.
- Thaipong K, Boonprakob U, Crosby K, Zevallos LC, Byrne DH (2006) Comparison of ABTS, DPPH, FRAP, and ORAC assays for estimating antioxidant activity from guava fruit extracts. Journal of Food Composition and Analysis 19: 669-675.
- Cantin CM, Moreno MA, Gogorcena Y (2009) Evaluation of the antioxidant capacity, phenolic compounds, and vitamin c content of different peach and nectarine [Prunus persica (L.) Batsch] Breeding Progenies. J Agric Food Chem 57: 4586-4592.
- Norshazila S, Syed Zahir I, Mustapha Suleiman K, Aisyah MR, Kamarul Rahim K (2010) Antioxidant levels and activities of selected seeds of Malaysian tropical fruits. Malays J Nutr 16: 149-159. [Crossref]
- Yang Z, Luo S, Peng Q, Zhao C, Yu Z (2007) GC-MS analysis of the essential oil of coral ginger (Zingiber corallinum Hance) rhizome obtained by supercritical fluid extraction and steam distillation extraction. Cromatographia 69: 785-790.
- Chen ZL, Xu R, Ye Y, Zhao W (2010) Section 1, chemical properties, isolation, and purification. Introduction to Natural Product Chemistry.
- Griffiths PR, de Haseth JA (1986) Fourier transform infrared spectroscopy. New York. Wiley.
- Gavamukulya Y, Abou-Elella F, Wamunyokoli F, AEl-Shemy H (2014) Phytochemical screening, anti-oxidant activity and in vitro anticancer potential of ethanolic and water leaves extracts of Annona muricata (Graviola). Asian Pac J Trop Med 4: 930-939. [Crossref]
- Usunomena U (2012) Review Manuscript: A review of some African medicinal plants. International Journal of Pharma and Bio Sciences 3: 1-11.
- Farnsworth NR, Bederka JP Jr, Moses M (1974) Modern approaches for selecting biologically active plants. I. CNS depressants. J Pharm Sci 63: 457-459. [Crossref]
- Zohra SF, Meriem B, Samira S, Muneer MS (2012). Phytochemical screening and identification of some compounds from Mallow. Journal of Natural Product and Plant Resources 2: 512-516.
- Yang H, Li X, Tang Y, Zhang N, Chen J, et al. (2009) Supercritical fluid CO2 extraction and simultaneous determination of eight annonaceous acetogenins in annona genus plant seeds by HPLC-DAD method. J Pharm Biomed Anal 49: 140-144. [Crossref]