Background: The trends in death in the UK, Europe, Australia, New Zealand and America show evidence for extended periods of higher than expected deaths. This study investigates the detail of these trends using Mid Super Output Areas (MSOA) in England and Wales, containing 10 to 100 male or female deaths per annum.
Objective: To study the trend in deaths for both male and female residents of MSOA, and seek to identify a recurring series of curious and unexpected step-like increases in death which endure for around 12-months before abating.
Methods: A running 12-month sum of deaths was constructed for each MSOA over the period Jan-01 to Dec-14. Blocks of 12-month deaths were compared each side of a given date to detect step-like increases in deaths which endure for a period of around 12 months before reverting back to the baseline level.
Results: Deaths in each MSOA are marked by a regular series of step-like increases which initiate at roughly two year intervals, however across England and Wales around 1% of MSOA initiate a maximum magnitude event at any point in time. When clustered to larger areas, depending on the timing (synchrony) and magnitude in the smaller areas, these events can cause either a cancelling-out effect or re-inforce each other to create larger local, regional or national events. Female deaths show a tendency for larger step-like increases than males. The maximum increase in deaths declines with increasing size of the MSOA (average deaths per annum) and follows a Power Law function. For MSOA containing around 10 deaths per annum, the largest step-like increase in deaths range from +58% to +300%. Extrapolation back to around 0.1 deaths (roughly 8 households or a small social network) gives a maximum potential increase around + 1,000%. Males and females appear to behave as separate compartments and each can lag behind the other due to random events surrounding initiation of each ‘outbreak’. Other studies indicate that these events instigate periods of higher emergency department attendance, emergency medical admissions, GP referral and sickness absence, and even a wobble in the gender ratio at birth.
Conclusions: These events provide evidence for the existence of a new type of disease entity. There are implications to the monitoring of deaths and mortality rates between areas and countries, most importantly that the unique spatiotemporal spread can lead to these events being obscured in larger aggregates such as a country or region. The larger increase in death in females is also reflected in larger increases in female medical admissions during these events, and seeming selective loss of the female fetus. It remains unknown why there is an approximate two-year periodicity, and why the magnitude of each event in each MSOA shows such high variation over time, although chance transmission and a moderate degree of seasonal forcing (winter) appear involved.
time series, deaths, mortality, morbidity, step-like change, infectious outbreaks, cytomegalovirus, emerging infectious diseases, spatiotemporal analysis
The long-term trend in all-cause mortality seen in each location is determined by past births, immigration (especially into popular retirement destinations), improvements in life expectancy, and the impact of adverse events such as extreme heat/cold and infectious outbreaks. Extremes of heat/cold rarely last for more than two months and usually only for a few weeks. The last extreme cold period in the UK occurred in December of 2010, while an extreme heat wave occurred across Europe during the summer of 2003 [1,2]. Extreme heat/cold, i.e., large deviation away from 17°C, lead to increased deaths with extremes of heat being more detrimental [3]. For example, in a large Dutch study a -22°C or a +10°C deviation away from 17°C both generate around a 14% increase in daily deaths, although complex time lags are also involved [3]. Hence the December 2010 period of extreme cold across the UK only led to a 6% increase in deaths relative to the average for December over the previous five years [4], and therefore had only a small effect on the annual number of deaths.
It is well known that deaths are seasonal, with higher deaths during the winter months due to a combination of cold, lower sunlight intensity and related vitamin D insufficiency [5-8], and seasonal respiratory infections [9-11]. For this reason, studies of increased deaths tend to focus on the ‘excess’ winter mortality [4]. Methods such as EuroMOMO [12] also attempt to detect instances of ‘excess’ mortality at a weekly level (all ages and by age bands) throughout the whole year using a sinusoidal form for the seasonal pattern of deaths at whole country level across Europe.
As with all attempts to model the real world, the models incorporate the extent (and limitations) of current knowledge in a field. In this respect, a curious repeating series of presumed infectious events leading to periods of increased death, emergency department attendance, emergency medical admission, General Practitioner (GP) referral, and sickness absence have been noted within the UK since the early 1950’s [13-30]. The onset of each event also appears to trigger cyclic changes in the gender ratio at birth [31]. Lack of computerized data for hospital admissions prevents analysis prior to the 1990’s although a similar time series of events appears to occur in the US, and can be traced back to the 1960’s via the impact on health care costs [16,19,22,30].
A period of excess deaths coincides with the onset of these presumed infectious events [17-18,20-23,28,30]. The increase in both medical admissions and deaths is confined to a set of conditions/diagnoses all of which have an apparent immune function basis, i.e., infection, inflammation and autoimmunity [14,17-19,27-28,32-37]. Persons with Alzheimer’s and dementia suffer the greatest mortality during these events [37-39]. An immune linkage is further supported by single-year-of-age saw tooth patterns in the magnitude of the increase in both deaths and admissions [40]. Such patterns are generated via ‘antigenic original sin’, which arises from repeated exposure of a population to a series of different strains of an infectious agent. This was first reported for influenza by Francis in 1960 [41]. Interaction between this agent and influenza appear likely [42].
As to the link between medical admissions and deaths there is a well-recognized association between the approach of the end-of-life, irrespective of age, and hospital admission. In one record-linked study of deaths in England, covering the last three years of life some 75% of the hospital bed days in this period occurred in the last year of life. There was an average of nearly four admissions to hospital in the last three years of life, which peaked for children aged 5 to 15 with an upper quartile of nine admissions, and which declined to 3 admissions for those aged >85 [43]. An Australian study showed that 70% of persons had a least one emergency department attendance in the last year of life (average of 1.9 visits), and average number of admissions were 7.6 for cancer and 8.1 for non-cancer conditions. On the day of decease 62% were in hospital [44]. This link between end of life and emergency admissions, and the implications to reducing emergency admissions and bed occupancy has been recently reviewed [45]. Hence any agent leading to a large and unexpected increase in deaths will increase hospital admissions as persons fall ill prior to death. This link (along with spatial spread of the agent) has been confirmed in both Northern Ireland and Scotland where deaths appear to lag behind emergency medical admissions or emergency department attendances by around four to eight weeks [23,46]. Unpublished analysis by the author shows that deaths lag behind the onset of the change in gender ratio (at conception) by around four months.
Prior to the 1990’s these presumed infectious events usually only occurred around twice per decade, however, during the 1990’s there were three events in 1993,1996 and 1999, and since 2000 there has been an unprecedented series at two year intervals centered around 2002, 2004, 2006, 2008, 2010, 2012, 2014 and 2016 [16,20,30]. This novel step-like and semi-permanent increase seen in both medical admissions and deaths suggests that a running 12-month sum may be the most appropriate method to investigate the onset and duration of these events [15,21,23,24,27,28]. A running 12-month total acts in the same way as a frequency filter to remove extraneous background noise, also acts to smooth-out underlying seasonal patterns, and minimizes Poisson scatter associated with the smaller monthly numbers.
In the field of medicine, it is well recognized that infectious agents, with an acquired immune response, exhibit a characteristic repeating time-series of infectious outbreak [47]. This is best illustrated by the two sexually transmitted agents, gonorrhea and syphilis. The latter stimulates an immune response while the former does not. Syphilis exhibits an approximate nine-year cycle in incidence, while gonorrhea has no discernable cycle [48]. The characteristic cycle time can be modified by immunization [49]. With over 1,400 agents known to infect humans [50], there is the potential for undiscovered long-term cycles in both morbidity and mortality. Further interaction between common pathogens, and multiple strains of the same pathogen – called the pathogen burden [51-55], can only increase the observed complexity and diversity of cycle times.
For example, the technology has recently been developed to detect an immune response following exposure to all known 206 species of virus (> 1,000 strains) which infect humans by analysis of a single drop of blood [56]. As part of the validation process for this technology, blood from 569 persons from Peru, South Africa, Thailand, and the United States was screened for the extent of viral exposure. Those with HIV/AIDS registered a higher proportion of exposure to 14 common viruses as did the non-US countries. Epstein Barr virus, Rhinovirus A & B, Adenovirus C, Respiratory Syncytial virus and Herpes Simplex 1 being the most commonly detected viruses in non-HIV persons [56]. Most common exposure was 10 viruses per person, with up to 62 viruses in five individuals and 84 in two individuals.
Another study involving exposure of Mexican Americans to 13 common pathogens showed that 74% had antigens to 6 or more pathogens, while 53% had been exposed to 7 or more, and 11% had been exposed to more than 9 pathogens [57].
These studies are entirely relevant to the concept called the ‘pathogen burden’ where disease severity appears to increase with higher numbers of pathogens, i.e. combinations of pathogens may be more detrimental to health than the single pathogen studies currently indicate [22,46,55,58]. In this respect Cytomegalovirus (CMV), via its huge repertoire of immune evasive and modulating genes, may be acting as an agent provocateur to other pathogens [22,46,58] – despite being widely regarded as largely innocuous.
Having established that disease surveillance may be more complex that a few well-known pathogens such as Influenza - with surprisingly low levels of exposure in the study of Xu et al. [56], confirming a suspicion that influenza alone may not be the feared pathogen that Public Health agencies appear to believe [42], it is apposite to note that a time series of monthly deaths can indeed hide patterns not detected by typical disease surveillance methodologies [59].
This study will re-examine this phenomenon using a running 12-month total of both male and female deaths for 7,201 Mid Super Output Areas (MSOA) across England and Wales between 2001 and 2014. An MSOA is roughly similar in size to an Electoral Ward. In the UK, Census data is collected at Output Area (OA) level containing roughly 300 persons, and is then aggregated up to higher geographies. In the 2011 Census, MSOAs in England & Wales contained an average of 7,790 persons (3,245 households), and are contained within the boundary of 375 local government areas.
Data
A running 12-month total of deaths (all-cause mortality, by month in which the death occurred) from January 2001 to December 2014 for person’s resident in MSOA in England & Wales was obtained by request from the Office from National Statistics (ONS). The data was obtained as a running 12-month total to avoid small number data protection issues which would arise with monthly data.
For each MSOA the 2015 Index of Multiple Deprivation (IMD), population by single year of age, population density, proportion of population by ethnic origin, classification of rurality, and (mid-2009 to mid-2010) population turnover rates, were all obtained from the Office for National Statistics.
Methods
Total deaths in each 12-month period were compared to total deaths for the same months in the period 12-months prior, i.e. deaths in January to December 1991 were compared to January to December 1990, increment both by one month and repeat the comparison. The ratio of the two periods was calculated to detect points in the time series when the 12-month total of deaths was at a local maximum.
Average, median and standard deviation were used to evaluate month-of-year (seasonal) and other effects and results are summarized in Tables and a variety of charts. Additional material is available in the Appendix at the end of the paper. All data manipulation was performed using Microsoft Excel.
Statistical significance was evaluated using Poisson statistics. The standard deviation of a Poisson distribution is by definition equal to the square root of the average. Hence dividing the magnitude of a step-change in deaths by the square root of the average number of deaths converts a numerical increase into a standard deviation (STDEV) equivalent change. In a Poisson distribution 85% of outcomes lie below + 1 STDEV, 97.7% below + 2 STDEV and 99.8% below + 3 STDEV. Hence if only pure chance were involved only 2.3% of calculated step-change values would be expected to lie above + 2 STDEV equivalents, etc.
To evaluate the effect of different variables on the magnitude of these events data for London was analysed using the sophisticated ‘Solver’ simultaneous optimization program available in Microsoft Excel. Default settings were used to run the simultaneous optimization. All variables were assumed to have a linear additive effect on the magnitude of the largest step-increase. Optimization was performed to minimize the sum of the absolute deviation between the actual and predicted increase.
A running 12-month total
Figure 1 presents three examples of the time-trend generated using a running 12-month total. The first MSOA is in the City of London while the other two are from Barking and Dagenham. Evident is a degree of saw-tooth behavior. In a running 12-month total the onset of a step-like increase in deaths occurs at the foot of a saw-tooth feature, the slope of the ramp reflects the value of the step-increase, while the full extent of the step-change is revealed 12-months later (if the step-change has endured for 12-months). At cessation of the event, the downward part of the saw-tooth indicates a sudden return to the previous lower level of deaths.
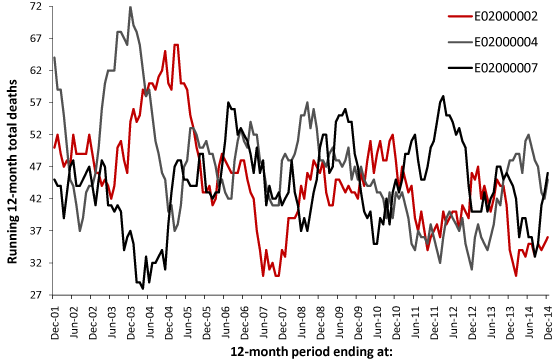
Figure 1. Running 12-month total of female deaths in three London MSOA, commencing at January to December 2001 (first data point) and concluding at January to December 2014.
As can be seen there is evidence for a collection of large peaks, i.e., a step-like event which has endured for a minimum of 12-months, which sometimes occur reasonably close in time between MSOA but in some instances the peak in one coincides with a trough in another. This saw-tooth behavior is not supposed to exist, and if it was noted in the past was probably dismissed as some quirk of statistics.
The nature of these remarkable step-up and step-down (rectangular wave) features will now be explored in greater detail. To simplify the analysis this study will concentrate on the timing and magnitude of the largest event in each MSOA for both males and females.
Statistical significance
Table 1 and Figure 2 detail the largest step change in each MSOA from 2001 to 2014.
In Figure 2 the line at +2 STDEV represents the 97.2% confidence interval, namely, if Poisson randomness were the only factor then 97.2% of all data should lie below the red line – which is clearly not the case. The striations in Figure 2 arise from the fact that the running 12-month differences are between integer values, hence the STDEV differences are not totally continuous. Converting the magnitude of the maximum increase into STDEV equivalents automatically adjusts the data for the effect of size (number of deaths), and as such the data shows no underlying trend due to size. The R2 indicates that 99.93% of the scatter is due to factors other than size. For women, the average step-increase or step-decrease (at the cessation of each event, ± standard deviation in brackets) is 3.37 ± 0.74 and 3.49 ± 0.74 respectively, while for men 3.35 ± 0.69 and 3.4 ± 0.7 respectively. To convert STDEV equivalents into a percentage change simply divide by the square root of the average number of deaths. Hence at 100 deaths a 5 STDEV increase is equivalent to a 50% step-increase in deaths, while at 40 deaths it is equivalent to a 79% step-increase.
Due to the notable event occurring in 2012 [20,24,28-30], Table 1 also investigates the step-like increases clustered around 2012. As can be seen the distribution of percentage increase associated with the largest event in each MSOA, and for the 2012 event, is far beyond anything which could arise from random factors. Also seen in Table 1 is a disposition to a larger increase in females than males, especially in the 2012 event.
All the data points in Figure 2 are subject to Poisson uncertainty. For example, the maximum value for a step-up is 7.8 STDEV equivalents. In the worst case, this point could have been subject to a + 3 STDEV increase due to Poisson randomness, leaving a guaranteed minimum increase more than + 4.8 STDEV equivalents. This data point occurs in an MSOA with an average of 56 deaths per annum, hence 1 STDEV = 7.48 or 13.4% of the average deaths. The guaranteed minimum step-increase for this MSOA is therefore a remarkable 51% increase in deaths.
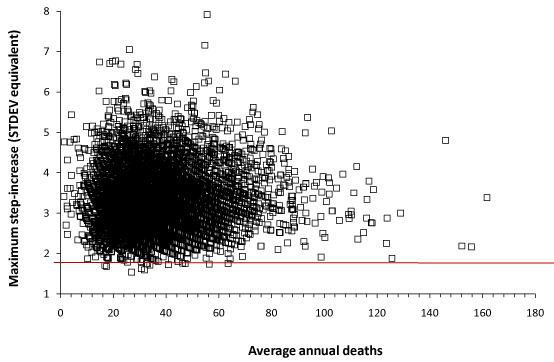
Figure 2. Maximum step-increase in deaths for women in each MSOA (expressed as a standard deviation equivalent increase) versus annual average deaths
For all MSOA in this study, after converting the percentage increase to the equivalent at 100 average deaths, the median for the maximum step-change seen in males was 36% (interquartile range 32% to 41%), while for females was 37% (interquartile range 32% to 42%). This represents an alarming increase sustained for a period of 12-months before the effect of the agent abates and deaths eventually return to the baseline level. In a MSOA with an average of 30 deaths these percentage values increase by a factor of 1.826-times, hence a median increase of 67%.
Outbreaks occur continuously
The possibility that outbreaks of the agent may occur at any time was investigated by measuring the percentage of MSOA initiating a maximum magnitude event in each month of the time series. The results of this analysis are presented in Figure 3. For males, the proportion of MSOA ranged from 0.36% to 1.65% (average 0.89%, IQR 0.78% to 1.01%), while for females had a wider range from 0.25% to 1.87% (average 0.91%, IQR 0.75% to 1.04%). The standard deviation for the series was 21% of the average in males and 30% in females. Periods of higher incidence (higher synchrony) of maximum magnitude events can be seen in Figure 3 commencing around January 2002, November 2002, January 2010 and October 2011, with less prominent events in 2005 and 2008. Females tend to show a more pronounced minimum in incidence before the onset of a national event than males.
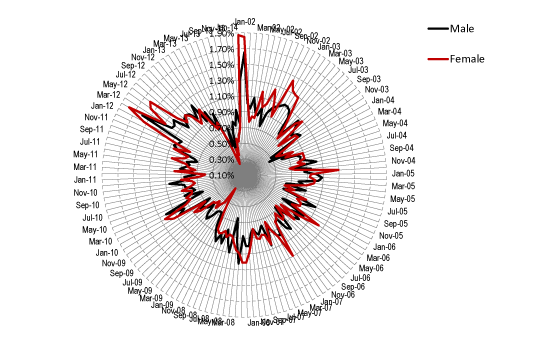
Figure 3. Relative frequency for the initiation of maximum magnitude events in each MSOA (male/female) between Jan-02 and Jan-14.
Hence a baseline level of around 0.9% of MSOA are experiencing the initiation of a maximum magnitude event at any point in time, and for as-yet unknown reasons, there are larger national events when the synchrony between all MSOA is greater.
Including events with less than maximum magnitude increase will significantly increase this baseline. Assuming an event once every four years would increase the baseline by 3-times. We are clearly searching for an agent capable of regular mini-outbreaks.
Seasonal forcing
Seasonal forcing is a characteristic of most epidemics as seasonal factors such as temperature, rainfall, etc act to initiate fresh outbreaks. Figure 4 presents the month of onset for the maximum magnitude event in each MSOA.
As can be seen the most common initiation for maximum magnitude events occurs in January (around 10%) with February/March slightly less frequent at around 9% each, and there is a definite minimum in August of around 8%. A potential link with vitamin D is also possible for an infectious etiology. The level of vitamin D in the blood generally lags behind sunlight exposure and as can be seen in Figure 4 the proportion of the population (Scotland) who are vitamin D deficient roughly follows the same month of year profile. Vitamin D does not act alone and temperature is also a contributing factor, which may partly explain the poorer match in February and March.
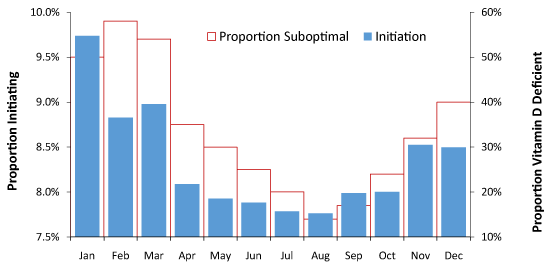
Figure 4. Proportion of initiation (maximum magnitude) by month of year and proportion of persons who are Vitamin D deficient. Data for proportion Vitamin D suboptimal is from a study in Scotland [7].
However, the range between August and January is not large, suggesting that other factors also play a role. This is demonstrated in Figure A1 in the Appendix where the month of initiation for maximum magnitude events varies considerably between years.
As Figure A2 demonstrates season does not appear to play a major role in determining the size of maximum magnitude events. Maximum magnitude may be slightly larger in July to September, and possibly also December and January. However, the difference between maximum and minimum only equates to 1.2 deaths in an MSOA with an average of 100 deaths per annum, and is not statistically significant. It can be concluded that seasonal forcing appears to have minimal effect on the magnitude of the events and a moderate effect on initiation.
Are some areas affected worse than others?
Figure 1 gives a hint that some areas may be affected worse than others and Figure A3 explores this concept by looking at the variation between MSOA for combined step-up and step-down across both genders. The MSOA identified at the extremes of Figure A3 require further investigation to see if there are any common factors leading to differences in the increase in deaths.
Investigation of potential effects due to population density, inward or outward migration, or urban/rural location using the ONS urban/rural classification did not yield any readily identifiable factors associated with a large increase (data not shown).
Gender-specific effects were therefore investigated using MSOA located in London (which contains the widest range in ethnic composition, population density, and other demographic factors) with linkage to a wider range of MSOA demographic factors. The impact of these factors was evaluated in a linear additive model using the sophisticated Excel Solver function which conducts simultaneous optimization for the factors affecting the maximum increase in deaths for males and females. On this occasion the optimization was performed to minimize the sum of the absolute value of deviations between the actual and modelled outcome.
Results of these studies are given in Table 2 where it can be seen that males and females do indeed respond very differently to the available population characteristics.
Several points are of interest, namely that the intercept and average residual per MSOA are high indicating that random contact in social networks makes the highest contribution to the magnitude of each event. Factors such as deprivation and population density play a minor role. From Figure 2 it was noted that initiation of these events was more variable in females than males. Higher variability in the magnitude of the events for females was also identified in Table 1 and this theme is continued in Table 2. Since deaths are far more common in the elderly the percentage of the population aged 65+ would be expected to be important, however, this is only the case in women. Of interest is the fact that the magnitude of the increase in women (more persons infected) also increases with the proportion of young children. In men, racial characteristics appear to play a greater role.
In conclusion, while the magnitude of each outbreak appears to be largely a result of random contact between individuals, however in women, contact between the young and elderly appears to play a significant role.
Role of gender on timing of initiation
Figure 2 and Table 2 have identified unique behavior due to gender. In this respect Figure 5 demonstrates curious differences between the genders in terms of the timing of the initiation of each event. The saw-tooth behavior in Figure 5 arises from the step-up and step-down behavior at the start and end of each event. Figure 5 also illustrates the method used to determine the magnitude of each event which uses a running difference. For example, the first data point at Jan-02 gives the difference between January to December 2002 versus January to December 2001. If this ratio (or percentage difference) was at a maximum, then the step-increase would have commenced at January 2002. Move forward one-month and repeat the calculation. In a running 12-month total initiation of a step-increase occurs at the foot of each saw-tooth while the pinnacle measures the magnitude of the increase. As can be seen either gender can lag behind the other regarding initiation which reinforces the concept that random contacts play a significant role in these outbreaks.
Having established that there are systematic factors regulating the response of males and females to these presumed infectious events the differences in the timing of onset noted in Figure 5 were investigated in further detail for the step-increase associated with the 2012 event.
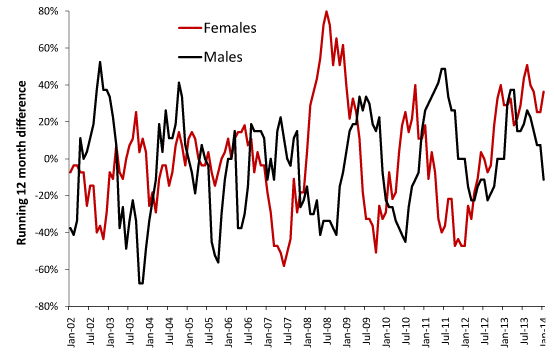
Figure 5. Running 12-month differences for male and female deaths in MSOA E02000009 located in the Barking and Dagenham Local Authority (London).
Given the seeming relatively slow spread of the agent it is sometimes difficult to know when one event stops and another commences. Hence the analysis in this section identified the maximum step-increase for males and females in each MSOA occurring in the interval September 2011 to September 2013. The result of this analysis is given in Figure 6 where it can be seen that both male and female initiation date can lag equally behind each other. This suggests that initiation is driven largely by random events. The range of ± 24 months is simply because the 24-month range in the period of analysis has picked up higher magnitude events in the tail of the 2010 event through to early initiation in the 2014 event.
However, this limitation aside it is evident from Figure 6 that there is no preference for early/late initiation for either gender. In Figure 6 a positive difference implies female before male while negative indicates female initiation later than that for males. Give the results from Table 2 it is evident that males and females act as two separate compartments in terms of the random contacts which contribute to the timing and magnitude of these events.
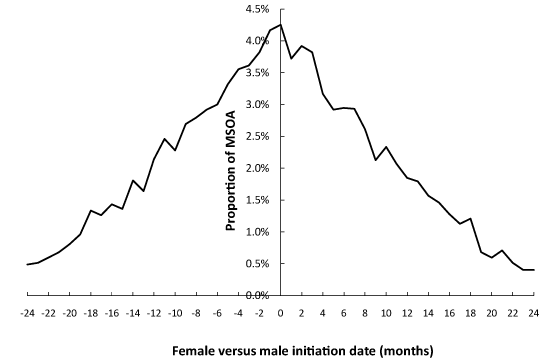
Figure 6. Difference in months between initiation of the maximum step-increase for females versus males over the period Sep-11 to Sep-13.
Theoretical maximum increase in deaths
It is generally accepted that infectious diseases are transmitted within small social networks. While an MSOA is a small geographic unit they still contain around 3,245 households which will represent many social networks. In the UK census data is collected at the level of an output area (OA) which contains around 300 persons, while the next level of aggregation is a lower super output area (LSOA) containing around 1,500 persons. Deaths at OA level will be very volatile with a high proportion of zero deaths. However, a recent study has analysed the effect of these outbreaks on deaths between 2002 and 2013 in over 32,000 LSOA from England and Wales and has also demonstrated similar results [60]. Due to the smaller number of deaths in each LSOA, the analysis was conducted using calendar year totals. The limitation of this method is that events initiating in mid-year can be missed, however, the degree of seasonal forcing demonstrated in Figure 4 allows many of the larger step-changes to be identified.
Figure 2 and Table 1 both demonstrated that most maximum amplitude events exceed the + 2 STDEV threshold. Figure 7 therefore presents the combined data from this study and the LSOA study. On both occasions the average value for the maximum step-up or step-down has been calculated for each MSOA or LSOA. Data from the LSOA study which failed to exceed the +2 STDEV threshold (29% of LSOA) were excluded on the basis that this study was likely to underestimate the maximum change in some LSOA. Analysis has been restricted to females. As expected the data from the MSOA study tends to lie at slightly higher values than the LSOA study.
Table 1. Proportion of MSOA where the largest step-change (up or down) exceeds various statistical thresholds. Magnitude of the largest step-change has been expressed as STDEV equivalents
Magnitude (STDEV) |
2001 to 2014 |
2012 Event |
Poisson |
Step-up |
Step-down |
Step-up |
Male |
Female |
Male |
Female |
Male |
Female |
>1.0 |
100% |
100% |
100% |
100% |
91.30% |
92.00% |
14.70% |
>1.5 |
100% |
100% |
100% |
100% |
77.10% |
77.30% |
6.32% |
>2.0 |
99.30% |
99.10% |
99.30% |
99.60% |
56.30% |
56.00% |
2.27% |
>2.5 |
90.80% |
89.70% |
92.00% |
92.70% |
35.10% |
35.70% |
0.68% |
>3.0 |
66.80% |
67.00% |
69.70% |
73.70% |
19.20% |
19.30% |
0.17% |
>3.5 |
37.50% |
38.50% |
40.90% |
44.80% |
9.20% |
9.50% |
0.04% |
>4.0 |
16.60% |
18.20% |
18.80% |
22.00% |
3.70% |
3.90% |
0.01% |
>4.5 |
6.10% |
7.70% |
7.00% |
9.20% |
1.20% |
1.50% |
0.001% |
>5.0 |
1.90% |
2.60% |
2.30% |
3.40% |
0.30% |
0.50% |
0.0001% |
>5.5 |
0.60% |
0.90% |
0.60% |
1.20% |
0.10% |
0.20% |
|
>6.0 |
0.22% |
0.40% |
0.15% |
0.43% |
0.03% |
0.12% |
|
>6.5 |
0.03% |
0.14% |
0.04% |
0.22% |
0% |
0.04% |
|
>7.0 |
0.01% |
0.04% |
0% |
0.08% |
0% |
0.01% |
|
>7.5 |
0% |
0.01% |
0% |
0.04% |
0% |
0% |
|
In Figure 7 a single death represents a social network comprising roughly 80 households, while an average of 0.1 deaths is somewhere around 8 households. As can be seen extrapolation back to an average of 0.1 deaths per annum will cross the Y-axis at somewhere around a 1,000% increase in deaths (range +700% to +2,000%) for the 12-month duration of a maximum amplitude outbreak.
We are clearly dealing with a formidable pathogen whose existence has been hidden within the confusing jumble of mini-outbreaks which have been continuously occurring for many years.
Spatial spread
This study is designed to complement a series of studies demonstrating similar behavior in medical emergency admissions during the 2008 (North East Essex), 2010 and 2012 (Wigan, Berkshire) outbreaks, which were also conducted at MSOA level [27-29]. The effect of the 2010 and 2012 outbreaks upon medical admissions were also documented at lower super output area (LSOA) in Wigan and Berkshire [61-63]. There are around 4 to 5 LSOA within each MSOA, and spatial spread within smaller areas within an MSOA has therefore been demonstrated.
Other studies have demonstrated similar spread of deaths in Australia, New Zealand [64], and Northern Ireland where simultaneous spread of deaths and medical admissions has been documented [46]. In areas with more than 100 deaths per annum the roughly linear relationship seen in Figure 7 begins to plateau [16,64]. This is due to the cancelling-out effect of these outbreaks arising from differences in timing and magnitude of the mini-outbreaks within the larger area [65]. Hence at national level the ability of this agent to cause large increases in deaths (up to 1,000%) are largely hidden, and has therefore been overlooked by traditional disease surveillance methodologies [16,64].
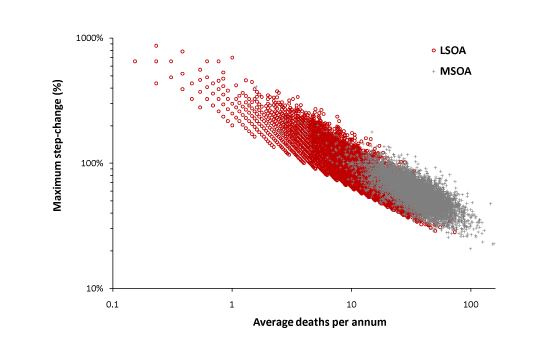
Figure 7. Combination of two studies to extrapolate the theoretical maximum increase in female deaths likely in a small social network.
This study has added to our knowledge of this unique infectious agent and has confirmed that the 12-month duration is maintained in very small spatial units, i.e. the duration is a fundamental property of the infection. The apparent magnitude of the increase in deaths is most probably related to the number of persons who are eventually infected, but especially among the elderly who appear to be the main target in so far as death is concerned. Clearly the effects are not confined to the elderly since emergency admissions and emergency department attendances also increase, however, across a wider range of ages [16,66]. NHS staff sickness absence also increases [67], although the effect increases in magnitude as age increases (unpublished studies). Finally, even the gender ratio at birth is affected [31], indicating transmission to the fetus from women typically in their 20’s and 30’s.
Also confirmed is the fact that each outbreak is highly granular and that maximum magnitude outbreaks occur somewhere around one in ten years (as per Figure 1).
This study has however given additional insight into the role of gender, seasonality, and time lags between the genders.
Seasonal factors
Many infectious outbreaks occur more frequently in the winter months [68-74] and recent evidence suggests that this may be due to the central role of vitamin D in immune function [75-85]. In this respect Figures 4 suggests an infectious outbreak with a seasonal preference which appears to align with the periods of lowest vitamin D sufficiency in the population. The link with vitamin D is not entirely matched, and factors such as temperature probably also play an additional role. This potential link requires further study in respect to selective supplementation of the population aged 65+ with vitamin D as a means of diminishing the effects of the outbreaks [85].
This study suggests that the seasonal forcing is only moderate (Figure 4), and can be variable between years (Figure A1). However, the effect of season on magnitude of the events is minimal (Figure A2).
Effect of gender
While it is already known that emergency admissions increase more in females during these events [16], and that the female fetus is a specific target, presumably by spontaneous abortion in the first trimester [31]. This study has demonstrated that the two genders behave as separate compartments. Timing differences between the two genders are symmetric indicating that chance transmission in social networks are likely to be involved (Figure 6), and magnitude responds to different population characteristics (Table 2). In both instances, random forces appear to play the strongest strong role in transmission and subsequent generation of a mini-outbreak.
Table 2. Estimates for an assumed linear relationship in parameters potentially influencing the maximum increase in deaths (in STDEV equivalents) in each MSOA using simultaneous optimization to minimize the sum of residuals. Data is for MSOA in London.
Parameter |
Female |
Male |
Intercept (STDEV equivalents) |
2.97 |
2.43 |
Index of Multiple Deprivation |
0.004 |
0.002 |
√Population Density per Hectare |
0.000 |
0.002 |
% Age 65+ |
1.186 |
-0.086 |
% Age 0-4 |
2.719 |
-0.339 |
% White |
0.000 |
0.777 |
% Asian |
-0.279 |
0.691 |
% Black |
-0.460 |
0.986 |
Residual per MSOA |
0.581 |
0.555 |
A potential infectious agent
Roles for Cytomegalovirus (CMV): Having demonstrated a unique infectious basis for increased death it is useful to speculate regarding potential candidates. Based upon analysis of the range of medical conditions associated with both increased deaths and medical admissions during these outbreaks it has been suggested that the ubiquitous herpes virus, cytomegalovirus (CMV), may be involved either as the direct agent or an opportunistic indicator of another agent [19,22,34-39,46]. CMV has the largest genome of any herpes virus and thus has a powerful array of immune evasive and modulatory strategies. CMV can sequentially infect the same individual with multiple strains, and it has been suggested that the introduction of a new strain is a potential cause of these outbreaks [19,22,46]. However, at present it is still unknown if CMV is the actual agent, or if CMV is merely opportunistically reactivating in the presence of another agent.
The possibility of an effect based on immune manipulation is supported by the observation that both deaths and medical admissions during the 2008 and 2012 outbreaks show single-year-of-age patterns consistent with antigenic original sin [27-29,40], an immune based phenomenon first observed for different strains of influenza [41]. However, the effect of different strains aside, the high level of granularity in both initiation and percentage increase demonstrated in these events is entirely consistent with the known behavior of infectious outbreaks [86-91].
CMV and gender differences: Roles for gender in infectious disease pathogenesis is widely recognized [92]. There are gender differences in the immune response to CMV with curious differences in the proportion who are IgM and IgG positive [93]. IgM (produced early in a new infection) is seemingly more prevalent in males, while IgM seropositive is seemingly very low in both genders above age 50 [93]. In another study CMV seropositive women aged under 50 had higher concentrations of serum cholesterol, while in men there was no difference [94]. Body mass index, inflammatory markers, cardiovascular risk factors and CMV (IgG) serology was observed to interact in a complex way with gender and age [95].
The change in the gender ratio toward more boys associated with these infectious events [31] likewise appears to be consistent with a 2-times higher risk of abnormal brain development in the female fetus [96].
The role of young children as a factor in the magnitude of female deaths is consistent with the known excretion of CMV by young children for long periods of time, and consequent transmission to child care givers (who are mostly women) [97-99]. The feverish granny syndrome has also been attributed to CMV to describe illness in grandparents following a recent visit by grandchildren [100].
CMV and the kinetics of spread: The major issue to be addressed is the unique kinetic characteristics of the outbreaks. Slow spread across the entire UK over a two-year period has been noted for both the 2012, 2007, 2002 and previous outbreaks [15,17,20,27-28,30], and this corresponds with the relatively difficult to transmit nature of CMV [97-99]. CMV super infection with multiple strains is widely recognized as leading to more averse clinical outcomes [19,22,36].
How does this reconcile with the apparently rapid spread at small-area level such that within the space of around one month deaths jump from a lower to higher state? Like all persistent infections CMV is in a state of continuous outbreak and in many instances, expresses itself in an acute influenza-like illness [19,22], and associated respiratory illness [34]. Shedding of the virus is common in both children and the elderly [101-104], and the lungs are a major site for CMV infection [34,105]. CMV is present in the air surrounding patients with CMV pneumonia, and to a lesser extent for patients with a ‘latent’ infection [106].
There are numerous studies demonstrating survival of CMV outside of the host for extended periods of time. In one study of saliva infected hands live (and infectious) virus was recovered from 25% of hands after 5 minutes and 20% of hands after 15 minutes [107]. The shape of the decay curve suggested that live virus could potentially be recovered after one hour. In aerosols using an artificial saliva equivalent at 25°C and 95% relative humidity around 1% live CMV were recovered after 5.5 minutes [108], while the shape of the decay curve suggested 0.1% recovery after 15 minutes. Lower temperatures enhance survival due to lower evaporation of the droplets [108]. In whole blood at room temperature or 4°C there is 10% recovery of live CMV after 48 hours and 10% at 4°C after 72 hours [109]. Infectious CMV is present in saliva maintained at room temperature or 37°C for up to 2 hours and survived in paper diapers for periods as long as 48 hours, with the quantity of virus in urine remaining relatively constant for at least 12 hours [110]. Cytomegalovirus can survive on dry inanimate surfaces (persistence varies from only a few hours up to 7 days) blanket for 2 hours [111], plexiglass for 4-8 hours [112]. Viable CMV strain AD169, mixed with filtered human saliva, was found on metal and wood for up to 1 hour; on glass and plastic for up to 3 hours; and on rubber, cloth, and crackers for up to 6 hours [112]. In a day care nursery, CMV was cultured from 92% of wet surfaces and 13% of dry surfaces. Highly absorbent materials were much more likely to be positive for CMV [113]. In a neonatal ward CMV was isolated from diapers as well as hands of patients [114]. These data show that CMV in saliva or other body fluids can survive in the air or on many surfaces for long periods of time and potentially pose a risk for transmission.
Spatial proximity is well recognized as a risk in viral transmission [115] and coughing, sneezing or shaking of bed linen all place infectious agents into air currents which facilitate transmission [116]. In patients with unrecognized CMV disease, respiratory symptoms occur in 28% visiting their GP and 39% for those who are hospitalized [117].
Studies have shown that on average an infected person transmits CMV to two susceptible people [104] and a combination of all the above is likely to explain the mini-epidemics of CMV illness described in a neighborhood [118], renal transplant unit [119], a laboratory [120], in burns units [121], a neonatal unit [122] and an elderly care ward [123]. The nature of the infectious spread observed in small-area studies indicate that such mini-epidemics may be acting as loci for the bursts of rapid epidemic-like local spread which then aggregate to give the trends observed in larger areas. Spread of the agent during the outbreak in North-East Essex may have centered around GP surgeries [27].
CMV and influenza immunity: Recent research has suggested that the agent behind these outbreaks interacts with influenza and/or influenza vaccination [42]. Given the powerful effects of CMV against both adaptive and innate immunity [19,22,46] an interaction with influenza is highly likely. CMV is well-known for its ability to interfere with influenza immunity in an age and gender specific manner [46,124]. Latent infection with CMV is associated with poor memory CD4 T-cell response to influenza A core proteins in the elderly [125], and decreases B cell response to influenza vaccination in both the young and old [126]. CMV infected individuals show impaired NK cell responses to pertussis and H1N1 influenza vaccine [127]. CMV as a causative agent would therefore appear to be likely given the above evidence.
CMV and mortality: The final evidence implicating CMV is the fact that this virus has a large effect against all-cause mortality and specific effects upon mortality for diagnoses known to increase during these events, see reviews [22,34,36], and these outbreaks are proposed to be part of the expression of the heightened mortality rate observed in these large population studies.
Alternative causes
It is always possible that the observed infectious-like events are due to alternative causes. The various options and their rebuttal are presented in Table 3. Given that there remain no other known natural phenomena capable of causing this behavior we are left to conclude that the likely source is indeed an infectious agent.
Table 3. Potential alternative causes for these unique events and their rebuttal
Potential Cause |
Rebuttal |
Chance variation |
While the magnitude of the events is subject to Poisson-based variation, the events are highly statistically significant (Table 1). However, random-walk chance events appear to play major role in transmission of the agent (Table 2). |
Weather or other metrological phenomena |
The same behavior occurs synchronously across the Western world, and is replicated in very small (and adjacent) areas within a single local authority area [46]. |
Extremes of temperature |
While a -22°C or a +10°C deviation away from 17°C both generate around a 14% increase in daily deaths [3], this would have to be maintained for a full 12-months to replicate the step-like events. |
Typical winter infectious outbreaks |
While the events initiate more commonly during late winter, initiation also occurs fairly frequently in mid-summer (Figure 3). |
Influenza |
While the outbreaks may have similarities with an influenza-like-illness (ILI), they do not mirror ILI activity [128]. Influenza does not produce the characteristic rectangular wave effects. However, recent research suggests that the agent causing these outbreaks may act to potentiate the effects of influenza [42]. |
Health care policy |
The events occur across all four countries in the UK, which have different policies, procedures, structure and management. Recent austerity and reduced funding for social care may have contributed to the magnitude of recent events, however, the events can be traced back to the 1950’s [30], and presumably earlier. |
An artefact of the running 12-month total methodology |
All events exceed the limits of Poisson-based chance, it is highly unlikely that a running total would produce a ‘rectangular wave’ repeated across multiple times, locations and countries. |
A non-biological cause |
A non-biological cause is unlikely to initiate the rectangular wave change in the gender ratio at birth [31], and the parallel increase in sickness absence and medical admissions which accompany these events. |
The running 12-month sum relies on a calculated difference between two 12-month periods each side of a step-increase. It assumes that no additional major modifying events have occurred in either time-period. Hence if events have occurred in the 12-months prior to the step-increase the magnitude of the step-change could be underestimated. Additional events after the step-increase, such as an influenza outbreak, could act to overestimate the step-increase [39,42]. A further limitation is that the method is retrospective and cannot be used for real time monitoring.
Other methods can be employed such as cumulative sum of difference to the mean (CUSUM) with something like the EuroMOMO methodology [12] being used to calculate the expected ‘mean’ for each month. More sophisticated statistical algorithm methods could also be employed [129]. For example, Health Protection Scotland uses a daily all-cause mortality monitoring system which uses sine and cosine terms to model seasonality using the summer as a baseline with additional Serfling models for summer and Generalised Additive Models (GAM) for the winter [130]. An analysis of daily mortality is presented in the paper of Wagner et al. [130] with data from October 2006 through to April 2009 which covers the period spanned by one of these events.
Even with these limitations, retrospective application of the method has been sufficient to demonstrate that a series of events have occurred which involve a large step-like increase in deaths which endure for around 12-months.
Future study
From an infectious/immune viewpoint it is of further interest to note that the step-increase in deaths seems to occur as a condition-specific time cascade commencing first with liver and hepatic diseases, heart failure about one month later, then sepsis, then pneumonia, etc [131].
Given that each larger national outbreak occurs over a two-year period and that seasonal influenza activity varies considerably from year to year there is opportunity to explore the suggested association between an outbreak of this agent and the magnitude of the deaths in the following winter [42]. Were CMV to be involved there is ample evidence to suggest that active infection with this virus would interfere with both influenza vaccination efficacy and clearance of influenza from the lungs [34].
In the absence of a knowledge of the link between the step-like increase in deaths and hospital medical admissions these events could be dismissed as a curious anomaly in the trend in deaths. The variable timing and severity of these events is likely to explain the variation in the average year-to-year volatility observed over a 17-year period for deaths in English LA’s [132]. Aside from the obvious implications to our understanding of a potential new disease entity there are wider implications to understanding the trends in mortality reported for different geographical units at different points in time, and especially for comparison between whole country mortality trends and mortality rates.
These infectious outbreaks do not contradict our knowledge of epidemiology, rather they demonstrate that new types of infectious outbreaks can occur via novel application of the rules of infectious epidemiology.
Sadly, UK government agencies continue to deny that these events even exist. Government policy seems to wish to blame the NHS for the effects of these outbreaks, rather than to seek to establish the real cause. Appropriate public health measures have not been implemented and wider research remains to be initiated. A somewhat alarming reflection on the power of policy-based evidence to reject reality in preference to policy-correct views of how health care supposedly ‘works’.
The comments and suggestions from the FGNAMB reviewers are acknowledged with gratitude. There are no sources of funding or conflicts of interest to declare.
Appendix
- UK Met Office. Winter 2010/11. http://www.metoffice.gov.uk/climate/uk/2011/winter.html
- BBC Bitesize. Weather and climate. http://www.bbc.co.uk/schools/gcsebitesize/geography/weather_climate/extreme_weather_rev2.shtml
- Ekamper P, van Poppel F, van Duin C, Garssen J (2009)150 Years of temperature-related excess mortality in the Netherlands. Demographic Research 21: 385-426.
- Office for National Statistics. Excess Winter Mortality in England and Wales, 2010/11 Provisional) and 2009/10 (Final) http://www.ons.gov.uk/ons/rel/subnational-health2/excess-winter-mortality-in-england-and-wales/2010-11--provisional--and-2009-10--final-/stb-ewm-2010-11.html
- Steingrimsdottir L, Gunnarsson O, Indridason O, Franzson L, Sigurdsson G (2005) Relationship between serum parathyroid hormone levels, vitamin D sufficiency, and calcium uptake. JAMA 204: 2336-41. [Crossref]
- Larose TL, Chen Y, Camargo CA Jr, Langhammer A, Romundstad P, et al. (2014) Factors associated with vitamin D deficiency in a Norwegian population: the HUNT Study. J Epidemiol Community Health 68: 165-170. [Crossref]
- Purdon G, Comrie F, Rutherford L, Marcinkiewicz A (2013) Vitamin D status of Scottish adults: Results from the 2010 & 2011 Scottish Health Surveys. Aberdeen: Food Standards Agency in Scotland. http://www.foodbase.org.uk//admintools/reportdocuments/845-1-1545_FSA_Vit_D_2011_report_final.pdf
- Sakem B, Nock C, Stanga Z, Medina P, Nydegger UE, et al. (2013) Serum concentrations of 25-hydroxyvitamin D and immunoglobulins in an older Swiss cohort: results of the Senior Labor Study. BMC Med 11: 176. [Crossref]
- Trudeau R (1997) Monthly and daily patterns of death. Health Reports 9: 43-50.
- Griffin MR, Coffey CS, Neuzil KM, Mitchel EF Jr, Wright PF, et al. (2002) Winter viruses: influenza- and respiratory syncytial virus-related morbidity in chronic lung disease. Arch Intern Med 162: 1229-1236. [Crossref]
- Fleming D, Norbury C, Crombie D (1991) Annual and seasonal variation in the incidence of common diseases. Occasional paper 53. London: The Royal College of General Practitioners.
- EuroMOMO. European monitoring of excess mortality for public health action. http://www.euromomo.eu/
- Jones RP (2010) Unexpected, periodic and permanent increase in medical inpatient care: man-made or new disease? Med Hypotheses 74: 978-983. [Crossref]
- Jones R (2010) Can time-related patterns in diagnosis for hospital admission help identify common root causes for disease expression. Med Hypotheses 75: 148-54. [Crossref]
- Jones R (2010) The case for recurring outbreaks of a new type of infectious disease across all parts of the United Kingdom. Med Hypotheses 75: 452-7. [Crossref]
- Jones R (2015) Recurring Outbreaks of an Infection Apparently Targeting Immune Function, and Consequent Unprecedented Growth in Medical Admission and Costs in the United Kingdom: A Review. Brit J Med Medical Res 6: 735-70.
- Jones R (2012) Diagnoses, deaths and infectious outbreaks. Brit J Healthcare Manage 18: 539-48.
- Jones R (2012) Excess deaths following a procedure in 2008. Brit J Healthcare Manage 18: 554-5.
- Jones R (2013) Could cytomegalovirus be causing widespread outbreaks of chronic poor health. In: Hypotheses in Clinical Medicine, Shoja M, et al. (Eds.), 37-79. New York: Nova Science Publishers Inc. Available from: http://www.hcaf.biz/2013/CMV_Read.pdf
- Jones R (2013) An unexplained increase in deaths during 2012. Brit J Healthcare Manage 19: 248-53.
- Jones R (2012) Increasing GP referrals: collective jump or infectious push? Brit J Healthcare Manage 18: 487-95.
- Jones R (2013) Recurring outbreaks of a subtle condition leading to hospitalization and death. Epidemiology: Open access 4: 137.
- Jones R (2013) A recurring series of infectious-like events leading to excess deaths, emergency department attendances and medical admissions in Scotland. Biomedicine International 4: 72-86.
- Jones R (2013) Analysing excess winter mortality: 2012/13. Brit J Healthcare Manage 19: 601-5.
- Jones R (2014) Untangling the A&E crisis. Brit J Healthcare Manage 20: 246-7.
- Jones R (2014) Trends in death and end-of-life costs in the UK. Brit J Healthcare Manage 20: 298-9.
- Jones R (2015) Infe2021 Copyright OAT. All rights reservg to increased medical hospital admission in the North-East Essex area of the East of England. Fractal Geometry and Nonlinear Analysis in Medicine and Biology 1: 98-111.
- Jones R (2014) Infectious-like spread of an agent leading to increased medical admissions and deaths in Wigan (England), during 2011 and 2012. Brit J Med Medical Res 4: 4723-41.
- Jones R, Beauchant S (2015) Small Area Spread of a New Type of Infectious Condition across Berkshire in England between June 2011 and March 2013: Effect on Medical Emergency Admissions. Brit J Med Medical Res 6: 126-48.
- Jones R (2015) A Previously uncharacterized infectious-like event leading to spatial spread of deaths across England and Wales: Characteristics of the most Recent Event and a Time Series for Past Events. Brit J Med Medical Res 5: 1361-80.
- Jones R (2013) Do recurring outbreaks of a type of infectious immune impairment trigger cyclic changes in the gender ratio at birth? Biomedicine International 4: 26-39.
- Jones R (2013) Trends in elderly diagnoses: links with multi-morbidity. Brit J Healthcare Manage 19: 553-8.
- Jones R (2014) Increased deaths in 2012: which conditions? Brit J Healthcare Manage 20: 45-7.
- Jones R (2014) A Study of an Unexplained and Large Increase in Respiratory Deaths in England and Wales: Is the Pattern of Diagnoses Consistent with the Potential Involvement of Cytomegalovirus? Brit J Med Medical Res 4: 5179-92.
- Jones R (2014) Trends in admission for allergy. Brit J Healthcare Manage 20: 350-1.
- Jones R (2015) Roles for cytomegalovirus in infection, inflammation and autoimmunity. In: Infection and Autoimmunity, (2ndedn), Chapter 18, 319-357. Rose N, et al. (Eds.) Amsterdam, Elsevier.
- Jones R, Goldeck D (2014) Unexpected and unexplained increase in death due to neurological disorders in 2012 in England and Wales: Is cytomegalovirus implicated? Med Hypotheses 83: 25-31. [Crossref]
- Jones R (2015) Unexpected Increase in Deaths from Alzheimer’s, Dementia and Other Neurological Disorders in England and Wales during 2012 and 2013. Journal of Neuroinfectious Diseases 6: 172.
- Jones R (2016) A presumed infectious event in England and Wales during 2014 and 2015 leading to higher deaths in those with neurological and other disorders. Journal of Neuroinfectious Diseases 7: 1000213.
- Jones R (2014) Unexpected single-year-of-age changes in the elderly mortality rate in 2012 in England and Wales. Brit J Med Medical Res 4: 3196-207.
- Francis T (1960) On the doctrine of original antigenic sin. Proc Amer Philosoph Soci 104: 572–8.
- Jones R (2016) Deaths and marginal changes in healthcare costs. Brit J Healthc Manage 22: 503-509.
- Dixon T, Shaw M, Frankel S, Ebrahim S (2004) Hospital admissions, age, and death: retrospective cohort study. BMJ 328: 1288. [Crossref]
- Rosenwax LK, McNamara BA, Murray K, McCabe RJ, Aoun SM, et al. (2011) Hospital and emergency department use in the last year of life: a baseline for future modifications to end-of-life care. Med J Aust 194: 570-573. [Crossref]
- Beeknoo N, Jones R (2016) The demography myth - how demographic forecasting underestimates hospital admissions, and creates the illusion that fewer hospital beds or community-based bed equivalents will be required in the future. Brit J Med Medical Res 19: 1-27.
- Jones R (2016) Is cytomegalovirus involved in recurring periods of higher than expected death and medical admissions, occurring as clustered outbreaks in the northern and southern hemispheres? Brit J Med Medical Res 11: 1-31.
- Dushoff J (1996) Incorporating immunological ideas in epidemiological models. J Theor Biol 180: 181-187. [Crossref]
- Grassly NC, Fraser C, Garnett GP (2005) Host immunity and synchronized epidemics of syphilis across the United States. Nature 433: 417-421. [Crossref]
- Anderson RM, Grenfell BT, May RM (1984) Oscillatory fluctuations in the incidence of infectious disease and the impact of vaccination: time series analysis. J Hyg (Lond) 93: 587-608. [Crossref]
- Woolhouse ME, Gowtage-Sequeria S (2005) Host range and emerging and reemerging pathogens. Emerg Infect Dis 11: 1842-1847. [Crossref]
- Bu XL, Wang X, Xiang Y, Shen LL, Wang QH, et al (2015) The association between infectious burden and Parkinson’s disease: A case-control study. Parkinsonsm Relat Disord 21: 877-881. [Crossref]
- Wright CB, Gardener H, Dong C, Yoshita M, DeCarli C, et al. (2015) Infectious Burden and Cognitive Decline in the Northern Manhattan Study. J Am Geriatr Soc 63: 1540-1545. [Crossref]
- Elkind MS, Ramakrishnan P, Moon YP, Boden-Albala B, Liu KM, et al. (2010) Infectious burden and risk of stroke: the northern Manhattan study. Arch Neurol 67: 33-38. [Crossref]
- Shapira Y, Agmon-Levin N, Renaudineau Y, Porat-Katz B, Barzilai O, et al (2012) Serum markers of infections in patients with primary biliary cirrhosis: evidence of infectious burden. Exp Molec Biol 93: 386-390. [Crossref]
- Simanek A, Dowd J, Zajacova A, Aiello A (2015) Unpacking the ‘black box’ of total pathogen burden: is number or type of pathogens most predictive of all-cause mortality in the United States? Epidemiol Infect 143: 2624-2634. [Crossref]
- Xu GJ, Kula T, Xu Q, Li MZ, Vernon SD, et al (2015) Viral immunology. Comprehensive serological profiling of human populations using a synthetic human virome. Science 348: aaa0698. [Crossref]
- Rubicz R, Leach C, Fraig E, Dhurandhar N, Grubbs B, et al (2011) Seroprevalence of 13 common pathogens in a rapidly growing U.S. minority population: Mexican Americans from San Antonio, TX. BMC Res Notes 4: 433. [Crossref]
- Jones R (2015) An unexpected increase in adult appendicitis in England (2000/01 to 2012/13): Could cytomegalovirus (CMV) be a risk factor? Brit J Med Medical Res 5: 579-603.
- Jones R (2016) A fatal flaw in mortality-based disease surveillance. Brit J Healthc Manage 22: 143-145.
- Jones R (2016) Deaths in English Lower Super Output Areas (LSOA) show patterns of very large shifts indicative of a novel recurring infectious event. SMU Medical Journal 3: 23-36.
- Jones R (2015) Small area spread and step-like changes in emergency medical admissions in response to an apparently new type of infectious event. Fractal Geometry and Nonlinear Analysis in Medicine and Biology 1: 42-54.
- Jones R (2015) Forecasting medical emergency admissions. Brit J Healthc Manage 21: 98-99.
- Jones R (2015) Estimating acute costs. Brit J Healthc Manage 21: 152-153.
- Jones R (2015f) Deaths and international health care expenditure. Brit J Healthc Manage 21: 491-493.
- Jones R (2015) Simulated rectangular wave infectious-like events replicate the diversity of time-profiles observed in real-world running 12-month totals of admissions or deaths. Fractal Geometry and Nonlinear Analysis in Medicine and Biology 1: 78-79.
- Jones R (2016) The unprecedented growth in medical admissions in the UK: the ageing population or a possible infectious/immune aetiology? Epidemiology: Open access 6: 1000261.
- Jones R (2015) Are emergency admissions contagious? Brit J Healthc Manage 21: 227-235.
- Fleming D, Elliot A, Nguyen-Van-Tam J, Watson J, Wise R (2005) A winter’s tale: Coming to terms with winter respiratory illnesses. London: Health Protection Agency. http://www.hpa.org.uk/webc/HPAwebFile/HPAweb_C/1196942154040
- Dowell SF1 (2001) Seasonal variation in host susceptibility and cycles of certain infectious diseases. Emerg Infect Dis 7: 369-374. [Crossref]
- Nelson R, Demas G, Klein S, Kriegsfeld L (2002) Seasonal patterns of stress, immune function, and disease. New York: Cambridge University Press.
- Altizer S, Dobson A, Hosseini P, Hudson P, Pascual M, et al. (2006) Seasonality and the dynamics of infectious diseases. Ecol Lett 9: 467-484. [Crossref]
- Pascual M1, Dobson A (2005) Seasonal patterns of infectious diseases. PLoS Med 2: e5. [Crossref]
- Upshur R, Moineddin R, Crighton E, Kiefer L, Mamdani M (2005) Simplicity within complexity: Seasonality and predictability of hospital admissions in the province of Ontario 1988-2001, a population-based analysis. BMC Health Serv Res 5: 13. [Crossref]
- Grassly NC, Fraser C (2006) Seasonal infectious disease epidemiology. Proc Biol Sci 273: 2541-2550. [Crossref]
- Whitfield GK, Remus LS, Jurutka PW, Zitzer H, Oza AK, et al. (2001) Functionally relevant polymorphisms in the human nuclear vitamin D receptor gene. Mol Cell Endocrinol 177: 145-159. [Crossref]
- González EA, Sachdeva A, Oliver DA, Martin KJ (2004) Vitamin D insufficiency and deficiency in chronic kidney disease. A single center observational study. Am J Nephrol 24: 503-510. [Crossref]
- Wang TT, Nestel FP, Bourdeau V, Nagai Y, Wang Q, et al. (2004) Cutting edge: 1,25-dihydroxyvitamin D3 is a direct inducer of antimicrobial peptide gene expression. J Immunol 173: 2909-2912. [Crossref]
- Leow L, Simpson T, Cursons R, Karalus N, Hancox RJ (2011) Vitamin D, innate immunity and outcomes in community acquired pneumonia. Respirology 16: 611-616. [Crossref]
- Pilz S, Dobnig H, Tomaschitz A, Kienreich K, Meinitzer A, et al. (2012) Low 25-hydroxyvitamin D is associated with increased mortality in female nursing home residents. J Clin Endocrinol Metab 97: E653-657. [Crossref]
- Anglin RE, Samaan Z, Walter SD, McDonald SD (2013) Vitamin D deficiency and depression in adults: systematic review and meta-analysis. Br J Psychiatry 202: 100-107. [Crossref]
- Handel AE, Sandve GK, Disanto G, Berlanga-Taylor AJ, Gallone G, et al. (2013) Vitamin D receptor ChIP-seq in primary CD4+ cells: relationship to serum 25-hydroxyvitamin D levels and autoimmune disease. BMC Med 11: 163. [Crossref]
- Lange N, Litonjua A, Gibbons F, Glovannucci E, Christopher K (2013) Pre-hospital vitamin D concentration, mortality, and bloodstream infection in a hospitalized patient population. Am J Med 126: e19-27. [Crossref]
- Quraishi SA, Bittner EA, Christopher KB, Camargo CA Jr. (2013) Vitamin D status and community-acquired pneumonia: Results from the third National Health and Nutrition Examination Survey. PLoS One 8: e81120. [Crossref]
- Ramagopalan S, Goldacre R, Disanto G, Giovannoni G, Goldacre M (2013) Hospital admissions for vitamin D related conditions and subsequent immune-mediated diseases: record linkage studies. BMC Med 11: 171. [Crossref]
- Jarrett F, Ducasa G, Buller D, Berwick M (2014) The Effect of Oral Supplementation of Vitamin D3 on Serum Levels of Vitamin D: A Review. Epidemiology: Open access 4:148.
- Salathe M, Kazandjieva M, Lee J, Levis P, Feldman M, et al. (2010) A high-resolution human contact network for infectious disease transmission. Proc Natl Acad Sci USA 107: 22020–5. [Crossref]
- Viboud C, Bjørnstad ON, Smith DL, Simonsen L, Miller MA, et al. (2006) Synchrony, waves, and spatial hierarchies in the spread of influenza. Science 312: 447-451. [Crossref]
- Jones R (2013) Population density and healthcare costs. Brit J Healthcare Manage 19: 44-5.
- Leventhal GE, Hill AL, Nowak MA, Bonhoeffer S (2015) Evolution and emergence of infectious diseases in theoretical and real-world networks. Nat Commun 6: 6101. [Crossref]
- Bagrow J, Brockmann D (2013) Natural emergence of clusters and bursts in network evolution. Physical Review X 3: 021016.
- Brockmann D, Helbing D (2013) The hidden geometry of complex, network-driven contagion phenomena. Science 342: 1337-1342. [Crossref]
- vom Steeg LG, Klein SL (2016) SeXX Matters in Infectious Disease Pathogenesis. PLoS Pathog 12: e1005374. [Crossref]
- Bakri M, Agag A, Alnemri A, Hobani Y, Najmi A, et al (2016) Serostatus of cytomegalovirus among population, Jazan region, Saudi Arabia. Sky J Microbiol Res 4: 52-59.
- Froberg M, Seacotte N, Dahlberg E (2001) Cytomegalovirus seropositivity and serum total cholesterol levels in young patients. Ann Clin Lab Sci 31: 157-161. [Crossref]
- Terrazzini N, Bajwa M, Thomas D, Smith H, Kern F (2014) Gender differences and age-specific associations between body mass index and other cardiovascular risk factors in CMV infected and uninfected people. Immunol Letters 162: 316-322. [Crossref]
- Picone O, Costa J-M, dejean A, Ville Y (2005) Is fetal gender a risk factor for severe congenital cytomegalovirus infection? Prenat Diagn 25: 34-38. [Crossref]
- Cannon MJ, Schmid DS, Hyde TB (2010) Review of cytomegalovirus seroprevalence and demographic characteristics associated with infection. Rev Med Virol 20: 202-13. [Crossref]
- Bate SL, Dollard SC, Cannon MJ (2010) Cytomegalovirus seroprevalence in the United States: The National Health and Nutrition Examination Surveys, 1988-2004. Clin Infect Dis 50: 1439-47. [Crossref]
- Cannon MJ, Hyde TB, Schmid DS (2011) Review of cytomegalovirus shedding in bodily fluids and relevance to congenital cytomegalovirus infection. Rev Med Virol 21: 240-255. [Crossref]
- Wreghitt T, Behr S, Hodson J, Irwin D (1995) Feverish granny syndrome. Lancet 346: 1716. [Crossref]
- Stowe RP, Kozlova EV, Yetman DL, Walling DM, Goodwin JS, et al. (2007) Chronic herpesvirus reactivation occurs in aging. Exp Gerontol 42: 563-570. [Crossref]
- Bennett JM, Glaser R, Malarkey WB, Beversdorf DQ, Peng J, et al. (2012) Inflammation and reactivation of latent herpesviruses in older adults. Brain Behav Immun 26: 739-746. [Crossref]
- Gautheret-Dejean A1, Aubin JT, Poirel L, Huraux JM, Nicolas JC, et al. (1997) Detection of human Betaherpesvirinae in saliva and urine from immunocompromised and immunocompetent subjects. J Clin Microbiol 35: 1600-1603. [Crossref]
- Colugnati FA, Staras SA, Dollard SC, Cannon MJ (2007) Incidence of cytomegalovirus infection among the general population and pregnant women in the United States. BMC Infect Dis 7: 71. [Crossref]
- Balthesen M, Messerle M, Reddehase MJ (1993) Lungs are a major organ site of cytomegalovirus latency and recurrence. J Virol 67: 5360-5366. [Crossref]
- McCluskey R, Sanden R, Greene J (1996) Detection of airborne cytomegalovirus in hospital rooms of immunocompromised patients. J Virol Methods 56: 115-8. [Crossref]
- Stowell J, Forlin-Passoni D, Radford K, Bate S, Dollard S, et al. (2014) Cytomegalovirus survival and transferability and the effectiveness of common hand-washing agents against cytomegalovirus on live human hands. Appl Environ Microbiol 80: 455-61. [Crossref]
- Theunissen HJ, Lemmens-den Toom NA, Burggraaf A, Stolz E, Michel MF (1993) Influence of temperature and relative humidity on the survival of Chlamydia pneumoniae in aerosols. Appl Environ Microbiol 59: 2589-2593. [Crossref]
- Roberts T, Buller R, Gaudreault-Keener M, Sternhell K, Garlock K, et al. (1970) Effects of storage temperature and time on qualitative and quantitative detection of cytomegalovirus in blood specimens by shell vial culture and PCR. J Clin Microbiol 35: 2224-8. [Crossref]
- Schupfer PC, Murph JR, Bale JF Jr (1986) Survival of cytomegalovirus in paper diapers and saliva. Pediatr Infect Dis 5: 677-679. [Crossref]
- Kramer A, Schwebke I, Kampf G (2006) How long do nosocomial pathogens persist on inanimate surfaces? A systematic review. BMC Infect Dis 6: 130. [Crossref]
- Faix RG (1985) Survival of cytomegalovirus on environmental surfaces. J Pediatr 106: 649-652. [Crossref]
- Stowell J, Forlin-Passoni D, Din E, Radford K, Brown D, et al. (2012) Cytomegalovirus survival on common environmental surfaces: opportunities for viral transmission. J Infect Dis 205: 211-5. [Crossref]
- Demmler GJ, Yow MD, Spector SA, Reis SG, Brady MT, et al. (1987) Nosocomial cytomegalovirus infections within two hospitals caring for infants and children. J Infect Dis 156: 9-16. [Crossref]
- Harris JP, Lopman BA, Cooper BS, O’Brien SJ (2013) Does spatial proximity drive norovirus transmission during outbreaks in hospitals? BMJ Open 3: e003060. [Crossref]
- King M, Noakes C, Sleigh P, Camargo-Valero M (2012) Bioaerosol deposition in single and two-bed hospital rooms: A numerical and experimental study. Build Environ 59: 436-47.
- Wreghitt TG, Teare EL, Sule O, Devi R, Rice P (2003) Cytomegalovirus infection in immunocompetent patients. Clin Infect Dis 37: 1603-1606. [Crossref]
- Meunier YA (2005) Infectious mononucleosis-like syndrome and gastrointestinal disorders in acute acquired cytomegalovirus infection. Singapore Med J 46: 421-3. [Crossref]
- Coulson AS, Lucas ZJ, Condy M, Cohn R (1974) Forty-day fever. An epidemic of cytomegalovirus disease in a renal transplant population. West J Med 120: 1-7. [Crossref]
- Davies JG, Taylor CM, White RH, George RH, Purdham DR (1979) Cytomegalovirus infection associated with lower urinary tract symptoms. BMJ 1: 1120. [Crossref]
- Rennekampff HO, Hamprecht K (2006) Cytomegalovirus infections in burns units: a review. J Med Microbiol 55: 483-7.
- Gurevich I, Cunha BA (1981) Non-parenteral transmission of cytomegalovirus in a neonatal intensive care unit. Lancet 2: 222-224. [Crossref]
- Shats VJ, Kozacov SM, Miron D (1998) Outbreak of cytomegalovirus infection in the geriatric department. J Am Geriatr Soc 46: 930-931. [Crossref]
- Frasca D, Blomberg BB (2016) Aging, cytomegalovirus (CMV) and influenza vaccine responses. Hum Vaccin Immunother 12: 682-690. [Crossref]
- Derhovanessian E, Maier AB, Hähnel K, McElhaney JE, Slagboom EP, et al. (2014) Latent infection with cytomegalovirus is associated with poor memory CD4 responses to influenza A core proteins in the elderly. J Immunol 193: 3624-3631. [Crossref]
- Frasca D, Diaz A, Romero M, Landin AM, Blomberg BB (2015) Cytomegalovirus (CMV) seropositivity decreases B cell responses to the influenza vaccine. Vaccine 33: 1433-1439. [Crossref]
- Nielsen CM, White MJ, Bottomley C, Lusa C, Rodriguez-Galan A, et al. (2015) Impaired NK cell responses to pertussis and H1N1 influenza vaccine antigens in human cytomegalovirus-infected individuals. J Immunol 194: 4657-4667. [Crossref]
- Jones R (2015) Influenza-like-illness, deaths and health care costs. Brit J Healthc Manage 21: 587-589.
- Farrington C, Andrews N, Beale A, Catchpole M (1996) A statistical algorithm for the early detection of outbreaks of infectious disease. J R Statist Soc A 159: 547-63.
- Wagner AP, McKenzie E, Robertson C, McMenamin J, Reynolds A, et al. (2013) Automated mortality monitoring in Scotland from 2009. Euro Surveill 18: 20451. [Crossref]
- Jones R (2015) Unexpected and disruptive changes in admissions associated with an infectious-like event experienced at a hospital in Berkshire, England around May of 2012. Brit J Med Medical Res 6: 56-76.
- Jones R (2012) End of life care and volatility in costs. British Journal of Healthcare Management 18: 374-81.