This paper proposes a model for characterizing the hydrostatic pressure and the shear stresses in the sub-layers of the human skin. The skin is considered as a stratified medium with four layers made of homogeneous linear viscoelastic isotropic materials. The 3-Dim finite element numerical simulations are conducted with the SYSTUS® software to model an air puff applied onto the outer surface of the skin of a young adult and an elderly subject with two different dwell times: 0.5s and 100s. The detailed analysis of the numerical results pointed out that the mechanical information contained in the stress fields can give clues on the individual responses of the different skin layers in relation with the physiology of the skin. Based on these findings, it can be guessed the possible occurrence of pressure ulcers and in which layer they will initiate. This approach is proposed as an initial contribution. It is thought that this model could provide fundamental knowledge about the etiology of pressure ulcers. This knowledge can be usefull in the design of effective clinical identification and prevention.
in vivo human skin, contact-free creep tests, 3-Dim numerical simulation, viscoelastic mechanical parameters, shear stress field, hydrostatic pressure
Skin injuries such as pressure ulcers and related trauma may affect vulnerable patients of all ages [1-3]. It is now agreed that mechanical compressive and/or shear loadings acting either on the outer or inner skin surfaces may be ones of the primary disposing factors [4-6]. They can lead to direct mechanical damage to cells [7,8]. In this case, “Pressure Ulcer Prevention” protocols (PUPP) will notice it and start the curing treatment [3]. Evidences exist that they can initiate indirect insults due to deformation-induced vascular occlusion leading to cells’ death [9]. These cases are more difficult to handle because it may escape from being noticed during PUPP till it would have propagated all the way to the skin outer surface. Moreover, it has been observed that reperfusion damage could occur as blood flux restarts through the previously ischemic tissues causing inflammatory responses leading to cell apoptosis and necrosis [10]. Change in temperature can also increase the risk for pressure ulcers [11].
Researches are conducted to understand the physical phenomena involved in the skin soft tissues breakdown and to seek preventive techniques [6,11-16]. Numerical simulations using the finite element methods allow to evaluate internal tissue efforts associated with external loads. They permit to discriminate the influence of pressure and shear stress and their influence on biomechanical risk factors i.e. impaired circulation.
This paper proposes to characterize the hydrostatic pressure fields and the shear stress fields in four individual in vivo skin layers namely the stratum corneum, the viable epidermis, the dermis and the hypodermis.
The 3-Dim finite element numerical simulations are carried out with the SYSTUS® software. They simulate numerical contact-free creep test with two dwell times (0.5 s and 100 s) i.e. they simulate the application of an air puff onto the outer surface of the skin of the forearm of two adult volunteers.
The skin is modeled as a stratified volume with four layers made of linear isotropic viscoelastic materials.
This work will try to address the following questions: is it possible to win information on the stress fields in each layer of the skin soft tissues and to establish a causal relationship between loading, stress fields and the occurrence of pressure ulcers? In which layer initiate these breakdowns? Are they due to a concentration of stress in a sub-layer or to the state of the physiology of the sub-layer?
In the following, the finite element model is described first. Then the numerical results are presented with the discussion. The conclusion will end this paper.
To simulate the response of the skin to air puffs applied with varying dwell-times, a 3-Dim finite element model is developed under the SYSTUS® software.
Physiology, REV and mesh
Previous research has established that the human skin is a stratified medium composed of non-homogeneous, anisotropic, non-linear viscoelastic materials subject to pre-stress in vivo [17-19]. It is organized in four main layers which are, from the skin outer surface inwards: the stratum corneum (SC), the viable epidermis (VE), the dermis (DE) and the hypodermis (HY) [20].
The Representative Elementary Volume (REV) used in this work is a stratified volume composed of four layers: SC, VE, DE and HY and designed to represent the structural architecture spread throughout each layer.
In the SC, the architecture is provided by the lipid bridges (the corneodesmosomes) and the corneocyte keratin network which form the scaffold for the extracellular lipid matrix [21]. In the VE, the mobile keratinocytes require strong bridges (desmosomes) to keep them together in a safe environment favorable for the cells to grow bathed in physiological fluid and fill the tissue volume. This mechanical structure is initiated in the DE. There, dense networks of collagen and elastin fibers combine their 3-Dim space distributions [19] with the adhesive properties of the adsorbed ground substance [22,23] to provide a safe skin volume and maintain its cohesion [22,24]. Finally, HY is the deepest vascularized layer of the skin situated between the dermis and the underlying muscles. It consists of a framework of fibrous walls (collagen fibers) embedding adipocytes and stromal-vascular cells integrated through nerve and vascular networks. These fibrous walls contribute to the overall architecture of the soft cutaneous tissues. Tightly linked to the overlying cutaneous layers, HY allows them to move cohesively, both horizontally and vertically.
The term of “structural architecture” should be understood in a civil engineering sense. It represents the mechanical resistive frame that gives skin its volume and geometry. It can be seen as a set of beams (fibers) and springs (lipid bridges). It provides the elastic mechanical contribution to the overall behavior of the skin’s soft tissues. In addition, this frame bears the mechanical loads applied and mechanically transfers these loads to the hypodermis.
In parallel, the physiological fluids saturating each layer provide the viscoelastic contribution to the behavior of the skin and the means of dissipating part of the mechanical energy supplied.
Finally, the very singular physiology of the hypodermis gives it the appearance of an interior-spring mattress able to attenuate and disperse the remaining part of the loads. In her analysis, [25] suggested that adipose tissues behave like a thixotropic material. However, it can still be modeled with a good approximation as a viscoelastic material.
Moreover, each layer is in turn composed of a number of sub-layers discriminated by their physiology. This means that the structural architecture components are not spread homogeneously in the layers [26]. Since SC is subjected to the desquamation of its dead corneocytes, different densities of corneodesmosomes exist between the top 2/3 of the first sub-layers and the remaining 1/3 beneath. Similarly, the VE is where new cells appear and desmosomes are built. This process of constant renewal causes both entities to have different densities. For the DE, age dependent evolutions affect the densities of elastin and collagen [26-28] as well as the density of the ground substance and therefore of the adsorbed part of the latter [29-17] in the different sub-layers.
The couplings between the contributions detailed in this section allow the skin’s soft tissues to support quite heavy mechanical loads daily relative to its total thickness and to the stiffnesses of its individual sublayers.
The dimensions of the REV fulfilling Saint-Venant’s Principle and incorporating these main characteristics are: 30 mm x 30 mm x 11.11 mm. The height of the REV equal to 11.11 mm is based on measurements reported in [30].
Taking into account the symmetries, only ¼ of the REV is meshed (Figure 1) i.e. the mesh dimensions are 15 mm x 15 mm x 11.11 mm with SC (0.01 mm) in blue, VE (0.1 mm) in green, DE (1.0 mm) in yellow and HY (10.0 mm) in red. Convergence and precision have been assessed and optimized with a refined mesh in and close to the loading zone. The mesh is made of prisms for SC, VE and DE and of tetrahedrons for HY. It consists of 25181 elements and 9689 nodes.
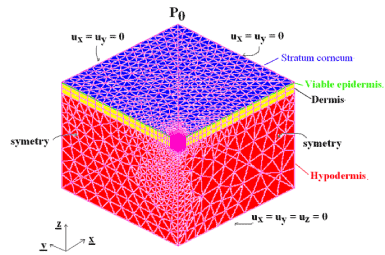
Figure 1. 3-Dim mesh with the stratum corneum in blue, the viable epidermis in green, the dermis in yellow and the hypodermis in red and boundary conditions.
Boundary conditions
Physically admissible boundary conditions set on additional parts of the boundary  of the REV are needed of the form:

where  and
and  , is the outer unit normal to
  are the prescribed efforts on the boundary
  is the displacement vector of the skin in vivo in meter and
  are the prescribed displacements on the boundary
  in meter.
Top boundary: Numerical contact-free creep load
During the experimental contact-free creep tests presented in [30] and [31], photographs of the responses of the skin were taken as exemplified by Figure 2. The key point of that work is the way the load was applied. It consists of a contact-free indenter applying an air puff onto the outer upper surface of the forearm of two volunteers: one young adult and one elderly subject. With contact-free, it is meant that the device has no contact with the skin before, during and after the test. This implies that the natural state of the skin in vivo can only be influenced by the air puff during loading with a response looking like the one displayed on the photograph (Figure 2) and nothing else.
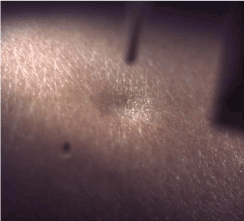
Figure 2. Photo of the pressured area of the skin surface under the air flow [30]
The idea here is to design a load to model this air puff. The proposal is to work with a Gaussian distribution applied at the center of the REV (i.e. one corner of the mesh). This boundary condition defines the equivalent numerical load (Figure 3) with:
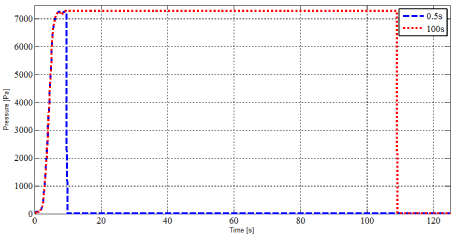
Figure 3. Numerical loadings for the young and the elderly subjects.
- a loading branch of 9.1 s during which a controlled pressure from 0 to 7277.14Pa is applied;
- dwell times of 0.5 s and 100 s, respectively for the two numerical tests studied in this work;
- the load equivalent to an air puff is stopped and the free-return of the skin soft tissues is monitored for 3600 s for each test.
Bottom and lateral boundaries
The other prescribed boundary conditions model: an un-deformable bottom surface with a zero displacement vector for all the nodes and tied vertical surfaces with zero horizontal components in both directions for the displacement vector for all the nodes.
Material relations
It is supposed in the following that an isotropic model is able to represent the responses of the skin subjected to external mechanical loads. Furthermore, the viscoelastic behavior of the skin is supposed to follow a Zener model (Figure 4). The Zener rheological model displays an elastic branch in parallel with a viscoelastic Maxwell’s branch. The elastic branch stems for the responses of the collagen and elastin fibers of DE and the other entities initiating the structural architecture of the skin in all layers while the viscoelastic Maxwell’s branch models the physiological fluids saturating each layer. In a large strain formulation, the Zener’s stress-strain relations should be derived in terms of the eulerian strain rate tensor d and the (objective) Green-Naghdi stress rate  . The latter is defined by:

Figure 4. Rheological Zener model

where σ is the Cauchy stress tensor and R is the rotation tensor coming from the polar decomposition of the deformation gradient. Moreover the Cauchy stress tensor is supposed to be the sum of an elastic part  and a viscoelastic Maxwell’s part
  . In other words it reads:
  .
.
In the elastic branch, the rate form of the generalized Hooke’s law (Equation 3) reads:

where v is the Poisson’s ratio, δ is the Kronecker delta and  is the long term modulus in Pa defined by:

where  is the Young modulus of layer i, i standing for layers SC, VE, DE and HY, respectively.
In the viscoelastic Maxwell’s branch, the Maxwell part of the Cauchy stress tensor satisfies  which means that the stresses are equal in the spring and in the dashpot. On the contrary the eulerian strain rate can be decomposed into
  the strain rate of the spring and
  the strain rate of the dashpot. These definitions should be complemented with stress-strain rate relations written for the spring and for the dashpot, respectively and under the hypothesis that for an isotropic material it is possible to separate the volumetric and deviatoric responses of the skin in vivo. Toward this end, the Maxwell part
  of the Cauchy stress tensor and the eulerian strain rate tensor d are decomposed into a spheric and a deviatoric part:

where  are respectively the deviatoric part of the stress tensor and the mean stress in the Maxwell’s branch, d1 is the deviatoric part of the eulerian strain rate tensor and dm, the volumetric part.
Substituting relations (5) and (6) into the definition of the strain rate tensor leads to relations (7) and (8) which express the volumetric and deviatoric responses of the human skin in vivo, respectively.
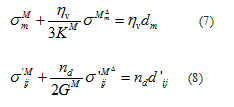
where  is the volumetric viscosity in Pa.s,
  is the compressibility modulus in Pa,
  is the deviatoric viscosity in Pa.s,
  is the shear modulus in Pa and E1 is the modulus in the Maxwell’s branch in Pa.
The viscoelastic parameters appearing in relations (3), (7) and (8) were tuned applying an inverse procedure for the young adult and the elderly subject on the experimental data reported in [31]. The values used in this study are recalled in table 1.
Table 1. Viscoelastic parameters used in this work for the young subject and for the elderly subject
Parameters |
Young subject |
Elderly subject |
Esc (MPa) |
14 |
5 |
EVE (MPa) |
0.06 |
0.03 |
EDE (MPa) |
0.038 |
0.014 |
EHV (MPa) |
0.002 |
0.002 |
 (MPa) (MPa)
|
1.841E-3 |
1.653E-3 |
E1 (MPa) |
2.900E-3 |
1.7400E-3 |
E0 = E1 +  (MPa) (MPa) |
4.741E-3 |
3.393E-3 |
GV (MPa) |
0.001 |
0.0006 |
ηd (MPa.s) |
0.0003 |
0.02 |
Boundary value problem and numerical resolution
Neglecting inertia forces, the momentum balance relation reads

Following [33], the finite element elaboration of the field equation (9) and the stress-rate of strain relations (3), (7) and (8) leads to the following system of ordinary first order differential equations needing to be solved in terms of a the array containing the nodal degrees-of-freedom of the displacement vector in m.s-1.

where  are the linear and nonlinear stiffness matrices. In a large displacement analysis, the non-linear effects due to the time discretization performed in an iterative Newton-Raphson sense are dealt with using a Taylor series expansion. The latter incorporates in the system geometrical non-linear effects which are gathered in the nonlinear stiffness matrix
  are the external and internal force vectors, respectively.
The system (10) with the boundary conditions (1) is solved one time with the mechanical parameters of the young adult and one time with the ones of the elderly subject.
Numerically speaking, the numerical resolution for one subject needs the following steps:
- At time t, it is supposed that the Cauchy stress tensor and the strain tensor are known;
- At time t + Δt, the system (10) with the boundary conditions (1) and the mechanical parameters (Table 1) is solved. It gives the displacement vector in the entire REV and the associated strain tensor.
- At time t + Δt, the Cauchy stress tensor and the strain tensor associated with the dashpot in the Maxwell branch of the rheological Zener model are deduced from the numerized form of the material relations (2), (7) and (8).
- Now remains to calculate the hydrostatic pressure
 that will be analyzed here under.
In Figure 5 the numerical hydrostatic pressure is plotted as a function of the numerical deflection for seven nodes of the central vertical under the air puff for the young and the elderly subjects for the dwell time of 0.5 s (Figure 5a) and 100 s (Figure5b). These nodes belong to the central vertical under the air flux: in SC (top node 6966 and middle node 5832), boundary SC-VE (node 4688), boundary VE-DE (node 4116), middle of DE (node 3515), boundary DE-HY (node 2920) and middle of HY (node 4251). It should be remembered that the physical phenomena analyzed are shared by all the points belonging to the same sub-layer of the layer.
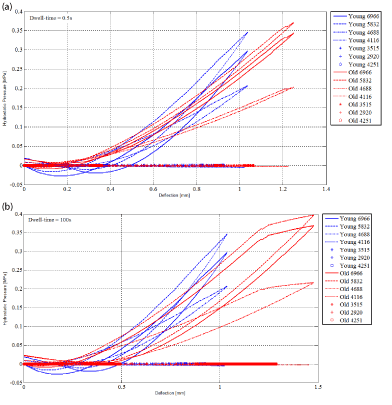
Figure 5. Numerical hydrostatic pressure as a function of the numerical deflection for nodes 6966, 5832, 4688, 4116, 3515, 2920 and 4251 of the central vertical under the air flux for the young and the elderly subjects. (a) Dwell-time=0.5s (b) Dwell-time=100s.
Figure 6 displays the numerical shear component of the Cauchy stress tensor as a function of the numerical deflection for the seven nodes of the central vertical under the air puff for the young adult and the elderly subject for the dwell time of 0.5 s (Figure 6a) and 100 s (Figure 6b).
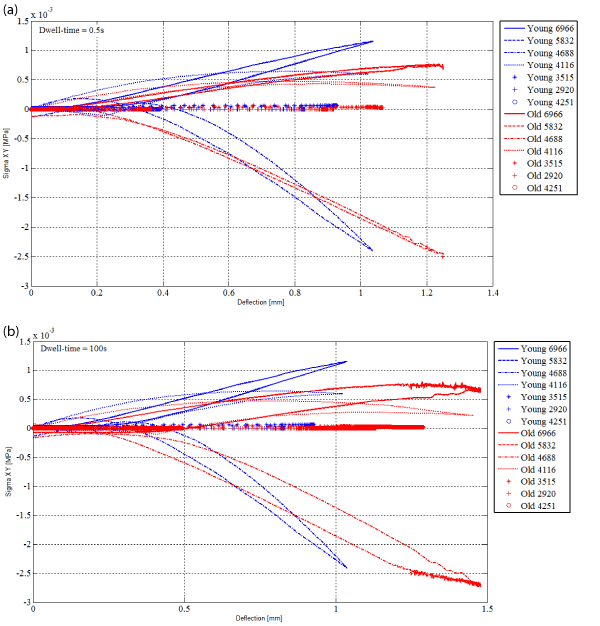
Figure 6. Numerical shear component Σxy of the Cauchy stress tensor as a function of the numerical deflection for nodes 6966, 5832, 4688, 4116, 3515, 2920 and 4251 of the central vertical under the air flux for the young and the elderly subjects. (a) Dwell-time=0.5s (b) Dwell-time=100s.
The hysteresis cycles (Figure 5 and Figure 6) give information on the amount of mechanical energy exchanged during the tests. In other words, the applied load provides an amount of mechanical energy to the material during the loading and the dwell time. The material receives it. When the load is stopped, the material gives back this amount of mechanical energy. This can be done directly under a mechanical form or it can be dissipated (usually an increase of the temperature can be measured in this latter case). In tables 2 and 3, the surfaces of the hysteresis cycles are calculated based on the numerical results available. It can be remarked that the larger surfaces are obtained for SC and the two boundaries SC-VE and VE-DE. These places are involved in the greater part of the exchanges of energy. It is expected that they will be the places where mechanical and physiological phenomena will develop.
Table 2. Surface of the hysteresis cycles of the numerical hydrostatic pressure for the nodes 6966, 5832, 4688, 4116, 3515, 2920 and 4251 of the central vertical under the air flux for the young and the elderly subjects
|
Surface of the hysteresis cycles in mm² |
Nodes |
Dwell-time =0.5s |
Dwell-time =100s |
Young |
Old |
Young |
Old |
6966 (top of SC) |
9.71E+00 |
7.20E+00 |
4.24E+01 |
3.69E+02 |
5832 (middle of SC) |
1.20E+01 |
8.33E+00 |
5.01E+01 |
3.98E+02 |
4688 (boundary SC-VE) |
7.62E+00 |
4.96E+00 |
3.04E+01 |
2.18E+02 |
4116 (boundary VE-DE) |
2.53E-01 |
1.45E-01 |
8.37E-01 |
3.12E+00 |
3515 (middle of DE) |
8.67E-04 |
3.87E-02 |
3.77E-02 |
3.99E-01 |
2920 (boundary DE-HY) |
1.30 E-02 |
1.20E-02 |
5.05E-02 |
1.16E-01 |
4251 (middle of HY) |
5.39 E-03 |
5.69E-03 |
1.82E-02 |
1.59E-01 |
Table 3. Surface of the hysteresis cycles of the numerical shear component of the Cauchy stress tensor for the nodes 6966, 5832, 4688, 4116, 3515, 2920 and 4251 of the central vertical under the air flux for the young and the elderly subjects.
|
Surface of the hysteresis cycles in mm² |
Nodes |
Dwell-time =0.5s |
Dwell-time =100s |
Young |
Old |
Young |
Old |
6966 (topof SC) |
4.44E-02 |
2.99E-02 |
1.72E-01 |
7.37E-01 |
5832 (middle of SC) |
4.44E-02 |
3.00E-02 |
1.71E-01 |
7.25E-01 |
4688 (boundary SC-VE) |
8.15E-02 |
4.64E-02 |
3.46E-01 |
2.67E+00 |
4116 (boundary VE-DE) |
3.37E-02 |
2.19E-02 |
9.92E-02 |
2.76E-01 |
3515 (middle of DE) |
3.50E-03 |
1.98E-03 |
1.02E-02 |
2.32E-02 |
2920 (boundary DE-HY) |
5.59E-05 |
1.32E-04 |
1.39E-04 |
1.55E-03 |
4251 (middle of HY) |
5.29E-06 |
2.27E-05 |
7.18E-05 |
5.68E-04 |
The discussion on the hydrostatic pressure is proposed in a civil engineering sense. The hydrostatic pressure is a local variable defined after the components of the Cauchy stress tensor. It is a local variable. It is defined at the material point level and more precisely on an infinitesimal unit cube centered on a current material point. The dimensions of the REV have taken into account the nominal dimensions of the skin soft tissues and of their different entities. Let us assumed that an infinitesimal unit cube centered on a current material point can be: a cell’s volume or a fiber’s volume or an infinitesimal volume of adsorbed ground substance or an infinitesimal volume of blood vessels belonging to the micro-circulation or any infinitesimal volume modelling one of the entities present in the skin’s REV. If we agree on this assumption, the infinitesimal unit cube centered on a current material point with the faces parallel to the coordinate planes can be represented as proposed in Figure 7a. During dayly life, the skin can be subjected to external mechanical loads equivalent for example to the air puffs modelled in this study. The numerical simulation allows the characterization of the stress fields in the REV represented by the Cauchy stress tensor calculated for all the nodes of the mesh. These stresses are 3-Dim stresses. In other words, they are equivalent to triaxial stresses applied on the faces of the unit cube in the direction of the coordinate axis (Figure 7b). The hydrostatic pressure is associated to a material point at the center of the infinitesimal unit cube. It gives information on the way this material point perceives the 3-Dim stresses. Two cases can be encountered:
- positive hydrostatic pressure: at the material point level, in average, the unit cube is subjected to traction in the directions of the coordinate axis (Figure 7c);
- negative hydrostatic pressure: at the material point level, in average, the unit cube is subjected to compression in the directions of the coordinate axis (Figure 7d).

Figure 7. (a) Infinitesimal unit cube centered on a current material point M with the faces parallel to the coordinate planes (b) Infinitesimal unit cube subjected to triaxial stresses in the direction of the coordinate axis (c) Infinitesimal unit cube subjected to positive hydrostatic pressure equivalent to tractions applied in the direction of the coordinate axis (d) Infinitesimal unit cube subjected to negative hydrostatic pressure equivalent to compressions applied in the direction of the coordinate axis.
The discussion of the available numerical results is based on that hypothesis. Let us suppose a state in which no external influences are applied. The skin soft tissues are in an unknown mechanical equilibrium created by life homeostasis. When a slowly increasing compressive external mechanical load is applied at the outer surface of the skin, homeostasis is perturbed. As a direct consequence, the unknown mechanical equilibrium becomes unstable. The skin soft tissues need to face the load and answer in a way that should fulfill its protective functions.
Figure 8 (a and b) gives the numerical hydrostatic pressure as a function of depth at different times (t=4.5s, 9s, 9.9s, 11.9s, 14.5s, 115s, 300s and 3600s) for the young subject for dwell times of 0.5 s and 100s, respectively and magnified graphs for the layers DE and HY.
In the graphs of Figure 8a, the responses of the skin make appear three different phases.
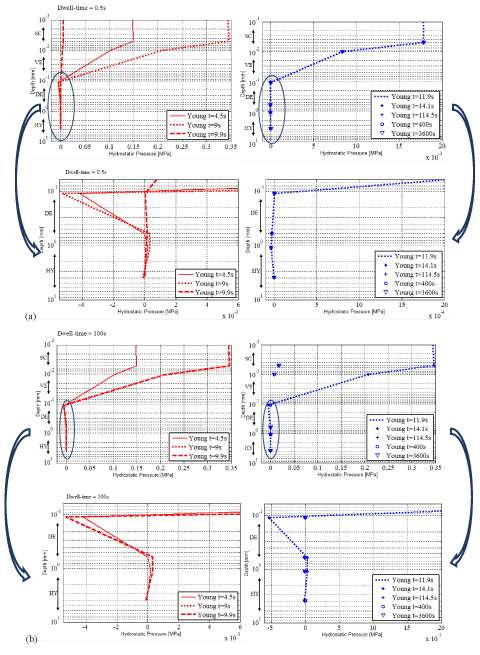
Figure 8. Numerical hydrostatic pressure as a function of depth at times 4.5 s, 9 s, 9.9 s, 11.9 s, 12.7 s, 115 s, 300 s and 3600 s for the young adult and zoom of the numerical hydrostatic pressure in DE and HY (a) for the dwell time of 0.5s, (b) for the dwell time of 100s.
In SC, VE and HY, positive hydrostatic pressures develop. Their amplitudes are strongly dependent on the layer. In SC, the material points of the upper first 1/3 are facing almost constant positive hydrostatic pressure. The remaining bottom 2/3 exhibit hydrostatic pressure decreasing with the depth of the sub-layer. VE displays the same features.
In DE, negative hydrostatic pressures develop in the first 1/3 while they are positive in the other 2/3. In other words, in average, the material points of the first 1/3 are facing compression while the ones in the other 2/3 are under traction.
Mechanically speaking, these results are not so obvious. In the skin, the natural pre-stress introduced by [33] plays an important role. In the natural state, the corneodesmosomes, the corneocyte keratin network, the desmosomes, the fibrous walls, the collagen fibers are under tension and the elastin fibers are scattered among the latter [34]. For small applied compressive stress values, the structural entities including the elastin fibers spread the load among them in search of a new equilibrium.
Translated in terms of the physiology, let us recall that elastin fibers are present in the upper first 1/3 of DE. Classically it is agreed that they play the role of springs absorbing the compressive load [29,34] i.e. springs under compression or material points under negative hydrostatic pressure.
For the other entities, the positive hydrostatic pressure gives an indication of the amplitude of the pre-tension faced by the material points in SC, VE and DE at a given moment and still available for taking off a new increase in the applied external load.
- Phase II: during the dwell time
When the load increased, the first 1/3 of DE went on facing increasing negative hydrostatic pressure (Figure 8). These values highlight the compressed state of the elastin fibers of DE [29,35]. The bottom 2/3 of DE was in a quasi-equilibrium with negligible positive values for the hydrostatic pressure (Figure 8). The remaining part of the natural pre-stress contained in the collagen fibers of DE was now almost equilibrating the transferred part of the applied load. This was due to the reorientation of the collagen fibers in the direction of the load [35]. These rotations of the collagen fibers put the adsorbed ground substance under traction (underlined by the positive values of the hydrostatic pressure) [36,37].
In SC and VE, positive hydrostatic pressures were still present. Their values increased with the increasing load (Figure 8).
In HY, nothing changed apparently. The hydrostatic pressure was positive and it was almost equal to zero (Figure 8). The fibrous walls played the role of a truss. Its beams worked in traction-compression. The part of applied load having reached HY was overtaken by the fibrous walls. It was spread between all the beams. A new equilibrium was obtained.
- Phase III: during the free return
When the external load was removed, positive hydrostatic pressures were spread throughout each layer. In DE, the elastin fibers were no more compressed. The equilibrium between the collagen fibers and the external applied load was broken. The collagen fibers were no more loaded. Hence they cannot put the adsorbed ground substance under traction any more. As a consequence the adsorbed ground substance was relieved. It could evolve in search of a new equilibrium. Doing so, it exerted tractions on the collagen fibers to which it was glued. These tractions contributed to take back the collagen fibers to their initial orientation. In their turn, the collagen fibers put all the structural entities: the corneodesmosomes, the corneocyte keratin network, the desmosomes, the fibrous walls under tractions i.e. positive hydrostatic pressure. The internal tensile efforts supported by the corneodesmosomes and the scaffold of SC have previously been observed by [21].
At the end of the free return, positive hydrostatic pressures were still spread throughout each layer except for the second half of DE which faced negative one.
Comparing the numerical responses obtained for the young subject for the dwell times of 0.5 s (Figure 8a) and 100 s (Figure 8b), respectively, makes appear that his response follows the same tendencies with the three phases for the two dwell times. The amplitudes of the hydrostatic pressure are also equal. Everything tends to underlined that the response of the skin of the forearm of the young subject is influenced by increasing external applied load. The dwell time has no influence on the response [38].
Table 4 proposes a scheme of the REV at the material point level. The vertical under the air flow can be modelled with infinitesimal unit cubes piling up subjected either to compression or to traction. The scheme is drawn for the three phases described here above. They can be drawn the same for both dwell times.
Table 4. Schemes of the REV at the material point level for the three phases for the young subject giving the evolutions of the hydrostatic pressure fields.
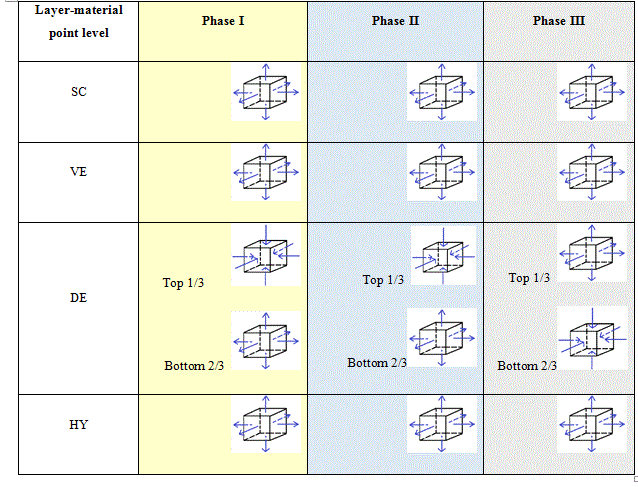
Figure 9 (a and b) gives the numerical hydrostatic pressure as a function of depth at different times (t=4.5s, 9s, 9.9s, 11.9s, 14.5s, 115s, 300s and 3600s) for the elderly subject for dwell times of 0.5 s and 100s, respectively and magnified graphs for the layers DE and HY.
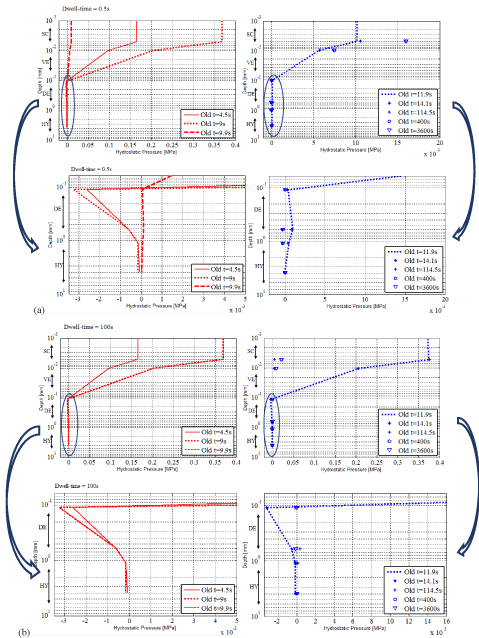
Figure 9. Numerical hydrostatic pressure as a function of depth at times 4.5 s, 9 s, 9.9 s, 11.9 s, 12.7 s, 115 s, 300 s and 3600 s for the elderly subject and zoom of the numerical hydrostatic pressure in DE and HY (a) for the dwell time of 0.5 s, (b) for the dwell time of 100s.
The overall examination of the numerical results of the elderly subject leads to responses of the skin which differ quite considerably from the ones of the young subject. They presented higher values in the three phases.
2021 Copyright OAT. All rights reserv
In SC and VE, positive hydrostatic pressures develop with amplitudes strongly dependent on the layer and decreasing with the depth of the sub-layer.
In DE and HY, negative hydrostatic pressures develop everywhere i.e. the material points are facing compression. Again the elastin fibers were reacting at once taking over part of the load while the collagen fibers re-orient themselves putting the ground substance under traction. During loading, at some point the natural pre-stress has equilibrated the applied load. However, it is observed that the natural pre-stress was overcome by the load leading to the compressive state shown by the numerical results. The physiology of the skin of the elderly subject may give some indications to explain this observation. As reported in [17,26-28, 29] the physiology of the skin of the elderly subject is totally different from the one of the skin of the young subject. In DE, the densities of elastin and collagen fibers are decreasing with age. The composition of the ground substance changes also with age. Therefore, the structural entities present in DE are less strong. They respond with a more pronounced fluid behavior. They overtook a smaller part of the load than the one overtaken by the skin of a younger person. This could be the reason leading to the compressive state they faced. They transferred the remaining part of the load to HY which appeared to be also under compression.
It is as if the structural entities were submersed by the increasing applied load. As if they have no time to respond. Indeed, without going too quickly in the analysis, it can be said that the viscosity properties of the skin of the elderly subject slowdown its responsiveness. Therefore, when the load increased, the structural entities were still trying to adapt to the previous increment and were not yet ready for the new increment.
- Phase II: during the dwell time
When the load increased, the hydrostatic pressure field evolved with the same tendency. SC and VE went on facing tractions in average while DE and HY were subjected to compression type hydrostatic pressure.
- Phase III: during the free return
When the external load was removed, the skin of the elderly subject showed three types of evolutions.
- First when the load is stopped, nothing happen. The structural entities went on with their previous evolution as if nothing had changed in the external applied load.
- Then in a second time, big changes took place in the hydrostatic pressure field which appeared positive in all layers. In DE, the elastin and collagen fibers were no more compressed. The collagen fibers relieved the adsorbed ground substance. The latter started coming back to its natural state and taking back the collagen fibers to their initial orientation. Things evolved as if the adsorbed ground substance had been previously overburdened. Now its responses were overestimated with respect to what would have been necessary for retrieving the initial state.
- At the end of the free return, things have evolved towards a state equivalent to the one found for the young subject: positive hydrostatic pressures spread everywhere except for the second half of DE which faced negative one.
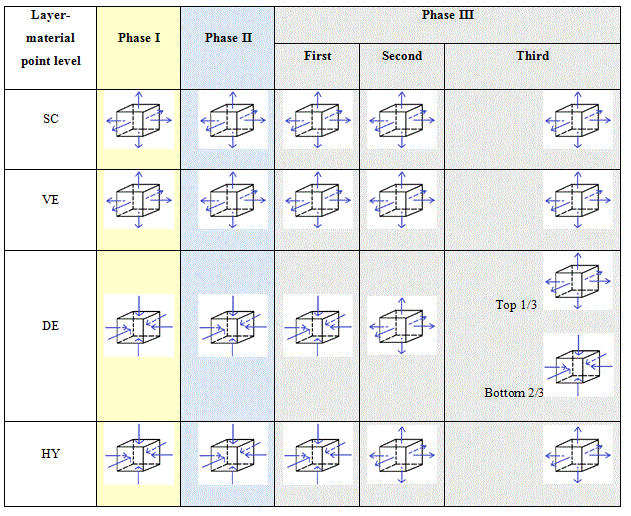
Globally the responses obtained for the elderly for the dwell times of 0.5 s (Figure 9a) and 100 s (Figure 9b) follow the same tendency. Table 5 proposes the scheme of the REV of the elderly subject at the material point level with infinitesimal unit cubes modelling the vertical under the air flow. Again equivalent scheme can be drawn for the three phases for both dwell times. The big difference lies on the values of the hydrostatic pressure. They are higher for the dwell time of 100 s than for the one of 0.5 s. All the numerical results tend to make clear that the dwell time influences the response of the skin of the forearm of the elderly subject as much as the value of the external applied load.
Table 5. Schemes of the REV at the material point level for the three phases for the elderly subject giving the evolutions of the hydrostatic pressure fields.
In Figure 10a, b, c and d, the numerical shear component “Sigma XY” of the Cauchy stress tensor is plotted as a function of depth at different times (t=4.5s, 9s, 9.9s, 11.9s, 14.5s, 115s, 300s and 3600s) for the young and for the elderly subjects for dwell times of 0.5s and 100s, respectively.
Again, both for the young subject and for the elderly subject, the evolutions of their numerical shear component (Figure 10) can be split into three main phases: Phase I-during loading, Phase II-during the dwell time and Phase III-during the free return. Their detailed analysis can be conducted following the same procedure already used for the analysis of the evolutions of the hydrostatic pressure.
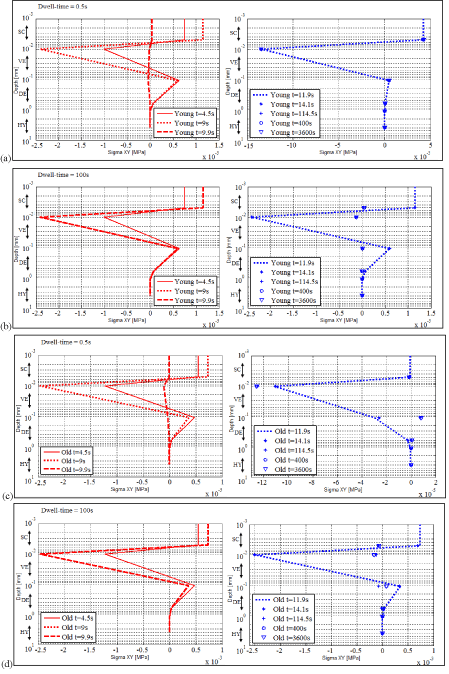
Figure 10. Numerical shear component of the Cauchy stress tensor as a function of depth at times 4.5 s, 9 s, 9.9 s, 11.9 s, 12.7 s, 115 s, 300 s and 3600 s (a) for the young adult for the dwell time of 0.5s (b) for the young adult for the dwell time of 100s (c) for the elderly subject for the dwell time of 0.5s (d) for the elderly subject for the dwell time of 100s.
Tables 6 give the schemes of the REV at the material point level for the young subject.
Table 6. Schemes of the REV at the material point level for the three phases for the young subject giving the evolutions of the shear fields.
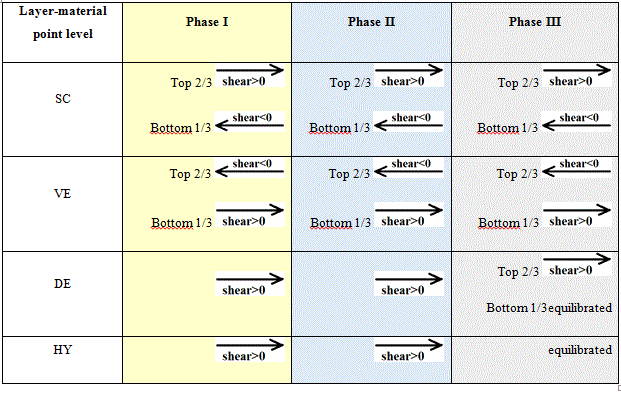
For the young subject: we retrieve the findings observed with the hydrostatic pressure. The shear fields are influenced by increasing external applied load but not by the dwell time chosen for applying this load. The amplitude of the response in terms of shear increases with increasing loads.
Tables 7 give the schemes of the REV at the material point level for the elderly subject.
Table 7. Schemes of the REV at the material point level for the three phases for the elderly subject giving the evolutions of the shear fields.
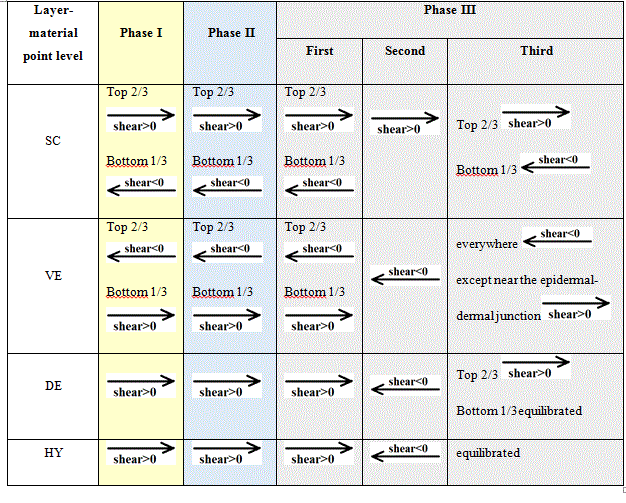
For the elderly subject: both the amplitude of the load and the dwell time are influencing the evolutions of the shear stress fields. The shear stresses were greater for the elderly subject than for the young subject. They were also greater for longer dwell time (100s) than for shorter ones (0.5s).
Two key points appear for both subjects and both dwell times:
- The shear stress fields present two extrema. They always took place at the same depths. The first extrema is a negative extremum which develops at the boundary between SC and VE. The second extrema is a positive extremum which develops at the boundary between VE and DE. As can be read on the graphs of Figure 10, the values of these extrema are higher for the elderly subject than for the young subject. For one person, their order of magnitude is equivalent for the two dwell times.
- The numerical results showed the onset and growth of two sliding planes in the upper layers of skin. These planes can be found one in SC and the second one in VE. For example for the young subject and for the dwell time of 0.5, the first plane is observed in SC around depth 0.005mm and the second plane is observed in VE around depth 0.05mm. These two planes are parallel to the outer skin surface. They are moving planes i.e. depending on the age of the person, the amplitude of the load and the dwell time they tend to move deeper in the tissues.
The two sliding planes define a tissue thickness subjected to opposing shear stresses.
In terms of physiology the shear fields provide information coherent with the ones brought by the hydrostatic pressure fields. In other words, when the external load implies transfers of internal efforts from the adsorbed ground substance to the desmosomes, the latter combines two internal efforts: the internal efforts from the adsorbed ground substance and the shear from the external load.
The above detailed information on the hydrostatic pressure fields and on the shear stress fields as a result of external applied air puff clearly shows the inhomogeneous mechanical efforts developed in the various tissue layers and the areas of high internal stresses. Combining these descriptions with the physiology of individual tissue layers has highlighted the particular states of each layer.
Subjected to an air puff of 7277.14Pa during 0.5s or 100s, hydrostatic pressures developed in the range [-0.05MPa, 0.4MPa] and shear stresses were characterized in the range [-3.0E-3 MPa, 1.5E-3MPa]. These stresses put the structural entities of SC, VE, DE and HY under coupled tensions-compression type efforts and shears. During daily life, the corneodesmosomes, the corneocyte keratin network, the desmosomes, the collagen and elastin fibers, the adsorbed ground substance and the fibrous walls withstood easily these combined stresses. Unfortunately cases happen for which existing histopathological events (localized light or severe ischemia [39-41], bridges already jeopardized by previous damaging mechanical loads [42-45], impaired lymphatic drainage and interstitial fluid flows [46-48], reperfusion injuries [49-50]) may have weakened their strength. In such cases, when soft tissues are already jeopardized, their degradation will continue and increase [6]. Remembering that blood and lymph vessels are present in DE and HY, globally, the compressive hydrostatic pressure in DE and HY can further slowdown the necessary interstitial fluid flows. These impaired flows will tend to decrease the oxygen and nutrients supplies as well as the compulsory lymphatic drainage [46-48]. In such an environment, cells found difficult to survive, their state may deteriorate quickly and their morbidity may increase in DE and HY. These events will propagate till VE owing to the fact that the cells in VE are supplied with nutrients by the interstitial fluids originating in the underlying DE and transported across the epidermal-dermal junction. If homeostasis is no more obtained in DE and HY, it will also fail to exist in VE. VE is the supplier of the building materials of SC: lipid mortar and corneocytes. In the end, the small deviation occurring in interstitial flows which originated in DE and HY will spread to all the layers. Further, in VE, the desmosomes are subjected to these physiological events coupled with the mechanical efforts coming from the transfer of internal efforts and to shear. Their resistance is threatened till its limit. If the limit of resistance happens to be exceeded, the horizontal sliding planes introduced earlier in the discussion may become the places where loss of integrity starts. It can eventually lead to tissue breakdowns that may lead to severe pressure ulcer if it extends in all the cutaneous tissues.
The load-bearing capacity of the skin layers soft tissues is not yet well known in vivo. It is agreed that it depends on many systemic and local factors, such as the healthy or diseased state of the person, temperature and nutritional status. Therefore the intensity (light or severe) of the possible pressure ulcers will be patient dependent. The characterization of the amplitudes of this load-bearing capacity is out of the scope of this work.
This paper proposed a model for characterizing the hydrostatic pressure fields and the shear stress fields in four distinguished layers of the human skin.
The 3-Dim finite element model works on a stratified representative elementary volume (REV) with homogeneous linear viscoelastic isotropic materials in each layer.
Examples numerical simulations are proposed to show the versatility of the model. First the model allows working with patients’ designed mechanical properties. Here, the dimensions of the REV were deduced from measurements reported in [30] and the viscoelastic parameters were tuned on the experimental contact-free creep tests reported in [31] for a young adult and an elderly subject. The applied mechanical load modelled an air puff applied onto the outer surface of the REV with two different dwell times: 0.5 s and 100 s. The numerical simulations performed with the SYSTUS® software lead to the search stress fields in the REV.
A detailed analysis of the numerical results was proposed. It pointed out that the mechanical information contained in the stress fields can give clues on what happen in the volume in terms of the mechanical evolutions of the responses of the skin layers in relation with the physiology of the skin.
The numerical results gave the values of the stresses withstood by the structural entities in charge of the integrity of the skin volume.
It is shown that knowing the bearing-capacities of these entities and their state, it can be guessed the possible occurrence of pressure ulcers and in which places they will initiate.
- If the values of the stresses do not disrupt the interstitial fluids flows but overcome the mechanical resistance: the viable epidermis will be the place where mechanical breakdowns may start. Physiological consequences can contribute to spread the problem in the other layers.
- If the values of the stresses disrupted the interstitial fluids flows: the physiological consequences will lead to possible breakdowns with onset in the dermis and growth in the hypodermis, the viable epidermis and the stratum corneum. Moreover it will be associated in the viable epidermis with mechanical consequences which may speed up the loss of integrity.
Based on these findings, it is proposed to say that tissue breakdowns depend closely on the couplings between the concentration of mechanical stresses in a sub-layer and its physiological state.
This approach is proposed as an initial contribution. It is thought that this model could provide fundamental knowledge about the etiology of pressure ulcers. This knowledge can be usefull in the design of effective clinical identification and prevention.
- August DL, Edmonds L, Brown DK (2014) Pressure injuries to the skin in a neonatal unit: Fact or fiction. J Neonatal Nursing 20: 129-137.
- Schlüer AB (2017) Pressure ulcers in maturing skin - A clinical perspective. J Tissue Viability 26: 2-5. [Crossref]
- Zuo XL, Meng FJ (2015) A care bundle for pressure ulcer treatment in intensive care units. I J Nursing Sciences 2: 340-347.
- Baran PM, Birjandtalab J, Nourani M, Pompeo MDM (2016) Automatic limb identification and sleeping parameters assessment for pressure ulcer prevention Comput Biol Med 75: 98-108. [Crossref]
- Lahmann NA, Kottner J (2011) Relation between pressure, friction and pressure ulcer categories: A secondary data analysis of hospital patients using CHAID methods. Int J Nurs Stud 48: 1487-1494. [Crossref]
- Xiao DZT, Wu SYQ, Mak AFT (2014) Accumulation of loading damage and unloading reperfusion injury – Modeling of the propagation of deep tissue ulcers. J Biomech 47: 1658-1664. [Crossref]
- Derler S, Rotaru MM, Ke W, El Issawi-Frischknecht L, Kellenberger P, et al. (2014) Microscopic contact area and friction between medical textiles and skin. J Mech B Biomed Mat 38: 114-125. [Crossref]
- Rotaru GM, Pille D, Lehmeier FK, Stämpfli R, Sailer SA, et al. (2013) Friction between human skin and medical textiles for decubitus prevention. Tribol Int 65: 91-96.
- Gefen A, van Nierop B, Bader DL, Oomens CW (2008) Strain-time cell-death threshold for skeletal muscle in a tissue-engineered model system for deep tissue injury. J Biomech 41: 2003-2012. [Crossref]
- Taylor R, James T (2005) The role of oxidative stress in the development and persistence of pressure ulcers, Pressure Ulcer Research. Springer 205-232.
- Gefen A (2011) How do microclimate factors affect the risk for superficial pressure ulcers: A mathematical modeling study. J Tissue Viability 20: 81-88. [Crossref]
- Bouten CV, Oomens CW, Baaijens FP, Bader DL (2003) The etiology of pressure ulcers: skin deep or muscle bound? Arch Phys Med Rehabil 84: 616-619. [Crossref]
- Huang S, Zhang Z, Xu Z, He Y (2015) Modeling of human model for static pressure distribution prediction. IJ Ind Ergonomics 50: 186-195.
- Levy A, Frank MB, Gefen A (2015) The biomechanical efficacy of dressings in preventing heel ulcers. J Tissue Viability 24: 1-11. [Crossref]
- Mohanty PP, Mahapatra SS (2014) A finite element approach for analyzing the effect of cushion type and thickness on pressure ulcer. I J Ind Ergonomics 44: 499-509.
- Oomens CWJ, Broek M, Hemmes B, Bader DI (2016) How does lateral tilting affect the internal strains in the sacral region of bed ridden patients?-A contribution to pressure ulcer prevention. Clinical Biomech 35: 7-13. [Crossref]
- Daly CH, Odland GF (1979) Age-related changes in the mechanical properties of human skin. J Invest Dermatol 73: 84-87. [Crossref]
- Kvistedal YA, Nielsen PMF (2009) Estimating material parameters of human skin in vivo. Biomech. Model Mechanobiol 8: 1-8.
- Silver FH, Freeman JW, DeVore D (2001) Viscoelastic properties of human skin and processed dermis. Skin Res Technol 7: 18-23. [Crossref]
- Tran, H.V., 2007. Caractérisation des propriétés mécaniques de la peau humaine in vivo via l’IRM. Mechanics. Université de Technologie de Compiègne. French.
- Norlén L, Al-Amoudi A (2004) Stratum corneum keratin structure, function, and formation: the cubic rod-packing and membrane templating model. J Invest Dermatol 123: 715-732. [Crossref]
- Humphrey JD, Dufresne ER, Schwartz MA (2014) Mechanotransduction and extracellular matrix homeostasis. Nat Rev Mol Cell Biol 15: 802-812. [Crossref]
- Reinhart-King CA1 (2011) How matrix properties control the self-assembly and maintenance of tissues. Ann Biomed Eng 39: 1849-1856. [Crossref]
- Kao AP, Connelly JT, Barber AH (2016) 3D nanomechanical evaluations of dermal structures in skin. J Mech Behav Biomed Mater 57: 14-23. [Crossref]
- Geerligs M (2009) Skin layer mechanics, Dissertation, Eindhoven University of Technology.
- Jacquemoud C (2007) Caractérisation mécanique et modélisation du comportement jusqu’à rupture de membranes biologiques fibreuses: application à la peau humaine, Thèse Doctorat, INSA, Lyon.
- Frances C, Branchet MC, Boisnic S, Lesty CL, Robert L (1990) Elastic fibers in normal human skin, variations with age: a morphometric analysis. Arch Geront Geria 10: 57-67. [Crossref]
- Zuccarello VL, Cappelletti S, Dal Pozzo Rossi V, Mirella Sari-Gorla M (1994) Stereological analysis of collagen and elastic fibers in the normal human dermis: variability with age, sex, and body region. v Anat Rec 238: 153-162. [Crossref]
- Agache P (2000) Physiologie de la peau et exploration fonctionnelles cutanées, Edition Médicales internationals, Cachan, France.
- Boyer G (2010) Modélisation du comportement mécanique de la peau humaine in vivo : application au vieillissement et aux gestes du clinicien, Thèse doctorat, ENISE, Saint-Etienne.
- Ayadh M, Abellan MA, Chatelin R, Bergheau JM, Zahouani H (2017) Contribution à la simulation numérique du comportement viscoélastique de la peau humaine jeune et âgée in vivo, Colloque National en Calculs des Structures, 15-19 mai, Giens.
- Bathe KJ (1996) Finite element procedures, Prentice Hall, Upper Saddle River, New Jersey 07458.
- Langer K (1978) On the anatomy and physiology of the skin, II.Skin tension. Br J Plast Surg 31, 93-106. [Crossref]
- Oxlund H, Manschot J, Viidik A (1988) The role of elastin in the mechanical properties of skin. J Biomech 21: 213-218. [Crossref]
- Holzapfel GA (2000) Biomechanics of soft tissue, Computat.Biomech., N°7, November.
- Jouanna P, Abellan MA (1996) A generalized approach to heterogeneous media. Transport in Porous Media 25: 351-374.
- Truesdell C, Toupin R (1960) The classical field theories, Handbuch der Physik III/I, Springer, Berlin.
- Abellan MA, Ayadh M, Azzez K, Bergheau JM (2017) Influence du temps de maintien sur la réponse viscoélastique de la peau humaine jeune in vivo lors d’essais de fluage sans contact, Colloque National en Calculs des Structures, 15-19 mai, Giens.
- Daniel RK, Priest DL, Wheatley DC (1981) Etiologic factors in pressure sores: an experimental model. Arch Phys Med Rehabil 62: 492-498. [Crossref]
- Dinsdale SM (1974) Decubitus ulcers: role of pressure and friction in causation. Arch Phys Med Rehabil 55: 147-152. [Crossref]
- Scheel-Sailer A, Frotzler A, Mueller G, Annaheim S, Rossi RM, et al. (2017) Biophysical skin properties of grade 1 pressure ulcers and unaffected skin in spinal cord injured and able-bodied persons in the unloaded sacral region. J Tissue Viability 26: 89-94. [Crossref]
- Bouten CV, Knight MM, Lee DA, Bade DL (2001) Compressive deformation and damage of muscle cell subpopulations in a model system. Ann Biomed Eng 29: 153-163. [Crossref]
- Burk RS, Grap MJ (2012) Care of Patients with Acute Pulmonary Disorders. Backrest position in prevention of pressure ulcers and ventilator-associated pneumonia: Conflicting recommendations. Heart and Lung 41: 536-545.
- Kottner J, Gefen A, Lahmann N (2011) Weight and pressure ulcer occurrence: a secondary data analysis. Int J Nurs Stud 48: 1339-1348. [Crossref]
- Ledoux WR, Shofer JB, Cowley MS, Ahroni JH, Cohen V, et al. (2013) Diabetic foot ulcer incidence in relation to plantar pressure magnitude and measurement location. J Diabetes Complications 27: 621 -626.
- Manorama AA, Baek S, Vorro J, Sikorskii A. Bush TR (2010) Blood perfusion and transcutaneous oxygen level characterizations in human skin with changes in normal and shear loads – Implications for pressure ulcer formation. Clinical Biomech 25: 823-828. [Crossref]
- Miller GE, Seale J (1981) Lymphatic clearance during compressive loading. Lymphology 14: 161-166. [Crossref]
- Reddy NP, Cochran GV (1981) Interstitial fluid flow as a factor in decubitus ulcer formation. J Biomech 14: 879-881. [Crossref]
- Herman EC, Knapp CF, Donofrio JC, Salcido R (1999) Skin perfusion responses to surface pressure-induced ischemia: implication for the developing pressure ulcer. J Rehabil Res Dev 36: 109-120. [Crossref]
- Liao F, Garrison DW, Jan Y-K (2010) Relationship between nonlinear properties of sacral skin blood flow oscillations and vasodilatory function in people at risk for pressure ulcers. Microvasc Res 80: 44-53. [Crossref]


