Abstract
In this paper, we report a novel and sensitive optical sensing protocol for the detection of mercury (II) ions based on colorimetry combined with intermolecular split G-quadruplex DNAzymes and the conjugation of thymine-Hg2+-thymine. A T-rich strand A was assembled onto the biomagnetic beads. Two other oligonucleotide strands (strands B and C) were employed, which are each composed of a capture segment (T-rich part) and a sensing segment (G-rich part). In the presence of Hg2+, the capture segments of both strands B and C can hybridise with biotin-strand A on magnetic beads to form the stable DNA duplexes through T-Hg2+-T linkages. The formation of the DNA duplex brings the sensing segments of both strands B strand C close enough to constructed an intermolecular split G–quadruplex. This split G-quadruplex is able to effectively catalyse the H202-mediated oxidation of ABTS in the presence of hemin, generating the blue-green product ABTS+ and increasing the absorption signal at 421 nm. Therefore, the change in the absorption signal at 421 nm can be used to monitor the concentration of Hg2+. The calibration curve of the assay was linear over the range of Hg2+ concentrations from 2 to 50 nM, and the detection limit was 0.8 nM. Moreover, the influence of the intermolecular split G-quadruplex DNAzyme strands on the catalytic ability is also discussed. The practical results obtained imply that the proposed colorimetric biosensor can be extended for the detection of trace Hg2+ in environmental water and drinking water.
Key words
magnetic nanoparticles, intermolecular split G-quadruplex DNAzymes, mercury ions, thymine-Hg2+-thymine
Introduction
The mercury ion (Hg2+) is one of the most well-known widespread environmental pollutants and has distinct toxicological profiles that can cause deleterious effects on human health and the environment, even at low concentrations, as well as posing a challenge to the global plan of maintaining a sustainable environment[1,2]. Water-soluble Hg2+ is one of the most usual and stable forms of mercury contamination due to its high toxicity and bioaccumulation, and the Hg2+ pollution of water sources is serious in many countries and regions[3]. Once it enters into water sources and the bacteria turn it into an organic form, mercury can accumulate in organisms, eventually being ingested by humans through the food chain, which may affect their immune systems, enzyme systems, and damage their nervous systems, result in kidney failure, acrodynia and minamata disease. Therefore, routine testing for trace amounts of Hg2+ with excellent selectivity and sensitivity is important for water pollution control and drinking water safety.
Traditional analysis methods for the detection of Hg2+ in water samples include cold vapour atomic fluorescence spectrometry (CV-AFS)[4], cold vapour atomic absorption spectroscopy (CV-AAS)[5], inductively coupled plasma mass spectroscopy (ICP-MS)[6] and so on. Although these methods are highly sensitive, stable, selective, and usually have DRs (Detected range of signal) of more than 4-5 orders of magnitude, they usually involve sophisticated instruments, skilled personnel, and complicated harmful sample pre-treatment methods. A colorimetric system has been introduced because of its stability and better ability to be controlled. However, its low sensitivity cannot meet the requirement for Hg2+ detection in drinking water.
Recently, many mercury ion sensors based on colorimetry combined with the DNAzymes and the conjugation of thymine-Hg2+-thymine have been proposed to overcome these limitations [7-10]. The use of strands plentiful in thymine (as the recognising element) and DNAzymes (as the sensing element) is beneficial to colorimetric mercury ion sensors allowing harmful pre-treatments to be avoided and an improved detection sensitivity to be achieved. In our previous work, we have used the intramolecular split DNAzyme as catalyzer to contribute Hg2+ sensor [11]. In contrast with intramolecular split G-quadurplex DNAzyme, the intermolecular split DNAzymes, which are composed of two strands of DNA, could decrease background and make the design of strategy more flexible [12, 13]. However, it is reported that the catalytic capability of split DNAzymes is closely related to the base sequences of the DNAzyme strands [14]. That is to say, the characteristics of the split DNAzyme strands, such as their sequences, lengths and patterns of assembly are related to the sensitivity and selectivity of the assay, and therefore, all of these characteristics should be seriously discussed and well-designed [15,16].
Herein, we proposed a new colorimetric biosensor based on intermolecular split G-quadruplex DNAzymes for the detection of mercury ions. In addition, magnetic nanoparticles (MNPs) are used as carriers of the recognising strands in our assay to remove other co-existing interfering ions through magnetic separation due to their good biocompatibility, easy handling, and ability to minimise the background. As illustrated in Scheme 1, the T-rich A strands (modified with a biotin group at the 5’ end) were assembled onto streptavidin-coated MNPs. Two other oligonucleotide strands (strands B and C) were also used. These two strands are each composed of a capture segment and a sensing segment. The capture segment (marked as the red and purple parts in Scheme 1) is the T-rich segment to catch Hg2+ by forming the T-Hg2+-T base pair, while the sensing segment (marked as the blue and yellow parts in Scheme 1) is the G-rich part that can form a catalytically active G-quadruplex in the presence of hemin. Therefore, in the presence of Hg2+, the capture segments of SB and SC can each hybridise with SA to form a stable DNA duplex by T-Hg2+-T linkages. The formation of the DNA duplex makes the G-rich parts of SB and SC in close contact with each other, and a split G–quadruplex can be constructed, which is able to effectively catalyse the H202-mediated oxidation of ABTS in the presence of hemin, generating the blue-green coloured product ABTS+ and increasing the absorption signal at 421 nm. Hence, the change in the absorption signal at 421 nm can be applied to monitor the formation of the G-quadruplex structure, which is closely related to the Hg2+ concentration.
Experimental
Reagents and apparatus
All of the oligonucleotides purified by HPLC were synthesised by the Shanghai Sangon Biotechnology Co., Ltd. (Shanghai, China), and their sequences are listed in Table 1. Streptavidin-coated magnetic nanoparticles (MNPs) were obtained from Chemicell GmBH (Germany). Dimethyl sulfoxide (DMSO), Triton X-100, 30% H2O2, and hemin were purchased from Sigma Chemical Co. (Shanghai, China). Tris-(hydroxymethyl) aminomethane hydrochloride (Tris-HCl) and ABTS were purchased from the Shanghai Sangon Biotechnology Co., Ltd (Shanghai, China). 4-(2-Hydroxyethyl) piperazine-1-ethanesulfonic acid (HEPES) was obtained from the Bio Basic Co. (Canada). Bovine serum albumin (BSA) was purchased from New England Biological Technology Co., Ltd. (Beijing, China).
Table 1. Nucleic acid sequences.
Name |
Sequences |
SA1 |
5'-CTTGCTCGGTTCGCTC-3' |
SB1 |
5'-GGGTTGGGACCGTGCTTG-3' |
SC1 |
5'-GTGCGTTCACGGGTAGGG-3' |
SA2 |
5'-CTTGCTCTTCTCGTTC-3' |
SB2 |
5'-GGGTTGGGACTGTGCTTG-3' |
SC2 |
5'-GTTCGTGTACGGGTAGGG-3' |
SA3 |
5'-GTTGCTCCCTCCGCTCGTTCGTGG-3' |
SB3 |
5'-GGGTTGGGACGGTGGGTGCTTC-3' |
SC3 |
5'-CCTCGTTCGTGCACGGGTAGGG-3' |
SA4 |
5'-TCTGCTTGCTGTTCGTGTTC-3' |
Biotin-SA4
-SA4 |
5'-biotin-C20-TCTGCTTGCTGTTCGTGTTC-3' GTTCGTGTTC-3' |
SB4 |
5'-GGGTTGGGACTGCTTGCTGT-3' |
SC4 |
5'-GTTCTCGTTCACGGGTAGGG-3' |
An HZQ-C thermostatic shaker (Donglian Electrical Technology Co., Ltd., China) was used to assemble the oligonucleotide strands onto the surfaces of the MNPs. Colorimetric measurements were performed on a Cary 50 UV–visible spectrophotometer (Varian, Palo Alto, USA). CD experiments were performed on a JASO J-815 spectropolarimeter.
Preparation of strand A modified MNPs
An 100 μL solution of streptavidin coated MNPs (diameter 100 nm, 10 mg/ml) was mixed with 100 μL (5 μmol/L) of biotin-SA4 and 100 µL of SSC (Saline sodium citrate) buffer. After 2 h of incubation with gentle shaking at 37°C, the mixture was washed three times with SSC buffer to remove redundant SA. A 2% BSA solution was used to block the MNPs surface and eliminate further nonspecific adsorption, and then, 1 h of blocking treatment was settled. The MNPs-SA were finally stored in 200 μL of Hg2+ capture buffer at 4°C for further use.
Circular dichroism spectroscopy measurements
Briefly, a mixed solution of 10 μL of 0.12mmol/L SA, 10 μL of 0.12 mmol/L SB, 10 μL of 0.12 mmol/L SC and 80 μL of capture buffer was heated at 90°C for 5 min. Then, 8 nmol mercury ions mixed with 25 μL of 200 mmol/L KAc were added, and the solution was diluted to 400 μL with 2×HEPES buffer. After incubation at 37°C for 4 h, the CD measurement was performed on a JASO J-815 spectropolarimeter with a 2 nm bandwidth and 100 nm/min scan speed.
Hg2+ recognition
A solution of 15 μL of 5 μmol/L SB4, 15 μL of 5 μmol/L SC4, 30 μL of 5mg/mL MNPs-SA4, 100 μL of Hg2+ capture buffer, 125 μL of 200 mmol/L KAc and various concentrations of the Hg2+ solution were mixed thoroughly. The volume of the solution was fixed to 500 μL by the addition of 2×HEPES buffer, and then it was incubated with gentle shaking at 37°C for 4 h to form intermolecular split G-quadruplex DNAzymes. After that, 5 μL of 5 μmol/L hemin was added, and the mixture was reacted at the same conditions for 40 minutes. Finally, the complex was separated from the mixture solution, washed with 2×HEPES buffer twice and then resuspended in 440 μL of 2×HEPES buffer for colorimetric measurement.
Colorimetric measurements
Fifty microliters of 40 mmol/L ABTS and 10 μL of 59 μmol/L H2O2 were added into the above buffer. The absorption spectrum of ABTS+ was measured at 421 nm. The equation ΔA421nm = A421nm - A0 was used for quantitative analysis, in which A0 indicates the background absorption.
Results and discussion
Design of the Hg2+-sensing assay
To validate the mechanism of the developed Hg2+-sensing assay, the peroxidising activities of hemin, MNPs-SA4, and the mixtures of MNP-SA4, SB4, SC4 and hemin with and without Hg2+ were compared in the ABTS-H2O2 system. As shown in Figure 1, curve a presents the absorption of ABTS. Although hemin is thegood catalyzer, the free form of hemin would be eliminated by washing step; therefore, a lower catalytic curve has been observed (curves b). MNPs-SA4 showed inherently low catalytic activities, and ABTS cannot be oxidised by hydrogen peroxide under the usual conditions (curves c). When the component DNAzyme strands SB and SC were added, the system exhibited just a little higher peroxidising activity, demonstrating that the free forms of SB and SC in solution could not construct a stable G-quadruplex to catalyse the oxidation of ABTS (curve d). In the presence of Hg2+, the absorption signal at 421 nm rose sharply, indicating that the oxidation of ABTS was violently catalysed by the intermolecular split DNAzyme. The increase in the absorbance (A421nm) in curve e is the result of the hybridisation between SA, SB and SC by T-Hg2+-T to construct the sandwich system forcing both the G-rich ends of SB and SC close together to form a very stable catalytically active G-quadruplex-hemin DNAzyme, demonstrating that the formation of a sandwich in the presence of Hg2+ is the key to the Hg2+ sensor. This result successfully suggests the feasibility of the Hg2+-sensing protocol mentioned in Scheme 1.
Figure 1. The catalysis spectral curves of ABTS (a), MNPs-SA4 (b), hemin (c), a mixture of MNPs-SA4, SB4, SC4 and hemin with (e) and without (d) Hg2+. Experimental conditions: [ABTS] = 4 mM, [H2O2] = 1.2 μM, [Hg2+] = 100 nM, [hemin] = 50nM, [MNPs-SA4] = 150μg, [SB4] = 150 nM, and [SC4] = 150 nM. All of the spectra were collected at 8 min after the catalytic reaction.
Experimental conditions: [ABTS] = 4 mM, [H2O2] = 1.2 μM, [Hg2+] = 100 nM, [hemin] = 50 nM, [MNPs-SA4] = 150 μg, [SB4] = 150 nM, and [SC4] = 150 nM. All of the spectra were collected at 8 min after the catalytic reaction.
It is imperative for the proposed Hg2+ sensing strategy to demonstrate that without the target Hg2+, the free forms of SB and SC would not construct the G-quadruplex even in a semi-stable state, which would result in a high background and false response. To meet this requirement, four versions of SA, SB, and SC with different base sequences and lengths were carefully designed to ensure that the intermolecular split G-quadruplex DNAzyme was constructed only in the presence of Hg2+. As shown in Figure 2, the black bars, sparse bars and dense bars represent the absorption signal of free hemin, the mixture of the MNPs-SA, SB, SC, and hemin with and without Hg2+, respectively. All dense bars in Figure 2 were a little higher than the black bars to different extents, exhibiting the liable G-quadruplex might be formed in the absence of mercury ions. The complementary G-C base pair of the SA strands between their corresponding SB or SC are 50% (version 2 and 4), 62.5% (version 1) and 66.7% (version 3), which can incline SB and SC to become close to each other by partial hybridisation and the formation of an unstable G-quadruplex. Except for the fourth version, all of the absorbance signals in the presence of Hg2+ (sparse bars) were slightly lower than the signals without Hg2+ (dense bars), indicating that the lesion of the intermolecular split DNAzymes occurred due to the intercalation of mercury ions loosening the G-quardruplex. The sparse bar of version 4, which is much higher than the signals of free hemin and the mixture without Hg2+, indicates that only the fourth version is consistent with the Hg2+-sensing mechanism as we expected. In four versions, the shortest strands are the SA1 and SA2 strands, both of them having 16 bases, and SA3 is the longest with 24 bases, while the SA4 is in the middle with 20 bases (Table 1). The rise of the sparse bar in version 4 demonstrates that the liable state G-quadruplex DNAzymes would be stabilised in the presence of mercury ions with the strands of the sandwich (SA, SB and SC) having a suitable number of G/C and T-T mismatched bases in the appropriate length.
Figure 2. The absorption signals of free hemin (black bars) and the sensor solution in the absence (dense bars) or presence (sparse bars) of Hg2+ when different strand sequences were used. Experimental conditions: [ABTS] = 4 mM, [H2O2] = 1.2 μM, [hemin] = 50 nM, [Hg2+] =100nM, [SA] = 150 nM, [SB] = 150 nM, and [SC] = 150 nM.
The results of the previous three versions indicate that the formation of split DNAzymes and their catalytic activities were heavily influenced by the characters (sequence and length) of the strands (SA, SB and SC). Therefore, CD spectroscopy was used to further test this hypothesis on account of each type of DNA strand possessing its own special CD spectrum (Figure 3). It has been reported that a positive CD signal at 263 nm and a negative one at 240 nm are characteristics of a parallel conformer[17]. As shown in Figure 3(C), both the CD spectra of the SA, SB and SC mixture and the mixture with Hg2+ displayed a positive peak at approximately 260 nm and a negative peak at approximately 240 nm, suggesting that the parallel G-quadruplex was formed and exhibited a higher peroxidative activity, which is consistent with the UV-vis absorption signal (Figure 2, column 3). The CD spectra of versions 1 (Figure 3A), 2 (Figure 3B) and 4 (Figure 3D) visualise completely different from the CD spectrum of the third version. All of them exhibit two positive peaks at approximately 260 and 290 nm and a negative peak at approximately 240 nm. It is said that if there is a small positive peak at 265 nm along with a negative peak approximately 240 nm and a stronger positive peak at 295 nm, the version may be characterised as a hybrid of parallel/antiparallel structures [12,18,19]. Therefore, the conformations of the G-quadruplex split DNAzymes in these three versions are mixtures of parallelism and anti-parallelism. The CD signals (solid lines in Figure 3A and B) reduced accordingly in the presence of Hg2+, partly because of the liable state G-quadruplex structures being gradually decomposed with the addition of Hg2+, which weakened the catalytic activity of the system. As shown in Figure 3D, the CD signals (solid line) were obviously higher than the signals of the dashed line, reflecting the perfect formation of the stable catalytically active G-quadruplex DNAzymes. The results obtained from the above experiments make it clear that only the fourth version exhibited a high catalytic peroxidative activity with the addition of Hg2+.
Figure 3. The CD spectra of system SA1/SB1/SC1 (A), system SA2/SB2/SC2 (B), system SA3/SB3/SC3 (C) and system SA4/SB4/SC4 (D) in the absence (red dashed lines) and presence of Hg2+ ions (black solid curves). Experimental conditions: [SA] = 3 μM, [SB] = 3 μM, [SC] = 3 μM and [Hg2+] = 20 μM.
The interaction between SB and SC was also introduced to illustrate the inherent catalytic activity of the system in the absence of Hg2+. In the former three versions, there are many complementary base pairs (e.g., G-C, A-T) between SB and SC (Figure S1A, 1B and 1C see supplementary content), and their binding affinities (ΔGs) as well as melting temperatures (Tm) are both high (Table S1), suggesting that they could partly hybridise with each other. It has been reported that a nucleic acid strand possessing four, or more than four, poly (dG) domains can construct the intramolecular G-quadruplex [13, 20]; however, only two poly (dG) domains in those versions of SB or SC cause the formation of intermolecular G-quadruplexes instead of by the association of SB and SC. Therefore, the mixture of SA, SB, SC, and hemin without mercury ions in the former three versions showed an enhanced peroxidative activity. While with the addition of Hg2+, the liable state G-quadruplex-hemin DNAzymes in these three versions cannot be further stabilised due to that the number of the T-T mismatches verses the length of the SA strands was too few. Whereas, in the fourth version (Figure S1D), the complementary base pairs (e.g., G-C, A-T) of the hybridised SB4 and SC4 is few, and their binding affinity (ΔG) and melting temperature (Tm) are low (Table S1), indicating that the interaction between SB and SC is very weak. Moreover, there are adequate numbers of T-T mismatches between SA and SB/SC to constitute duplexing by T-Hg2+-T, and stable G-quadruplex intermolecular DNAzymes form so that the MNPs-SA4/SB4/SC4/hemin system could express the supernal peroxidative activity in the presence of Hg2+. All of the above results validated that if positive responses are required, the low affinity between the component strands of the intermolecular split G-quadruplex should be encouraged and complementary bases between them should be avoided.
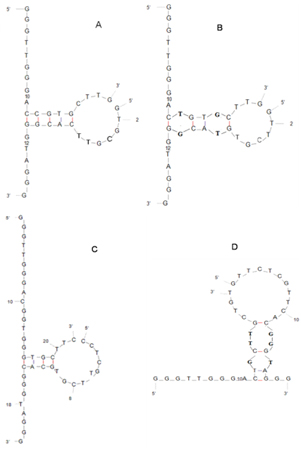
Figure S1. The conformations of SB and SC: (A) SB1 + SC1; (B) SB2 + SC2; (C) SB3 + SC3; and (D) SB4 + SC4.
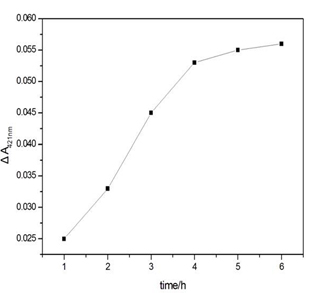
Figure S2. Influence of the Hg2+ capture time on the ΔA421nm of the sensing system in the presence of Hg2+. Experimental conditions: [SB4] = 150 nM, [SC4] = 150 nM, [Hg2+] = 100 nM, [hemin] = 50 nM, [ABTS] = 4 mM; and [H2O2] = 1.2 μM.
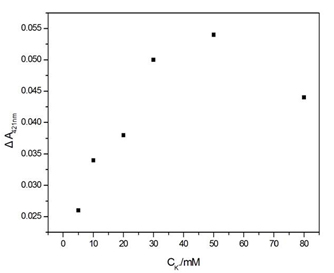
Figure S3. Influence of the concentration of K+ on the ΔA421nm of the sensing system. Experimental conditions: [SB4] = 150 nM, [SC4] = 150 nM, [Hg2+] = 100 nM, [hemin] = 50 nM, [ABTS] = 4 mM, and [H2O2] = 1.2 μM.
Optimisation of the experimental parameters
The experimental parameters (e.g., the capture time of Hg2+ and the concentration of K+) that could affect the analytical performance and results were optimised. Data on the capture time over the range from 1 to 6 h at room temperature were obtained (Figure S2). These data reveal that the ΔA421nm of the supernatant increases sharply as the capture time increases up to 4 h and remains stable for another two hours. Another factor taken into account for the parameter optimisation is the concentration of K+. In general, G-quadruplex structures can be stabilised by alkali cations such as K+ and Na+[21]. It has been proven that K+ is absolutely required for the catalytic behaviour of the hemin-PS2M complex and has the highest efficiency for coordination to the G-quadruplex[22]. Therefore, in our work, the dosage of K+ should be carefully selected. The ΔA421nm first increased along with the increase of K+ and reached a plateau at approximately 50 mmol/L. Then, it sharply decreased as the concentration of K+ continued to increase (Figure S3). This suggests that K+ could strengthen the stability of the intermolecular split of the G-quadruplex DNAzymes in a certain range, while also promoting the catalytic behaviour of the DNAzymes. Therefore, 4 hours of capture time and 50 mmol/L of K+ were chosen as the optimal parameters.
Selectivity of the Hg2+-sensing assay
To test the selectivity of the proposed Hg2+-sensing assay, control experiments were executed to evaluate whether other environmentally relevant metal ions performed similar functions as the Hg2+ in the current biosensor. Thus, 2.5 μM aliquots of other metal ions inclu-ding Zn2+, Pb2+, Cd2+, Mn2+, Ca2+, Co2+, Sn2+, Ni2+ and Cl- were added individually or in combination to the detection solution together with 25 nM Hg2+. The ΔA421nm signal was measured, and the results are presented in Figure 4. It shows that all of the other metal ions presented only slight effects on the UV-Vis absorption of the sensing system, indicating that the sensing assay described herein exhibits a high specificity for Hg2+ against other metal ions.
Figure 4. The selectivity of the Hg2+-sensing assay in the presence of 25 nM Hg2+ and 2.5 μM other ions, while the concentration of Cl- is 0.25mM.
Quantitative detection of mercury ions
In the quantitative analysis, the prepared sensing assay was incubated with different amounts of Hg2+ under the optimal conditions to obtain a calibration curve. The data in Figure 5 show that with increasing concentrations of Hg2+, the ΔA421nm signals obviously increased. A linear response was obtained for Hg2+ concentrations ranging from 2 nM to 50 nM, according to the equation ΔA421nm = 9.17×10⁻³ + 6.26×10⁻⁴cHg2+ (nM) with a correlation coefficient 0.9890 and a P-value 0.023 at the 95% confidence level. The detection limit of 0.8 nM was obtained by evaluating the average response of the blank plus three times the standard deviation. Such a result was more sensitive than the colorimetric biosensor [23,24] and electrochemical methods [25] for Hg2+ detection. According to the reference values, which are supplied by American government, the limit for the concentration of Hg2+ in drinking water is 10 nM. Given the sensitivity and specificity of this method, we expect that it will be a promising tool for practical Hg2+ analysis.
Figure 5. The calibration curve corresponding to the ΔA421nm of the Hg2+ sensing assay with different Hg2+ concentrations after 10 min of catalytic reaction. The inset presents the amplification of the linear range from 2 nM to 50 nM.
Application to sample analysis
To validate the practical application of our proposed method, several environmental water samples including industrial waste water, tap water and lake water were analysed using the proposed Hg2+-sensing assay. Furthermore, samples spiked with a certain amount of Hg2+ were detected according to the general procedure with three replicates. The results are shown in Table 2. Satisfactory recovery values between 95.0 and 106.0% demonstrated that the biosensor system can be successfully applied to Hg2+ analysis in real environmental samples.
Table 2. Results of the actual samples*
Sample |
Hg2+ measured(nmol/L) |
CVAAS (nmol/L)** |
Addition of Hg2+(nmol/L) |
Detection of Hg2+(nmol/L) |
Recovery(%) |
running water |
not detected |
not detected |
20.0 |
19.0 |
95.0 |
river water |
not detected |
not detected |
20.0 |
20.7 |
103.5 |
industrial wastewater |
4.6 |
4.8 |
15.4 |
21.2 |
106.0 |
* All data in the table were the average of three independent experiments.
** The data were obtained by cold vapor atomic absorption spectrometry.
Conclusions
In summary, a colorimetric method for the detection of aqueous Hg2+ was established based on intermolecular split G-quadruplex DNAzymes and magnetic nanoparticles. Compared with non-split DNAzymes, the employment of intermolecular split DNAzymes made the design of the experiment more flexible. The aforementioned experiments have shed light on the important architectural features of split G-quadruplex DNAzymes required. In our work, several key factors such as the base sequences and lengths of the component strands of the split G-quadruplex have been discussed. It was determined that the intermolecular split DNAzymes and their catalytic activity were heavily influenced by such characteristics. We have suggested that more complementary bases and a higher affinity between the free forms of strand B and C would damage the design of the nanoparticles as carriers of the recognising strands would remove other co-existing interfering ions and minimise the background. This assay enabled the sensitive and selective detection of Hg2+. The sensing assay can also be applied in practical aqueous systems to determine the content of Hg2+. Given the sensitivity and specificity of this method, we expect that it will be a promising tool for practical Hg2+ analysis.
Acknowledgement
This work was supported by the National Nature Science Foundation of China (Grant no. 21175045, 21275054) and the Ministry of Science and Technology (Grant no. 2011YQ150078).
References
- Nolan EM, Lippard SJ (2008) Tools and tactics for the optical detection of mercuric ion. Chem Rev 108: 3443-3480. [crossref]
- Magos L, Clarkson TW (2006) Overview of the clinical toxicity of mercury. Ann Clin Biochem 43: 257-268. [crossref]
- Cotton F, Wilkinson G, Murillo C, Bochmann M (1999) Advanced Inorganic Chemistry Wiley. New York 598-629.
- Zhang WB, Su ZF, Chu XF, Yang XA (2010) Evaluation of a new electrolytic cold vapor generation system for mercury determination by AFS. Talanta 80: 2106-2112. [crossref]
- Gao Y, Shi M, Long Z, Wu P, Zheng C, Hou X (2012) Determination and speciation of mercury in environmental and biological samples by analytical atomic spectrometry. Microchemical Journal, 103: 1-14.
- Chen B, Heng S, Peng H, Hu B, Yu X, et al. (2012) Magnetic solid phase microextraction on a microchip combined with electrothermal vaporization-inductively coupled plasma mass spectrometry for determination of Cd, Hg and Pb in cells. Journal of Analytical Atomic Spectrometry: 25
- Kong DM, Wu J, Wang N, Yang W, Shen HX (2009) Peroxidase activity-structure relationship of the intermolecular four-stranded G-quadruplex-hemin complexes and their application in Hg2+ ion detection. Talanta 80: 459-465.
- Kavitha R, Stalin T (2014) A highly selective chemosensor for colorimetric detection of Hg2+ and fluorescence detection of pH changes in aqueous solution. Journal of Luminescence 149: 12-18.
- Ge J, Li XP, Jiang JH, Yu RQ (2014) A highly sensitive label-free sensor for Mercury ion (Hg2+) by inhibiting thioflavin T as DNA G-quadruplexes fluorescent inducer. Talanta122: 85-90.
- Li C, Dai P, Rao X, Shao L, Cheng G, He P, Fang Y (2015) An ultra-sensitive colorimetric Hg2+-sensing assay based on DNAzyme-modified Au NP aggregation, MNPs and an endonuclease. Talanta 132: 463-468.
- Zhang J (2014) A Symmetrically Split G-quadruplex DNAzymes Biosensor Based on Magnetic Nanoparticles for the Rapid Detection of Hg2+. Acta Chim Sinica 72: 1029-1035
- Nakayama S, Sintim HO (2009) Colorimetric Split G-Quadruplex Probes for Nucleic Acid Sensing: Improving Reconstituted DNAzyme’s Catalytic Efficiency via Probe Remodeling. Journal of the American Chemical Society 131: 10320-10333.
- Deng M, Zhang D, Zhou Y, Zhou X (2008) Highly effective colorimetric and visual detection of nucleic acids using an asymmetrically split peroxidase DNAzyme. Journal of the American Chemical Society 130: 13095-13102.
- Li T, Wang E, Dong S (2009) Base-pairing directed folding of a bimolecular G-quadruplex: new insights into G-quadruplex-based DNAzymes. Chemistry 15: 2059-2063. [crossref]
- Kong DM, Cai LL, Shen HX (2010) Quantitative detection of Ag(+) and cysteine using G-quadruplex-hemin DNAzymes. Analyst 135: 1253-1258. [crossref]
- Kong DM, Wang N, Guo XX, Shen HX (2010) 'Turn-on' detection of Hg2+ ion using a peroxidase-like split G-quadruplex-hemin DNAzyme. Analyst 135: 545-549. [crossref]
- Jin R, Gaffney BL, Wang C, Jones RA, Breslauer KJ (1992) Thermodynamics and structure of a DNA tetraplex: a spectroscopic and calorimetric study of the tetramolecular complexes of d(TG3T) and d(TG3T2G3T). Proceedings of the National Academy of Sciences of the United States of America 89: 8832-8836.
- Wang Y, Patel DJ (1993) Solution structure of the human telomeric repeat d AG3(T2AG3)3 G-tetraplex, Structure (London, England : 1993) 1: 263-282.
- Ambrus A, Chen D, Dai DX, Bialis T, Jones RA, Yang DZ (2006) Human telomeric sequence forms a hybrid-type intramolecular G-quadruplex structure with mixed parallel/antiparallel strands in potassium solution, Nucleic Acids Research 34: 2723-2735.
- Gellert M, Lipsett MN, Davies DR (1962) Helix formation by guanylic acid. Proc Natl Acad Sci U S A 48: 2013-2018. [crossref]
- Sen D, Gilbert W (1990) A sodium-potassium switch in the formation of four-stranded G4-DNA. Nature 344: 410-414. [crossref]
- Travascio P, Li Y, Sen D (1998) DNA-enhanced peroxidase activity of a DNA-aptamer-hemin complex. Chem Biol 5: 505-517. [crossref]
- Zhu D, Luo J, Rao X, Zhang J, Cheng G, et al. (2012) A novel optical thrombin aptasensor based on magnetic nanoparticles and split DNAzyme. Anal Chim Acta 711: 91-96. [crossref]
- Wu J, Li L, Zhu D, He P, Fang Y, Cheng G (2011) Colorimetric assay for mercury (II) based on mercury-specific deoxyribonucleic ac-id-functionalized gold nanoparticles. Analytica Chimica Acta 694: 115-119.
- Wu J, Li L, Shen B, Cheng G, He P, Fang Y (2010) Polythymine Oligonucleotide-Modified Gold Electrode for Voltammetric Determina-tion of Mercury (II) in Aqueous Solution Electroanalysis 22: 479-482.